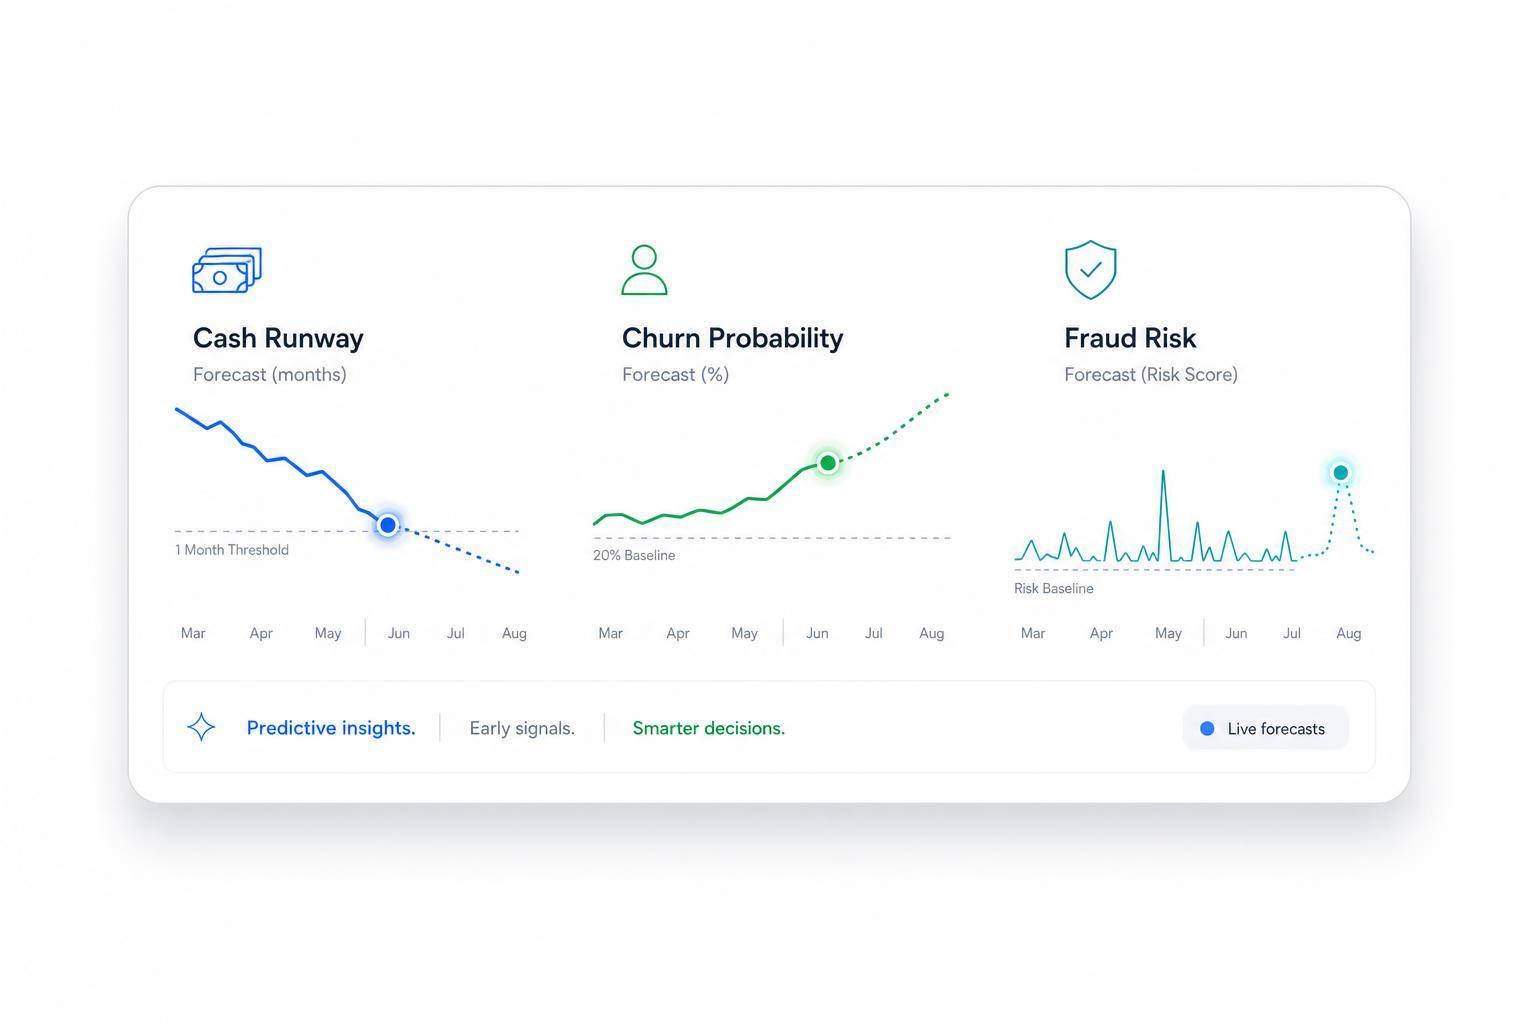
Most startups do not fail because they lack ideas. They fail because they run out of cash. This guide boils startup resource allocation down to a simple system: split spending across product, growth, and internal finance/ops; track burn, runway, and output every month; and fund new bets only after core costs are covered.
If I had to sum up the article in plain English, it would be this:
- Know your limits: cash, team capacity, founder time, and tools
- Put spending into 3 buckets: product/infrastructure, growth/customer work, and finance/internal ops
- Use a simple split: often 70-20-10, with tighter versions like 80-15-5 when runway is short
- Start with runway first: for example, $600,000 ÷ $75,000 monthly burn = 8 months
- Review every month and quarter: close books in 5–7 business days, then compare plan vs. actuals
- Cut or reset weak projects: if they show no payback after two quarters
A few numbers from the article stand out. Engineering often takes 40%–60% of total burn. Sales and marketing can take 30%–50% at Series A and later. And when runway drops below 12–18 months, new bets usually need a tighter cap, often around 5%–10% of burn.
Here’s the core idea: fund the work that keeps the business alive first, then use what is left for tests and growth. That means payroll, infrastructure, compliance, and direct revenue work come before side projects.
| Area | What to watch | Common guardrail |
|---|---|---|
| Product & infrastructure | Core feature work, uptime, cloud costs | Side work capped at 10%–20% of engineering time when runway is under 12 months |
| Growth & customer work | CAC, payback, churn, support load | Sales/marketing tied to payback and ARR goals |
| Finance & internal ops | Close speed, hiring costs, tax/reporting | Often 10%–20% of total spend, based on stage |
So if you want a simple takeaway, it’s this: treat allocation like a monthly math problem, not a gut-feel problem. The rest of the article shows how to do that with clear buckets, clear rules, and clear review points.
The Core Resource Buckets Startups Need To Fund
Founders need a simple way to see where cash and headcount are going. In most startups, spending falls into three buckets: product & infrastructure, growth & customer operations, and finance, hiring & internal operations.
That structure makes tradeoffs easier to see. You’re deciding how much to put into new bets, how much to put into demand, and how much to spend to keep the business running cleanly. The mix shifts by stage, but the logic stays the same: fund the core, fund demand, and protect runway.
Product and Infrastructure: Building the Core Without Overspending
For software startups, engineering and product management are often the biggest cost drivers. In U.S. markets, they frequently account for 40–60% of total burn. After that, cloud infrastructure, security tooling, and contractor costs usually follow.
The hard part isn’t spotting the spend. It’s deciding whether the work needs to happen right now.
Must-have work usually includes:
- Anything tied to the core value proposition
- Uptime and reliability
- Security and compliance needs such as SOC 2 or HIPAA, where those apply
- Technical debt that is actively slowing delivery
A good rule when runway is under 12 months: fund work tied to core value, compliance, or proven demand, and cap everything else at 10–20% of engineering capacity.
On the infrastructure side, simple unit metrics can save a lot of money. Track cost per active customer or cost per API call. Those numbers can flag overprovisioned resources before the problem snowballs. Once ARR is in place, a practical internal guardrail is to keep infrastructure at or below 15–20% of revenue.
Once the core is steady, the next call is pretty straightforward: put more into demand or put more into retention.
Growth and Customer Operations: Funding Acquisition, Retention, and Support
When product–market fit starts to come into view, growth spend matters more. At Series A and later, U.S. B2B SaaS companies often put 30–50% of total spend into sales and marketing. Early-stage companies also often spend $1–$2 in sales and marketing for each $1 of new ARR.
This is where metrics need to lead the budget, not gut feel. Use CAC, CAC payback, conversion rate, and churn to decide how much to spend. For most mid-market and enterprise SaaS companies in the U.S., investors commonly expect CAC payback in the 12–24 month range. SMB-focused products should target a shorter window.
Customer success and support matter just as much as acquisition because they feed retention and expansion. Spend in this area ties closely to net revenue retention and customer satisfaction measures like NPS and CSAT. A 5% improvement in retention can increase customer lifetime value by 25–95%, and systematic customer success programs can drive 10–15% increases in expansion revenue. For mature companies, a sound target is keeping support costs at 10–15% of revenue while holding CSAT at 90% or higher.
Every growth hire and every campaign should connect to a clear target, whether that’s CAC, payback, or ARR. If CAC climbs or payback stretches, that same framework makes cuts easier to spot.
As spending grows, finance and internal systems need to keep up. If they don’t, the numbers stop being useful.
Finance, Hiring, and Internal Operations: The Systems That Protect Runway
This bucket covers the systems that keep hiring, closes, tax, and reporting from slowing the business down. It includes recruiting, payroll, legal, accounting, tax, and workflow automation. Many startups underfund this area until it starts blocking hiring or delaying closes.
In many cases, putting 10–20% of total spend into these systems, depending on stage, pays off in two clear ways. First, founders get dependable data on burn, runway, and obligations, which helps them make better calls across the other two buckets. Second, it lowers the odds of expensive surprises, like tax penalties, compliance problems, or a bad hire that burns salary budget for months with little to show for it.
Lucid Financials centralizes bookkeeping, tax, tax credits, and CFO support so founders can keep burn, runway, and reporting current.
sbb-itb-17e8ec9
Practical Frameworks for Balancing Innovation and Efficiency
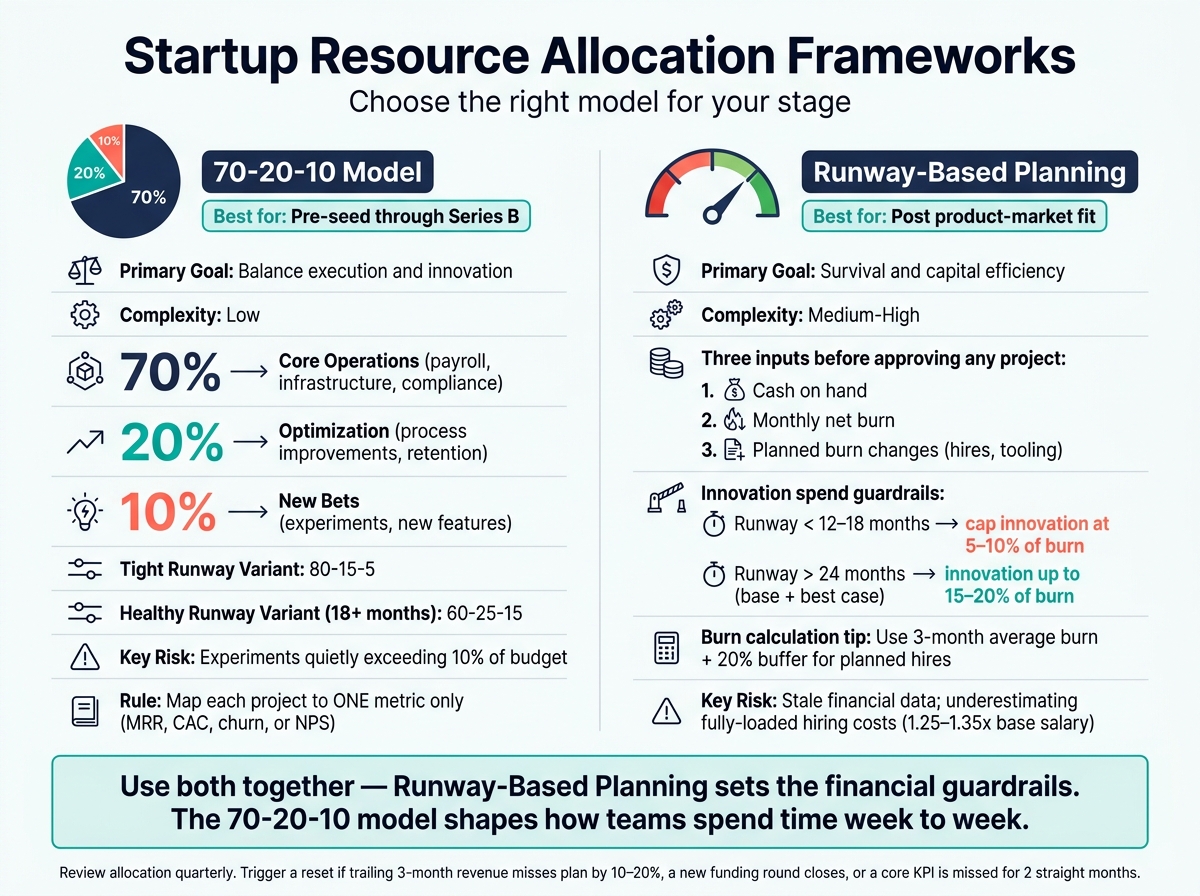
Startup Resource Allocation Frameworks: 70-20-10 vs Runway-Based Planning
These three frameworks give founders a repeatable way to balance today’s work with tomorrow’s bets. The point isn’t to find some perfect split. It’s to protect runway while still leaving space to try new things.
Using 70-20-10 To Split Core Work, Improvements, and New Bets
The 70-20-10 model splits team capacity and budget into three buckets: 70% for core operations, 20% for optimization, and 10% for new bets.
Turn that split into headcount limits and budget caps, then review it every quarter.
The ratio should change as the company changes. If runway is tight, an 80-15-5 split is safer. If runway is above 18 months and revenue is steady, moving closer to 60-25-15 can speed up innovation.
A simple rule helps here: map each project to one metric only. That might be MRR, churn, CAC, or NPS. If a project is tied to everything, it’s usually tied to nothing.
Runway-Based Allocation: Start With Cash, Then Assign Headcount and Budget
Once you set the split, pressure-test it against cash and hiring plans.
Before you approve any project, start with three numbers in USD:
- Cash on hand
- Monthly net burn
- Planned burn changes from hires or new tooling
From there, model base, best, and downside cases using cash on hand and monthly burn.
Then assign headcount and project budgets only after you cover the costs you can’t dodge, like payroll, infrastructure, and compliance. After that, add optimization work and new bets. Keep innovation spending at 5% to 10% of burn when downside runway drops below 12 to 18 months. Move it up to 15% to 20% only when both base and best-case runway are above 24 months.
Use a 3-month average burn, add 20% for planned hires and growth spend, and count only cash that has actually been collected.
Lucid Financials supports this kind of modeling with cash-flow visibility, scenario planning, and board-ready reporting.
Framework Comparison Table for Startup Planning
Use the table below to pick the lightest framework that fits your stage. Each one solves a different problem.
| Framework | Best Startup Stage | Primary Goal | Complexity | Common Risks |
|---|---|---|---|---|
| 70-20-10 | Pre-seed through Series B | Balance execution and innovation at the team level | Low | Misclassifying work; experiments quietly exceeding 10% of budget |
| Runway-Based Planning | Startups approaching or beyond product-market fit | Survival and capital efficiency | Medium-High | Stale financial data; underestimating fully-loaded hiring costs (typically 1.25–1.35x base salary in the U.S.) |
These frameworks work better together than alone. Runway-based planning sets the financial guardrails. The 70-20-10 model shapes how teams spend time week to week.
How To Run Resource Allocation Month by Month
Build a Simple Allocation Process Across Monthly and Quarterly Reviews
The goal here is simple: build a rhythm your team can repeat, not a bloated finance setup. Once you decide on your allocation split, review it every month and every quarter. That keeps new bets funded without letting the core business drift.
On the monthly side, close your books within 5–7 business days after month-end. A workable close checklist usually looks like this:
- Reconcile bank and credit card accounts
- Categorize expenses
- Post accruals
- Generate your P&L, cash flow statement, and balance sheet
After the close, compare budget vs. actuals by department. For most startups, that means Product, Growth, and G&A. Flag any variance above 10% or $5,000 and add a one-line note. Monthly closes show what changed. Quarterly reviews decide what to change next.
Quarterly reviews should go a layer deeper. This is the point where you set or reset OKRs, approve headcount by function, and run base, stretch, and downside scenarios. Every funded initiative needs one owner, a budget ceiling, target KPIs, and a timeline. The owner should also know what gets cut if the work slips. If a team misses targets for a full quarter, reset, pause, or cut the initiative.
Set reallocation triggers ahead of time instead of making calls in the heat of the moment. Three cases should prompt a review automatically: trailing three-month revenue is off plan by more than 10–20%, the company closes a new funding round, or a core KPI is missed for two straight months. After a fundraise, reset the plan before approving new spend or headcount.
Measure Both Financial Health and Output From New Initiatives
Financial metrics tell you how long you can keep funding the work. Operating metrics tell you whether that work is paying off.
Track gross burn, net burn, and runway every month. For example, if gross burn is $250,000 and revenue is $80,000, net burn is $170,000. If the company has $1,700,000 in cash, that gives you 10 months of runway. Use the same trailing 3-month average from planning to smooth out month-to-month swings before making allocation decisions.
Then pair those figures with operating signals. Deployment frequency is a useful stand-in for engineering throughput; when it drops, capacity is often blocked. If engineering spend is high but deployment frequency stays low, that points to a resource allocation issue, not only a workflow issue. Support backlog works the same way. A healthy queue is roughly 1–3 days of work. Anything above 5 days points to a capacity gap.
When spend climbs faster than output, move money before the gap gets worse. For each initiative, compare direct cost with measurable outcomes like incremental MRR, lower churn, or fewer support tickets. If an initiative still has no measurable payback after two quarters, cut it or reset it.
Use Real-Time Financial Data To Make Faster Allocation Decisions
Clean books help teams move faster. When your monthly close wraps within a week, you can compare actuals to plan while the details are still clear, spot rising costs before they snowball, and model the effect of a new hire or a marketing push before saying yes. Scenario modeling - running base, best, and downside cases against current burn - turns hiring and spend choices into structured tradeoffs instead of gut calls.
Lucid Financials closes books in seven days, integrates directly with Slack for instant answers on burn and spend, and delivers current investor-ready reporting that updates as plans change.
Conclusion: A Simple System for Smarter Startup Allocation
Good resource allocation means making clear tradeoffs with limited cash, headcount, and time. The goal is simple: back efficiency without starving innovation.
To turn that idea into day-to-day action, use a simple operating rhythm built around four habits.
- Define your spending buckets: product and infrastructure, growth and customer operations, and finance and internal operations.
- Protect core work first, then fund experiments with whatever capacity is left.
- Use your framework as a guide, not a hard rule. The 70-20-10 split helps keep balance; runway-based allocation works better when cash is tight.
- Review on a set rhythm: monthly reviews to spot what changed, and quarterly reviews to decide what to change next.
Here’s what that looks like in practice:
| Timeframe | Action |
|---|---|
| Days 1–15 | Define buckets, map spend, calculate essential financial metrics like burn and runway. |
| Days 16–30 | Pick one framework and tag each project as Core, Improvement, or New Bet. |
| Days 31–60 | Schedule reviews and build simple dashboards. |
Once this rhythm is in place, reporting gets cleaner and decisions get faster. If finance is slowing execution, Lucid Financials can close your books in seven days and surface real-time burn and runway data in Slack.
FAQs
How do I choose between 70-20-10 and 80-15-5?
Choose the mix based on your risk tolerance and how fast you need results.
Use 70-20-10 if you can afford some testing:
- 70% core operations
- 20% adjacent growth
- 10% transformational bets
Use 80-15-5 if protecting cash matters more:
- 80% core operations
- 15% selective growth
- 5% innovation experiments
Then rank initiatives by runway, confidence in payback, and market urgency.
What should I cut first when runway gets tight?
Cut growth spending first. Start by setting a minimum runway target. Then pause or scale back work based on two things: payback confidence and how urgent the market is.
Here’s the simple rule:
- Fund scores of 7–9 hard
- Fund scores of 5–6 with care
- Anything below 5 should shift toward protecting cash
Also pause spending that misses pre-agreed kill criteria. That matters most when benchmarks aren’t hit or runway falls below four quarters. Make those cuts before you add new hires or pull back core operations.
Which metrics matter most for monthly allocation decisions?
Start with your business’s financial health: net burn and runway.
Net burn is your monthly cash outflows minus inflows. Runway is your cash on hand divided by net burn. These two numbers set the baseline for every budget call. If you don’t know them cold, it’s hard to make smart spending moves.
You should also track a small set of core metrics on a monthly basis and compare them against your forecasts:
- Revenue
- Expenses
- Cash position
- LTV:CAC
- CAC payback period
As a rule of thumb, aim for at least a 3:1 LTV:CAC ratio and a CAC payback period under 12 months. Those targets help you see whether your growth engine is working or just burning cash.