If you don’t know your cash, burn, and runway every month, you’re making decisions too late. I’d keep this simple: track the three statements every month, define a small KPI set, connect each number to one source, and use the output for dashboards, board reporting, and scenario planning.
Here’s the short version:
- I’d start with the P&L, balance sheet, and cash flow statement
- I’d track cash balance, net burn, runway, MRR/ARR, gross margin, and budget vs. actuals
- I’d give each metric one formula, one owner, one source, and one update schedule
- I’d use the GL, bank feeds, billing, payroll, and CRM to keep numbers in one place
- I’d review cash weekly and close the books within 5–10 business days
- I’d use base, upside, and downside cases to test hiring, spend, pricing, and timing for the next funding step
A simple example shows why this matters: if I have $600,000.00 in cash and burn $75,000.00 per month, I have 8 months of runway. If I add hires too soon, that cushion can drop fast.
What I like about this approach is that it turns finance from a record of the past into a tool for the next decision. That’s the whole point.
1. Define the framework: statements, metrics, and rules
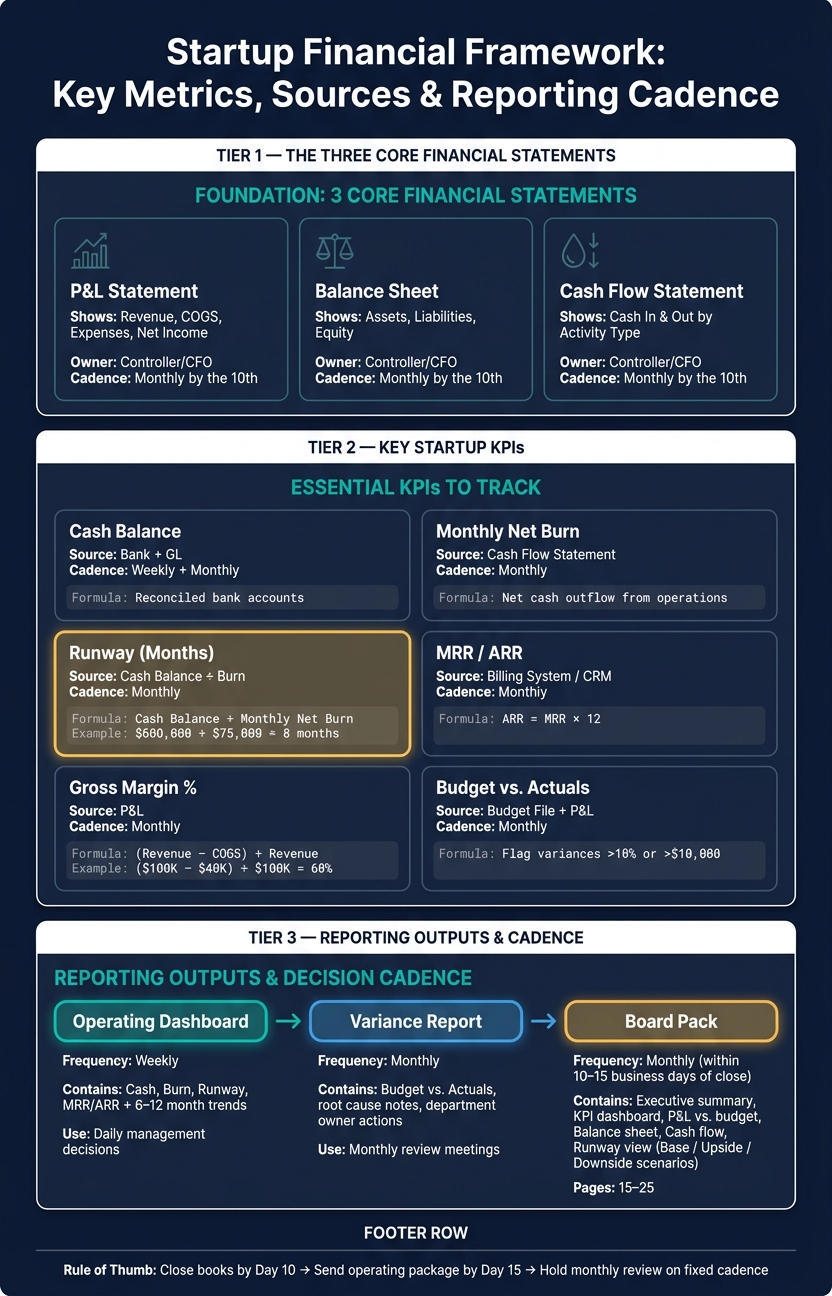
Startup Financial Framework: Key Metrics, Sources & Reporting Cadence
Before you build a dashboard or run a forecast, set the foundation first. Decide which financial statements you’ll produce, which metrics you’ll track, and how each one will be defined every single time. That’s what keeps reporting steady and makes monthly decisions a lot faster. Once those statements are locked in, focus on the small set of metrics that shape monthly decisions.
Start with the three core financial statements
Every startup’s financial framework should include a Profit and Loss (P&L) statement, a Balance Sheet, and a Cash Flow Statement every month.
The P&L shows revenue, COGS, expenses, and net income. The Balance Sheet shows assets, liabilities, and equity on a given date. The Cash Flow Statement shows how cash moved in and out of the business.
You need all three. If you look only at the P&L, you can miss a liquidity problem that’s building quietly in the background.
Choose a short list of startup KPIs
Track only the numbers leadership can review fast and act on fast: cash balance, monthly net burn, runway, MRR or ARR, gross margin, and budget vs. actuals. These are the numbers that should shape monthly decisions.
Write the formulas down so reporting stays consistent. Runway = cash balance ÷ monthly net burn. Gross margin % = (Revenue – COGS) ÷ Revenue. If revenue is $100,000.00 and COGS is $40,000.00, your gross margin is 60%.
Add CAC and LTV only when the data is reliable. A good benchmark is an LTV:CAC ratio above 3:1.
Document metric definitions and reporting cadence
Metric drift usually starts when people use different definitions for the same number. The fix is pretty simple: give each metric one definition, one owner, one source, and one cadence.
The table below sets a single source for metric ownership, timing, and definition. That helps keep the framework steady as the business grows.
| Component | Purpose | Source Data | Owner | Cadence |
|---|---|---|---|---|
| P&L Statement | Revenue, expenses, net income | Accounting GL + bank feed | Controller/CFO | Monthly (by the 10th) |
| Balance Sheet | Assets, liabilities, equity | Accounting GL | Controller/CFO | Monthly (by the 10th) |
| Cash Flow Statement | Cash movement by activity type | Accounting GL + bank feed | Controller/CFO | Monthly (by the 10th) |
| Cash Balance | Available cash at month-end | Bank accounts + GL | CFO | Weekly + monthly |
| Monthly Net Burn | Net cash outflow from operations | Cash Flow Statement | CFO | Monthly |
| Runway (Months) | Months until cash is depleted | Cash balance ÷ burn | CFO | Monthly |
| MRR / ARR | Recurring revenue growth | Subscription billing system or CRM; ARR = MRR × 12 | RevOps Lead | Monthly |
| Gross Margin % | Product/service profitability | P&L (Revenue, COGS) | Finance Manager | Monthly |
| Budget vs. Actuals | Spending control vs. plan | Budget file + P&L | CFO | Monthly |
| CAC | Cost to acquire one new customer | CRM + GL (sales and marketing expenses) | Growth Lead | Monthly/Quarterly |
| LTV | Long-term gross profit per customer | Subscription analytics | RevOps Lead | Quarterly |
Define each metric once, then report it the same way every month. Lucid Financials can help keep the books clean and reporting up to date as the company grows.
sbb-itb-17e8ec9
2. Build the data pipeline and single source of truth
The next step is turning defined metrics into inputs you can trace. A metric definition only helps if the number comes from a source you trust.
Map every data source behind each number
Every KPI in your framework ties back to at least one system. Before you build a report, document that link. Create a data registry that lists each metric, its formula, source, owner, and refresh cadence.
For a typical U.S. startup, the source map often looks like this:
| KPI | Primary Source(s) | Secondary Source |
|---|---|---|
| MRR / ARR | Billing system, accounting system, payment processor | CRM |
| Monthly Burn | Bank accounts, accounting GL | Corporate cards, AP tools, payroll |
| Cash Balance | Reconciled bank accounts | GL cash accounts |
| CAC | GL (sales and marketing expenses) | CRM (new customers recorded) |
| Gross Margin % | P&L (Revenue, COGS) | Accounting GL |
| Headcount / Payroll Cost | Payroll system (Gusto, Rippling) | HRIS, GL |
Each board number should point to one clear source. If two people pull revenue from two different systems and land on two different answers, the issue isn’t math. It’s governance.
After each KPI has a named source, automate the refresh.
Centralize data and automate recurring updates
Use the accounting GL as your system of record, backed by reconciled records and steady definitions. Turn on bank feeds for all checking and savings accounts so transactions import daily. Connect your payment processor - Stripe, PayPal, or Square - right to the GL so revenue and fees post without manual work. Set up your payroll tool to push payroll journals after each run.
The update schedule should match the decision in front of you:
- Daily for cash
- Weekly for burn
- Monthly for close
Automating data movement cuts manual mistakes and keeps reporting current.
Use tools that keep books clean and reporting current
The stack matters less than discipline. Still, good integrations make discipline easier. A clean GL, connected bank feeds, and a payroll system that posts automatically will take most early-stage startups pretty far.
For startups that want an integrated operating stack, Lucid Financials combines bookkeeping, tax, tax credits, and CFO support in one platform, with Slack access and investor-ready reporting.
Once the pipeline is in place, you can turn that data into reports leaders can actually use. That base makes dashboards, variance reports, and board packs faster to produce.
3. Design reports that drive decisions
Once your data lives in one place, turn it into three clear outputs: the operating dashboard, the variance report, and the board pack. Each one has a different job.
Use the dashboard for weekly management. Use the variance report for monthly review. Use the board pack for external updates.
Build a simple operating dashboard
A good dashboard should answer the big management questions at a glance. The easiest way to do that is to split it into three bands.
At the top, show cash, burn, runway, and MRR/ARR. These are the numbers that tell you if the business is safe right now.
In the middle, show 6–12 months of trends for revenue, gross margin, operating expense, and headcount. This is where you see whether performance is moving in the right direction or drifting off course.
At the bottom, track expense mix, contribution margin, and receivables/payables days. That gives you a read on efficiency.
Keep the total number of metrics to 10–15. More than that, and the dashboard starts to feel like a wall of numbers instead of a management tool. Use red/yellow/green status markers so people can scan it fast. And format everything in standard U.S. style - $X,XXX.XX and MM/DD/YYYY - so no one has to stop and decode what they’re seeing.
Add budget vs. actual and variance analysis
A budget vs. actual report should do more than point at a number and say, “this changed.” It should explain why it changed.
Most variance drivers tend to come from the same places:
- Headcount
- Software and vendor spend
- Marketing efficiency
- Pricing
- Collections timing
For any variance above 10% or $10,000, add a short note on the root cause and the next action. That’s the part that turns a variance table into something people can act on, instead of a history lesson no one can change.
It also helps to assign each variance to the department leader closest to it. That way, the explanation and action plan come from the team that knows the driver best. When leaders walk into the monthly review with a short summary of what changed, why it changed, and what they’ll do next, the meeting usually moves faster and leads to better calls.
Prepare a standard monthly board report
For board reporting, keep the format the same every month. The board pack is just the external version of your operating reports: the same core data, laid out in a fixed structure.
Keep the package to 15–25 pages, and push extra detail into appendices. The main package should include the same six sections, in the same order, every month:
- Executive summary
- KPI dashboard
- P&L vs. budget
- Balance sheet
- Cash flow statement
- Runway view
That consistency matters. When the format never changes, board members can spot actual changes faster.
The runway view needs extra care. Show current cash on hand, average monthly net burn over the trailing three to six months, and calculated runway in months under base, upside, and downside scenarios. A simple waterfall chart that explains cash movements can help a lot here. And send the package within 10–15 business days after close, while the numbers still matter for the board discussion.
Automate consolidation to cut board-prep time and version errors.
4. Put the framework to work for planning and control
Once reporting is standardized, you can use the framework to pressure-test decisions before you commit cash.
Run cash runway and scenario models
Runway is cash divided by burn. That gives you a simple way to check whether the cash you have today can support the plan in front of you. To calculate burn, use trailing 3- to 6-month cash flow and remove one-time items so the average doesn’t get thrown off by noise.
Then stress-test runway across three cases: add hiring, cut discretionary spend, and model a revenue downside. This is where the framework starts doing actual work.
If hiring two engineers takes runway from 14 months down to 11, that tells you something before you send the offer letter. If a 20% cut in discretionary spend gives back two months of runway, spell out that tradeoff in the model. And if revenue lands 20% below plan for three months, the downside case often shows whether you need to move a fundraising conversation up by three to six months.
Use 18–24 months of runway as the baseline. If runway drops below 12 months, treat that as a prompt to act - either trim costs or start the next raise. Update these scenarios after each close.
Use metrics to guide hiring, pricing, and spend decisions
Runway by itself isn’t the decision. The real decision comes from the story behind the scenario. Use the same numbers to set guardrails for hiring, pricing, and spend.
For hiring, ask a simple question: does this role keep runway above your floor, and can it improve gross margin over time? At pre-seed and seed, many U.S. startups aim to keep at least 12–18 months of runway after the hire. At Series A and later, add team output metrics like revenue per employee or sales quota attainment to check whether the business can carry more headcount.
For marketing and pricing, CAC, LTV, and payback period are the main levers. A healthy SaaS business often aims for an LTV:CAC ratio of at least 3:1 and a CAC payback period under 12–18 months. If CAC keeps climbing and payback stretches past that range, the framework should trigger a channel review instead of a gut decision. The same logic applies to pricing. Before you increase prices or add a new tier, model the effect on gross margin and LTV first.
For software and contractor spend, run a quarterly audit against department-level budgets. Compare actuals to budget line by line, then ask whether each cost ties back to measurable output. Cutting $18,000 per month in overlapping SaaS tools while keeping engineering velocity steady, for example, can extend runway by about 2.3 months without touching headcount.
Keep a consistent monthly close and update the framework over time
A steady close process is what keeps the framework honest. Aim to close the books by the 10th business day of the next month. That gives you enough time to send the operating package by the 15th and hold the monthly review on a set cadence.
As the company grows, expand the KPI set and lengthen the forecast horizon as the business model matures. Review KPI definitions at least once a year, and update them whenever the model changes in a meaningful way. The framework has to stay current. Monthly refreshes, KPI reviews, and rolling forecast updates are what keep it useful as the business changes.
Lucid Financials can help automate the close process, send runway and burn updates straight to founders in Slack, and produce investor-ready reports on a fixed schedule - so the framework keeps running without needing a full-time finance team to hold it together.
Conclusion: Keep the framework simple, consistent, and usable
A good financial framework stays simple: clean data, standard definitions, and one source of truth. That’s what makes the numbers usable in day-to-day work. Your dashboards, board packs, and forecasts all rest on that base.
Reconcile accounts, code transactions the same way each time, and define every KPI once. When MRR, burn, and runway mean the same thing across teams, reporting gets faster and decisions get clearer.
Once your inputs are reliable, speed becomes the next edge. If you can finish the close in 5–10 business days, leaders get runway and burn data early enough to act. That might mean cutting spend, pushing back a hire, or moving a fundraising talk forward.
After the process is steady, automate the repeatable work: transaction syncing, dashboard refreshes, and standard monthly report packs. If your inputs are messy, automation just spreads mistakes. Once the base is in place, Lucid Financials can help automate reporting and keep finance workflows in one place.
Start with essential financial metrics like runway, burn, cash balance, and MRR growth. A framework you use every month is worth more than a complicated one that gets ignored. Simple, steady reporting beats complex reporting that no one trusts.
FAQs
How often should I update my financial dashboard?
Your financial dashboard should update in real time so it reflects the latest numbers, not last week’s snapshot. When you connect your accounting, payroll, and banking systems to a platform like Lucid Financials, you can cut down on manual entry and keep metrics like cash runway and burn rate in line with current activity.
That said, automation isn’t a free pass to go on autopilot. A formal monthly variance analysis still matters. It helps you compare actual results against your forecasts, spot gaps in your assumptions, and make adjustments before small issues turn into bigger problems.
What should I do if my data sources don’t match?
Reconcile the discrepancies to create a single source of truth. Start by removing duplicate entries, especially when the same transaction shows up in more than one system.
Then standardize the data by mapping labels to a master chart of accounts, using a consistent date format like MM/DD/YYYY, and cross-checking key metrics to spot timing gaps, missing values, or integration errors.
When should I add CAC and LTV to my framework?
Add Customer Acquisition Cost (CAC) and Lifetime Value (LTV) as your startup moves into the growth stage, when the focus shifts to scale and efficiency. In earlier stages, teams usually watch burn rate and runway more closely. By Series A and beyond, boards tend to expect a clearer view of unit economics.
If your model leans heavily on customer retention or fundraising, bring these metrics in earlier. To keep the numbers clean, define both using exact account-level inputs before you connect your data systems.