If you want to measure growth from existing customers, track expansion MRR on a fixed starting cohort and keep it separate from new sales, churn, and one-time fees. That is the core rule.
I’d sum recurring increases from upgrades, add-ons, seats, usage, and price changes for customers active at the start of the period. Then I’d compare that number to starting MRR and pair it with NRR to see whether expansion beat downgrades and churn.
Here’s the short version:
- Expansion MRR = recurring revenue added by existing customers only
- Do not include new customer MRR or one-time service fees
- Expansion rate = Expansion MRR ÷ Starting MRR × 100
- NRR = (Starting MRR + Expansion MRR − Contraction MRR − Churned MRR) ÷ Starting MRR × 100
- Monthly close works best because it makes errors easier to spot
- Board reporting should show a clear MRR bridge, with expansion separated from new MRR
- Benchmark context matters: the article cites 101% median NRR and notes that larger SaaS companies can get about 60% of new ARR from existing customers
A simple example from the article:
- Starting MRR: $50,000
- Expansion MRR: $6,000
- Contraction MRR: $2,000
- Churned MRR: $1,500
- Ending cohort MRR: $52,500
- Expansion rate: 12.0%
- NRR: 105.0%
I’d read the article as a guide to doing three things well:
- Classify revenue correctly
- Run the same cohort math every month
- Use the output in forecasts, unit economics, and board updates
It also warns about the errors that skew results most:
- mixing new MRR into expansion
- counting implementation or consulting fees as recurring revenue
- mixing MRR and ARR
- adding monthly percentages to get an annual result
- double-counting price changes
If I had to sum it up in one line: this guide is about getting a clean view of how much your current customer base is growing on its own.
Core Inputs and Formulas
Inputs Your Calculator Needs
Every solid expansion revenue calculator starts with a fixed opening cohort and starting MRR. You’ll want to track opening MRR, period dates, currency, and account IDs. One thing matters a lot here: the starting MRR has to follow the same rule every month.
Your calculator should also track these recurring movement fields:
- Upsell MRR
- Cross-sell MRR
- Seat or usage expansion MRR
- Contraction MRR
- Churned MRR
For audit fields, record customer IDs, plan changes, effective dates, product categories, and the source system. That’s what lets you trace the numbers later and keep recurring expansion separate from new business and non-recurring revenue.
Exclude mid-period signups. Those belong in new MRR, not expansion.
Formulas for Expansion MRR, Expansion Rate, and NRR
Once the opening cohort is set, the calculator comes down to three metrics.
Expansion MRR is the sum of all recurring increases from that starting cohort:
Expansion MRR = Upsell MRR + Cross-sell MRR + Seat/Usage Expansion MRR
Put price increases into the matching expansion bucket.
$1,200 + $600 + $400 = $2,200 Expansion MRR.
The Expansion Revenue Rate shows that number against the opening cohort base:
Expansion Revenue Rate = Expansion MRR ÷ Starting MRR × 100
If you have $1,500 in expansion on a $10,000 starting MRR base, your expansion rate is 15%. Always label the time period. A monthly rate and an annual rate are not the same thing.
NRR adds contraction and churn so you can see the cohort’s net change:
NRR = (Starting MRR + Expansion MRR − Contraction MRR − Churned MRR) ÷ Starting MRR × 100
With $10,000 starting MRR, $1,500 expansion, $400 contraction, and $600 churn, the math looks like this:
NRR = ($10,000 + $1,500 − $400 − $600) ÷ $10,000 × 100 = 105%
An NRR above 100% means expansion was greater than losses. Below 100% means the cohort got smaller.
| Metric | Required Inputs | Formula | Meaning |
|---|---|---|---|
| Expansion MRR | Upsell, cross-sell, seat/usage expansion MRR | Upsell + Cross-sell + Seat/Usage Expansion | Recurring revenue added by the starting cohort |
| Expansion Revenue Rate | Expansion MRR, starting MRR | Expansion MRR ÷ Starting MRR × 100 | Expansion as a % of the opening cohort base |
| NRR | Starting MRR, expansion MRR, contraction MRR, churned MRR | (Starting + Expansion − Contraction − Churn) ÷ Starting × 100 | Net recurring revenue retained from the original cohort |
Monthly vs. Annual Measurement and Basic Data Validation
Start with monthly close data. Then roll things up only after the cohort math checks out.
Monthly measurement keeps you close to what actually happened: upgrades, seat changes, downgrades, and cancellations. That makes problems easier to spot. After that, you can roll monthly results into quarterly views to smooth out timing noise, and use annual cohort analysis for board-level reporting and planning.
One common mistake? Summing monthly percentages to get an annual number. Don’t do that. If you need an annual result, calculate it from an annual starting cohort and full-year recurring revenue movements, or use a clearly documented compounding method.
Before you publish anything, run a short validation pass:
- Make sure every figure uses MRR, not ARR, bookings, or cash collected.
- Check that the starting cohort includes only customers active at the beginning of the period, with no mid-period signups or reactivations mixed in.
- Confirm each movement has only one classification.
- Verify that upsell, cross-sell, and seat or usage expansion line items reconcile to the expansion MRR total.
Then confirm the balance formula:
Ending Cohort MRR = Starting MRR + Expansion MRR − Contraction MRR − Churned MRR
If ending MRR doesn’t match your billing or subscription data, stop there and investigate the gap before you use the numbers in a forecast or board deck.
sbb-itb-17e8ec9
Boost Your ARR: Set the Perfect Expansion Target! | SaaS Metrics School | Expansion
How to Use the Calculator Step by Step
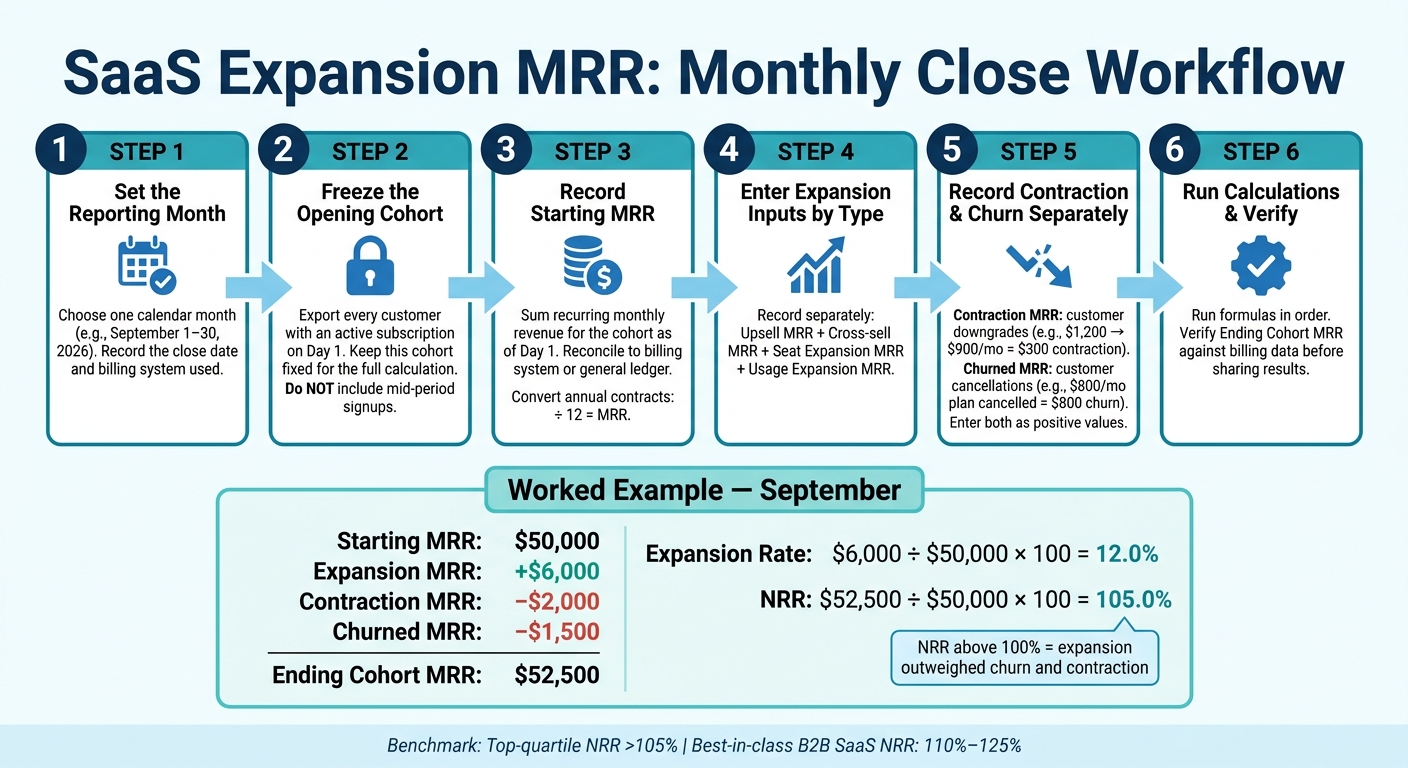
SaaS Expansion MRR Monthly Close Workflow
Calculation Workflow for a Monthly Close
After you set your inputs, follow the same monthly routine every time you close the books. That consistency matters. If you change the process month to month, your cohort numbers stop being easy to compare.
- Set the reporting month. Choose one calendar month - such as September 1–30, 2026 - and use that exact window. Write down the close date and the billing system used for the pull.
- Freeze the opening cohort. Export every customer with an active subscription on the first day of the month. Then keep that cohort fixed for the full calculation.
- Record starting MRR. Add up the recurring monthly revenue for that starting customer cohort as of day one. Reconcile the total to your billing system or general ledger. For annual contracts, convert the amount to MRR by dividing by 12.
- Enter expansion inputs by type. Record upsell MRR, cross-sell MRR, seat expansion MRR, and usage expansion MRR in separate fields. This makes it much easier to see what drove growth.
- Record contraction and churn separately. If a customer moves from $1,200 per month to $900 per month, that creates $300 of contraction MRR. If a customer cancels a plan worth $800 per month, that creates $800 of churned MRR. Enter both as positive values. The formulas subtract them later.
- Run the calculations in order, then verify ending cohort MRR against billing data before sharing results.
Worked Example Using U.S. Dollar Amounts
Here’s how that workflow looks in practice.
Say an existing-customer cohort starts September with $50,000 in starting MRR. During the month, customers upgrade plans, add seats, and expand usage, which creates $6,000 of expansion MRR. Some customers downgrade, creating $2,000 of contraction MRR. Others cancel, which adds up to $1,500 of churned MRR.
| Step | Formula | Result |
|---|---|---|
| Expansion rate | $6,000 ÷ $50,000 × 100 | 12.0% |
| Net MRR change | $6,000 − $2,000 − $1,500 | $2,500 |
| Ending cohort MRR | $50,000 + $6,000 − $2,000 − $1,500 | $52,500 |
| NRR | $52,500 ÷ $50,000 × 100 | 105.0% |
The cohort added $2,500 in net recurring revenue and finished the month at $52,500. The expansion rate shows gross growth from the cohort. NRR shows net growth after contraction and churn are taken out. Use this same sequence for each month-end close.
How to Read Positive, Flat, and Negative Results
Read the output in two layers: gross expansion and net retention.
A positive expansion rate means existing customers added recurring revenue. That sounds good, but it doesn’t tell the whole story. You still need NRR to see the net result.
A zero expansion rate means the cohort produced no measurable recurring growth. That can point to weak adoption, limited room to expand, or a data issue.
A negative net result - NRR below 100% - means contraction and churn were larger than expansion. At that point, don’t look at NRR by itself. Put it next to GRR, customer churn, CAC, gross margin, and CAC payback period. That’s where you start to see whether expansion is working well or whether retention risk is building.
| Result | What it signals | What to investigate next |
|---|---|---|
| Positive expansion rate | Existing customers added recurring revenue | Which segments, products, and customer cohorts drove the growth |
| Zero expansion rate | No measurable expansion from the cohort | Whether adoption is flat, expansion opportunities are missing, or the data is incomplete |
| NRR above 100% | Expansion outweighed churn and contraction | Whether growth is broad-based or concentrated |
| NRR below 100% | The cohort shrank in net recurring revenue | Churn reasons, downgrade patterns, product value, and customer concentration |
How Expansion Revenue Supports Unit Economics and Planning
Once your calculator is dialed in, you can use it for much more than reporting. It helps you see how expansion changes margins, which segments pull their weight, and how your installed base is likely to grow over time.
Using Expansion Revenue in Unit Economics
Expansion revenue improves the economics of customers you already have. Say a customer moves from $1,000 to $1,300 per month. That extra $300 of MRR adds about $240 in monthly gross profit at an 80% gross margin, before added support, infrastructure, or account-management costs.
But revenue growth and profitable growth aren't the same thing. A $500 monthly upsell at a 75% incremental gross margin creates $375 in gross profit. Sounds good. But if that upsell also needs $225 per month in added support, infrastructure, or account-management time, the actual contribution falls to $150.
That’s why it helps to track both expansion MRR and expansion gross profit. Otherwise, you can end up chasing top-line growth while margins quietly get squeezed.
NRR gives you the clearest view of whether expansion is making your installed base more productive. It also shapes how investors look at LTV, CAC payback, and overall unit economics.
Segment and Cohort Analysis: Finding Where Expansion Comes From
Big topline numbers can hide concentration risk. So instead of stopping at company-wide totals, break expansion down by customer segment.
| Customer segment | Starting MRR | Expansion MRR | Expansion rate | Contraction rate | Churn rate | NRR |
|---|---|---|---|---|---|---|
| SMB | $40,000 | $3,000 | 7.5% | 2.0% | 4.0% | 101.5% |
| Mid-market | $60,000 | $9,000 | 15.0% | 1.5% | 2.5% | 111.0% |
| Enterprise | $100,000 | $12,000 | 12.0% | 3.0% | 1.0% | 108.0% |
One thing jumps out fast: high expansion does not always mean the best economics. You still need to compare margin, retention, support load, and concentration risk.
Cohort analysis gives you another angle. Group customers by the month they first subscribed, then track how expansion and retention change over time. This shows which acquisition periods produced your best customers, how long expansion usually takes to show up, and whether high-expansion cohorts still look good after service costs are factored in.
Using Results in Forecasts, Board Reporting, and Scenario Models
Expansion data becomes far more useful when it feeds straight into financial planning. Forecast your installed base separately from new customer acquisition. Start with beginning MRR, apply historical expansion, contraction, and churn rates by segment, and then layer in new-logo MRR.
Instead of relying on one forecast, build three scenarios:
- Conservative: lower expansion rates and higher churn
- Base: your most likely path based on recent performance
- Upside: documented product adoption or signed expansion opportunities
That kind of setup gives you a better read on range, not just one neat-looking number.
Expansion MRR also may not turn into cash in the same month. So before you use those figures for hiring or infrastructure calls, tie the forecast to billing and collection timing.
For board reporting, keep the MRR bridge clear: beginning MRR + new MRR + expansion MRR − contraction MRR − churned MRR = ending MRR. Then report NRR separately. That makes it easy for stakeholders to see installed-base performance apart from new-logo acquisition.
You should also explain what drove expansion. Was it seat growth, usage, cross-sells, plan upgrades, or pricing changes? If most of the growth came from just a few accounts, say that plainly. For operating reviews, monthly data usually works best. For durability checks, quarterly or annual views help you spot whether the pattern holds across cohorts.
Clean classification is what keeps these planning outputs reliable.
Common Mistakes and How to Avoid Them
Most expansion calculator mistakes come from one place: putting revenue changes in the wrong bucket. Discounts, credits, and one-time charges are usually where things go sideways.
The fix is pretty simple. Start with a fixed cohort, then make sure each revenue movement gets counted once and only once.
Mixing New Customer Revenue into Expansion Calculations
Expansion MRR should show added recurring revenue from customers who were already active at the start of the measurement period. Trouble starts when a team looks at total ending MRR and compares it with beginning MRR without isolating that opening cohort.
Here’s what that looks like in practice. Say a cohort starts the month at $100,000 MRR and produces $10,000 in actual expansion. Five new customers add $8,000 more. In that case, expansion MRR is $10,000 and the expansion rate is 10%. If that extra $8,000 gets lumped in, expansion jumps to $18,000 and the rate to 18%. That overstates both expansion and NRR.
The clean way to handle this is to freeze the opening cohort first. Then compare only those customer IDs against their ending recurring MRR. Customers added after the snapshot belong in new business, not in expansion, contraction, churn, or NRR.
Counting One-Time Fees or Services as Recurring Expansion
Implementation, setup, consulting, migration, and other non-recurring charges are not expansion MRR, even if they show up on the same invoice as a subscription. MRR includes only recurring subscription revenue. A line item doesn’t count just because it sits next to a subscription charge.
Here’s a plain example. If an existing customer’s monthly plan moves from $2,000 to $2,500, and the same invoice includes a $6,000 implementation project, expansion MRR is $500, not $6,500. That $6,000 should be tracked on its own as services or non-recurring revenue.
A good gut-check is this: Does the charge recur as subscription revenue, and can it be converted cleanly to MRR?
Expansion Calculator Errors and Fixes: A Comparison Table
When something looks off, use this table to spot the cause and fix it.
| Mistake | Why it happens | Effect on expansion MRR or NRR | Fix |
|---|---|---|---|
| Adding new customer MRR to expansion | Report uses total ending MRR instead of the starting cohort | Overstates expansion and NRR | Freeze the opening cohort and exclude customers acquired during the period |
| Counting implementation or consulting fees | Invoice-level revenue is mistaken for recurring revenue | Inflates expansion MRR and future forecasts | Separate services and one-time revenue from subscription MRR |
| Double-counting a price increase | Change is included in both ending MRR and an adjustment line | Overstates expansion and ending cohort MRR | Use either movement data or beginning-versus-ending values, not both |
| Mixing ARR and MRR | Inputs lack a common unit | Produces metrics that are 12x too high or too low | Convert all values to MRR or all values to ARR before calculating |
| Applying discounts inconsistently | Beginning and ending values use different gross or net conventions | Creates false expansion or contraction | Apply one documented discount policy to every period |
| Including taxes or pass-through charges | Billing totals used instead of subscription revenue | Inflates recurring metrics without improving SaaS economics | Exclude taxes and pass-through amounts from MRR |
| Treating refunds or temporary credits as permanent churn | One-time adjustments are not identified | Understates retained revenue and may create false contraction | Classify the adjustment separately and apply the policy consistently |
Use this checklist before deciding how the calculator should fit into your finance stack.
Choosing and Building a SaaS Expansion Revenue Calculator
Once your calculation logic is clean and your error checks are set, the next step is simple: pick the tool that will run the math. The right choice depends on a few practical things - how many customers you have, how often you report, and how much control you want over the process.
A good rule of thumb is to use the simplest option that still gives you auditability, cohort logic, and repeatable monthly close output. If the tool can't do those things, it will become a headache fast.
Spreadsheet Calculators vs. Integrated Finance Tools
A spreadsheet is often a good fit for an early-stage company with a small customer base, a limited set of products, and a simple monthly close. You can keep raw billing data, a customer bridge, cohort tracking, reconciliation checks, and a board-ready dashboard in one workbook.
That said, spreadsheets come with baggage. They depend on manual imports, and they can break in annoying ways. A formula gets overwritten. Two people save two different versions. Ownership gets fuzzy. Audit trails can also be thin.
An integrated finance platform makes more sense when you need bookkeeping, forecasting, close support, approvals, and investor-ready reporting in one controlled workflow. Instead of stitching things together by hand, you get centralized data, repeatable close steps, permissions, and source-system connections. As the process grows, that setup is much easier to maintain than a spreadsheet.
A BI dashboard sits somewhere in the middle. It's a strong fit for teams that need recurring reporting across billing, CRM, product, and customer-success data. But there's a catch: it only works well if your data pipelines are clean, your data model is solid, and someone technical owns it.
Features That Matter Most in a Reliable Calculator
Start with clear revenue classification and cohort tracking. That part matters more than people think. If expansion isn't tied back to the original customer group, the calculator stops being dependable.
You should also expect a few basics:
- Monthly-close support
- Scenario modeling
- Drill-down capability
- Exportable reporting
If your setup can't handle those, it'll be tough to trust the output month after month.
Spreadsheet, BI Tool, and Finance Platform Options: A Comparison Table
Use the table below to match the tool type to your reporting complexity and data volume.
| Option type | Best for | Strengths | Limitations | Typical use case |
|---|---|---|---|---|
| Spreadsheet calculator | Early-stage startups with simple billing and a small customer base | Low cost, quick setup, flexible formulas, easy customization | Manual imports, version control risk, fragile formulas, weak auditability | Monthly expansion and NRR review for a single product with a few dozen customers |
| BI dashboard | Teams combining billing, CRM, product, and customer-success data | Strong visualization, cohort slicing, recurring dashboards, self-service analysis | Requires clean integrations, data modeling, technical maintenance, and metric governance | Segmenting expansion by cohort, plan, industry, or usage behavior |
| Integrated finance platform | Startups needing controlled close, forecasting, accounting, and investor reporting | Centralized workflow, stronger controls, repeatability, and broader financial context | Higher cost, setup effort, configuration needs, and vendor dependency | Monthly close, forecast updates, board reporting, and recurring-revenue analysis in one operating workflow |
Lucid Financials fits teams that want expansion metrics inside a broader accounting and reporting workflow.
Conclusion: Build a Reliable Expansion Revenue Process
Start by defining expansion clearly, locking the starting cohort, and tracking expansion, contraction, and churn as separate lines. Then stick to those rules every month. When you do, shifts in reliable expansion MRR, expansion rate, and NRR show what customers are actually doing, not what changed in your math. That consistency makes the numbers solid enough to use for planning.
At the planning level, expansion rate and NRR answer different questions, so it makes sense to calculate both. A 12% expansion rate can look strong on its own. But if churn and contraction wipe out that gain, NRR ends up at 100%, which means the cohort didn’t grow at all. ChartMogul’s benchmark research shows top-quartile NRR above 105% and best-in-class B2B SaaS NRR in the 110%–125% range. Those numbers are useful reference points, not fixed goals. Results change based on segment, contract size, and business model.
The good news? The biggest mistakes are easy to avoid:
- Keep new MRR out of expansion
- Leave one-time revenue out of MRR
- Never combine monthly and annual figures
Any one of those errors can overstate retention. If you want numbers you can trust, keep a customer-level audit trail and reconcile monthly against your billing system or general ledger.
For teams that want that workflow in one place: if you need expansion metrics tied to bookkeeping, tax services, tax credits, and CFO support, Lucid Financials keeps the process in one platform.
FAQs
What counts as expansion MRR?
Expansion MRR is the extra recurring revenue you earn from customers who already buy from you.
That can come from:
- upsells
- cross-sells
- higher product or service usage
Growing Expansion MRR can improve Net Revenue Retention (NRR) and help you scale without depending only on new customer acquisition.
How is expansion rate different from NRR?
Expansion revenue is the extra income you earn from current customers through upsells, cross-sells, or more product usage.
NRR is a broader metric. It shows how much recurring revenue you keep from current customers over time, including expansion, downgrades, and churn.
Put simply, expansion revenue tracks added growth. NRR shows whether that growth is enough to offset what you lose.
How do I handle annual contracts in the calculator?
Use a consistent monthly format for all subscriptions.
If a plan is billed annually, don’t record the full payment all at once. Instead, spread the total contract value across the full service period. That keeps revenue figures from looking inflated and helps you avoid distorted break-even timelines.
For ARR, use:
yearly subscription revenue + expansion - churn