If I had to boil this down to one idea, it’s this: I should put cash and headcount where the numbers say growth will pay back fastest - and stop spending where the numbers show leaks.
For most startups, the main check starts with burn rate and cash runway. If runway drops below 12 months, I need to protect cash and start fundraising. After that, I look at CAC, LTV:CAC, CAC payback, and burn multiple to see if growth spend makes sense. Then I use MRR, ARR, NDR, gross margin, Rule of 40, and revenue per employee to check whether revenue is holding up, margins are strong enough, and hiring is pulling its weight.
Here’s the short version:
- Burn rate tells me how fast cash is going out
- Cash runway tells me how many months I have left
- CAC tells me what it costs to win a customer
- LTV:CAC tells me if that spend pays off
- CAC payback tells me how long it takes to get cash back
- Burn multiple tells me how much cash I burn to add new ARR
- MRR shows monthly subscription growth
- ARR shows the annual recurring revenue base
- NDR shows whether current customers grow, stay flat, or churn
- Gross margin shows how much revenue I keep after delivery costs
- Rule of 40 checks growth plus profit together
- Revenue per employee shows whether headcount is paying off
A few numbers matter right away: 18–24 months of runway is a common target, under 12 months CAC payback is strong for many SaaS companies, 70%–80% gross margin is a common SaaS range, and NDR above 120% often points to a strong expansion motion. When these numbers line up, budget calls get simpler. When they clash, I pause and fix the weak spot first.
This article is best read as a decision guide, not a KPI list. I’m not just tracking metrics. I’m using them to decide where the next $1, the next hire, and the next quarter of effort should go.
12 SaaS Metrics for Strategic Resource Allocation: Benchmarks & Signals
Your SaaS Metrics Playbook for 2025 | SaaS Metrics School | SaaS Playbook
sbb-itb-17e8ec9
Quick Comparison
| Metric | What it answers | Common healthy signal |
|---|---|---|
| Burn Rate | How fast am I spending cash? | Stable on a 3-month view |
| Cash Runway | How much time do I have left? | 18–24 months |
| CAC | What does one new customer cost? | In line with payback and LTV |
| LTV:CAC | Is acquisition spend worth it? | 3:1+ |
| CAC Payback | When do I get CAC back? | Under 12 months for many SaaS cases |
| Burn Multiple | How much cash do I burn for new ARR? | Under 1.5x |
| MRR | Is monthly recurring revenue growing? | Steady month-over-month growth |
| ARR | How big is the recurring base? | Consistent upward trend |
| NDR | Are current customers expanding or churning? | Above 110% |
| Gross Margin | How much revenue do I keep after delivery costs? | 70%–80% for SaaS |
| Rule of 40 | Are growth and profit balanced? | 40%+ |
| Revenue Per Employee | Is headcount efficient? | Stable or rising over time |
If I use these metrics together - instead of in isolation - I get a much clearer view of where to cut, where to invest, and when to slow down.
Why Startups Need Metrics, Not Gut Feel, for Allocation Decisions
Misallocated capital eats into runway and drags down growth. If you hire too fast before checking unit economics, you're spending cash on a go-to-market motion that hasn't clicked yet. If you dump money into paid acquisition before fixing retention, you're paying for growth that churn wipes out. That's why the metrics in this article help in four separate ways.
Raising a round usually takes 4 to 6 months, so runway below 12 months should be a prompt to start fundraising right away. It also shapes how aggressively you can hire or invest while that process is in motion.
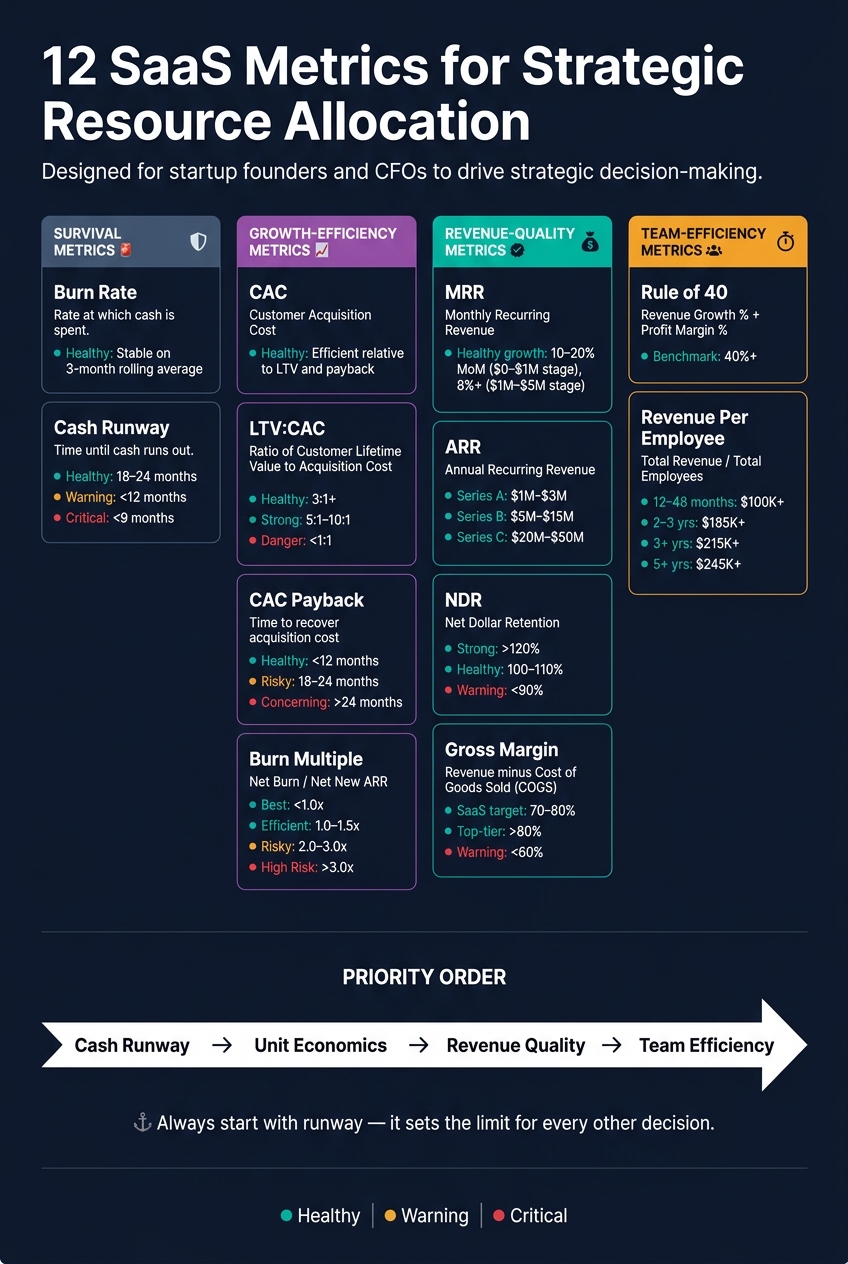
The 12 metrics in this article fall into four groups, and each group answers a different allocation question:
- Survival metrics: burn rate and cash runway
- Growth-efficiency metrics: CAC, LTV:CAC, CAC payback, and burn multiple
- Revenue-quality metrics: MRR, ARR, NDR, and gross margin
- Team-efficiency metrics: Rule of 40 and revenue per employee
The key is to treat these metrics like a system, not a set of isolated numbers. Strong MRR doesn't say much if burn keeps climbing. Low CAC doesn't help much if churn is heading the wrong way. You have to read the numbers together.
When signals across these groups line up, allocation decisions get a lot clearer. When they clash, that's usually a sign to pause and sort out the issue before shifting budget or adding headcount. Start with burn rate and cash runway. They set the limits for every other move.
1. Burn Rate
Burn rate is your monthly cash outflow before revenue. Gross burn is your total monthly spend before revenue. Net burn is the cash you lose each month after revenue.
Use accrual-based accounting instead of relying on cash-flow tracking alone. It gives you a clearer picture of what your spending is doing to the business.
A $200,000 senior hire can cut runway by about 1.5 months at a $240,000 net burn. That’s why big headcount calls hit harder than they seem at first glance. Money spent on one hire is money you can’t put into product, marketing, or operations.
It also helps to audit unused recurring spend. That can lower net burn without cutting anything that drives growth. Burn rate shows how fast cash is going out. Cash runway shows how much time that leaves you.
Next, convert burn rate into cash runway.
2. Cash Runway
Cash runway is simple on paper:
Runway = cash balance ÷ 3-month average monthly net burn
That 3-month rolling average matters because it smooths out one-off swings and gives you a cleaner read on what the business is actually burning each month.
For growth-stage startups, the usual target is 18 to 24 months of runway. That range gives a team time to make product moves, test go-to-market ideas, and hire with some breathing room. When runway drops below 12 months, the call starts to change. At that point, you’re not just planning for growth anymore. You’re also protecting cash.
| Runway Status | Risk Level | Required Action |
|---|---|---|
| 18–24 months | Healthy | Normal planning; test new bets |
| < 12 months | Warning | Start fundraising |
| < 9 months | Critical | Cut spend and fundraise now |
Investors watch runway closely because fundraising often takes 4 to 6 months to close. So if a founder has 10 months of runway left and hasn’t started that process, they’re already playing catch-up. It’s a bit like noticing your gas tank is low after you’ve passed the last exit.
If runway is getting shorter while revenue stays flat, tighten spending before you scale. That usually means protecting cash first, then deciding where extra spend still makes sense. Once runway is in decent shape, the next issue is whether essential financial metrics show growth is efficient enough to support more investment.
3. Customer Acquisition Cost (CAC)
CAC measures the full cost of getting one new customer: total sales and marketing spend divided by the number of new customers acquired.
That sounds simple. But the details matter a lot.
If you want CAC to mean anything, you need to count the whole picture. That includes paid media, sales compensation, bonuses, CRM, marketing automation, content, and agency fees. If you leave those out, CAC can look better than it is. And that leads to bad calls on budget and growth.
Used the right way, CAC helps you see which acquisition channels deserve more money and which ones are just burning cash.
A big mistake is relying only on a blended CAC. On paper, one average number looks neat. In practice, it can hide a mess. One channel may be efficient while another is wasteful, and a blended figure can mask both. That’s why it helps to break CAC out by channel or by segment instead of stopping at the top-line number.
So CAC isn’t just a reporting metric. It’s a decision metric. It shows where to cut spend and where to scale.
Investors also watch CAC closely. They use it to judge whether go-to-market spend is efficient and whether the model can scale. If CAC keeps rising while revenue growth doesn’t keep up, that can point to inefficient growth and a shrinking cash runway.
Lower CAC is usually better. But there’s a catch: an unusually low CAC can also hint that a company isn’t spending enough to grow. In other words, cheap acquisition isn’t always a win if it means you’re holding back. And when CAC starts climbing, runway can get tight fast, which is why payback timing matters next.
For accurate CAC, include these cost categories:
| Expense Category | Items to Include |
|---|---|
| Paid Media | Google Ads, LinkedIn Ads, Meta Ads |
| Compensation | Sales salaries, commissions, and bonuses |
| Software | CRM, marketing automation, sales enablement |
| Content and creative | Content marketing, PR, events, production |
Once CAC is clear, the next question is how fast it pays back.
4. LTV:CAC Ratio
CAC tells you what it costs to win a customer. LTV:CAC tells you whether that money was worth spending.
It compares a customer’s lifetime gross profit with the cost to acquire them, which makes it one of the clearest ways to judge efficient growth. In plain English: are you putting in $1 and getting enough back over time? That’s the heart of this metric.
Use it to decide whether to scale acquisition, tighten retention, or ease off spend.
Below 1:1, you’re losing money on every customer. These ranges help frame what the ratio means:
| LTV:CAC Ratio | What It Signals | What to Do |
|---|---|---|
| < 1:1 | Losing money on every customer | Stop scaling; fix the business model immediately |
| 1:1 – 3:1 | Risky / inefficient | Improve retention or reduce CAC before scaling |
| 3:1 – 5:1 | Healthy range | Scale selectively while maintaining efficiency |
| 5:1 – 10:1 | Strong efficiency | Increase acquisition spend to capture more market share |
| > 10:1 | Likely underspending on growth | Reinvest aggressively in sales and marketing |
Benchmark ranges based on.
A low ratio usually points to high CAC, low LTV, or both. That’s your cue to fix unit economics before you push for growth. In most cases, that means improving retention, cutting waste in acquisition channels, or doing both at the same time.
At the other end, a ratio above 10:1 can mean you’re being too cautious. If customers pay back far more than they cost, holding back on growth spend may leave demand on the table.
One SaaS company shows how much this can shift. It moved its LTV:CAC from 1.25x to 4.1x by cutting paid LinkedIn spend and shifting to SEO, which stabilized burn.
Investors watch this ratio closely because it ties straight to valuation. As Jamie Sullivan and Alex Immerman of Andreessen Horowitz put it:
"Higher LTV:CAC → higher margins → higher valuation." - Jamie Sullivan and Alex Immerman, Partners, Andreessen Horowitz
It also helps to break LTV:CAC out by channel and segment. Why? Retention and margin often change a lot by cohort. A customer from paid search may look very different from one from referrals or SEO. Read this metric alongside CAC payback period so you can see both the total return and how long it takes to get your cash back.
Next, CAC payback period shows how fast that return comes back in cash.
5. CAC Payback Period
CAC payback period shows how long it takes for a customer’s gross profit to earn back what you spent to acquire them. That timeline shapes how fast cash comes back into the business. Put simply: when do you get your money back?
In 2025, the median B2B SaaS company earned back CAC in 16 months, down from 18 months in 2024. Top-quartile companies did it in 6 months or less, while bottom-quartile companies needed 24 months or more. That gap matters a lot. A 6-month payback lets you put capital back to work much sooner than a 24-month payback.
The benchmark you should use depends on deal size. SMB-focused startups with ACV under $15,000 should aim for under 12 months. Enterprise-focused startups with ACV over $100,000 can live with 18–24 months, since retention and expansion tend to be stronger. So don’t compare yourself to the whole market. Compare against your ACV band.
| Payback Period | Efficiency Signal | What to Do |
|---|---|---|
| < 12 months | Excellent | Safe to accelerate sales and marketing spend |
| 12 – 18 months | Healthy | Maintain discipline; standard for growth-stage SaaS |
| 18 – 24 months | Risky | Requires high retention (NRR >115%) to justify |
| > 24 months | Concerning | Fix unit economics before scaling further |
Payback works best when you read it alongside CAC and LTV:CAC. One metric alone won’t tell the whole story, but together they show whether customer acquisition can scale without getting you into trouble.
A common mistake is using only marketing spend in the calculation. That usually paints too rosy a picture. Fully loaded CAC is often 40% to 80% higher than marketing-only CAC because it also includes sales, tools, and RevOps overhead. If the input is too low, your efficiency will look better than it is.
Payback is also easier to check than LTV:CAC because it relies on cash you’ve actually recovered, not long-range churn assumptions. And when payback gets shorter, cash frees up faster. That sets up the next test: burn efficiency.
6. Burn Multiple
Once you’re past CAC payback, burn multiple gives you a broader view of growth efficiency. It shows how much cash a company burns to add each new dollar of ARR. The formula is Net Burn ÷ Net New ARR, and it looks at the whole business - R&D, G&A, and operations sit in the numerator too, not just sales and marketing.
Benchmarks change by stage. Seed-stage startups under $2M ARR often land between 2.0x and 5.0x because they haven’t hit much scale yet. By Series A, the median falls to about 1.6x. What matters just as much as the raw number is the direction. If the multiple keeps coming down, that usually points to better operating leverage.
| Burn Multiple | Efficiency Grade |
|---|---|
| Under 1.0x | Best-in-class |
| 1.0x – 1.5x | Efficient |
| 1.5x – 2.0x | Healthy |
| 2.0x – 3.0x | Concerning |
| Over 3.0x | High risk |
Sources:
Investors often treat burn multiple as a rough signal of product-market fit. A company that burns $5M to create $1M in ARR probably hasn’t reached true PMF yet. That’s one reason the metric now gets so much attention. In 2025, 83% of Series C+ investors marked it as a critical metric. These days, efficient growth with a low multiple often beats fast growth with a high one.
A high burn multiple can also tell you where not to push harder. If retention is weak, pouring more money into marketing usually makes the problem worse. Fix retention first. Strong net revenue retention cuts the need for pricey new customer acquisition and brings the multiple down over time.
There’s also a big cost gap between expansion revenue and new-logo revenue. Expansion revenue is much cheaper to generate. New-logo burn multiples usually come in 2x–4x higher than the headline figure, while expansion burn multiples are often just 0.2x–0.5x.
If burn multiple is high, the next step is simple: check whether recurring revenue is growing fast enough to support that level of spend.
7. Monthly Recurring Revenue (MRR)
After burn multiple, MRR shows whether your spend is turning into recurring revenue. It tracks subscription revenue at month-end and leaves out one-time fees, setup fees, usage overages, and services. That makes it a clean way to judge momentum. You can use MRR growth to decide when to add sales capacity, put more budget into retention, or ease back on acquisition.
For early-stage startups, the growth rate matters more than the raw number. At the $0–$1M ARR stage, 10–20% month-over-month growth is seen as best-in-class, while 8%+ is generally healthy. At the $1M–$5M ARR stage, MRR growth becomes a signal for whether your current go-to-market motion can scale. In plain terms, this metric helps founders decide when to hire, when to pause acquisition, and when to shift budget toward retention.
To see what's driving the change, split MRR into a few parts:
- New MRR supports acquisition spend
- Expansion MRR points to product and customer success gains
- Contraction MRR shows revenue shrinkage inside the base
- Churned MRR shows where revenue is leaking
Use MRR to track month-to-month movement. Use ARR to measure the total recurring base.
MRR can also act as a direct spending trigger. If MRR growth stays below 8% for two straight months, run a go-to-market review before you keep spend on plan. If MRR momentum is strong and pipeline coverage looks healthy, adding sales headcount may make sense. If pipeline coverage for new MRR drops below 3x, it may be time to add sales capacity. One thing matters here: pull MRR from your billing system, not the P&L, so one-time revenue doesn't skew the number. ARR then extends that monthly view into an annual one.
| Stage | Healthy MoM Growth Rate |
|---|---|
| $0–$1M | 10–20% (best-in-class) |
| $1M–$5M | 8%+ |
| $5M+ | Varies by segment |
Source:
8. Annual Recurring Revenue (ARR)
If MRR shows what’s happening month to month, ARR shows the annual size of your recurring revenue base.
ARR is simply MRR annualized across 12 months. That sounds straightforward, but there’s a catch: only recurring revenue belongs in ARR. One-time fees, implementation charges, and professional services should stay out of the calculation. Mix those in, and the number gets inflated - which is a red flag for investors.
Put another way, if MRR shows momentum, ARR shows the recurring base behind that momentum.
Investors look at ARR to gauge both scale and growth quality. Lower ARR can limit aggressive hiring and expansion. Higher ARR gives a company more room to do both. As Northstar Financial Advisory puts it:
"ARR below $1M at Series A signals the company is still searching for fit. ARR above $5M with strong growth tells investors the model is working and scalable."
| Round | Typical ARR Range | What It Signals |
|---|---|---|
| Series A | $1M–$3M | Early validation |
| Series B | $5M–$15M | Ready to scale faster |
| Series C | $20M–$50M | Established market leader |
ARR also plays a big role in annual planning. Because it gives you a 12-month view of recurring revenue, it’s a stronger baseline for budgeting R&D, headcount, and market expansion than trailing P&L revenue.
One more thing: calculate ARR from billing data, not from the P&L. That keeps the metric clean and avoids pulling in revenue that doesn’t belong there.
ARR tells you how large the recurring engine is. Next, NDR shows whether that revenue base is compounding.
9. Net Dollar Retention (NDR)
ARR tells you how big your recurring revenue base is. NDR tells you what that base is doing over time: growing, staying flat, or slipping.
Net Dollar Retention (NDR), also called Net Revenue Retention (NRR), measures the share of recurring revenue you keep from existing customers over a set period, while factoring in upgrades, downgrades, and churn. The formula is:
NDR = [(Beginning Revenue + Expansion Revenue – Contraction Revenue – Churned Revenue) / Beginning Revenue] x 100
An NDR of 120% means your current customer base can grow revenue by 20% per year on its own, even if you stopped all new sales tomorrow.
That’s a big deal. Investors often look at NDR early because it gives a quick read on product stickiness. It also helps with budget decisions. If NDR is above 120%, put more into Customer Success and Account Management. If it falls below 90%, work on churn before spending more on acquisition.
| NDR Level | What It Means | Where to Invest |
|---|---|---|
| >120% | Compounding | Invest hard in Customer Success and Account Management to drive expansion |
| 100%–110% | Healthy | Keep spend steady and look for natural expansion paths in pricing |
| <90% | Churn-heavy | Focus on product-market fit and churn reduction before adding acquisition spend |
One practical note: NDR is a lagging indicator. If it drops, the churn has already happened. That’s why it helps to pair NDR with leading signals like product usage and health scores, so you can move before the number changes.
Gross margin shows how much of that recurring revenue you keep after delivery costs.
10. Gross Margin
Gross margin shows how much revenue you keep after paying the direct costs of delivering your product. The formula is simple:
Gross Margin % = (Revenue – Cost of Revenue) / Revenue × 100
For SaaS, cost of revenue usually includes cloud hosting, payment processing, third-party API fees, and customer support tied to product delivery. Other costs - like engineering salaries, marketing spend, and executive pay - sit under operating expenses. That split matters more than it may seem at first glance. If costs are placed in the wrong bucket, your margin can look better on paper than it is in practice. And that can lead to bad calls on hiring, customer acquisition, and support spend.
Gross margin also sets the upper limit on operating leverage. For pure-software SaaS, a healthy range is usually 70% to 80%. Anything above 80% is top-tier performance. If a software-first company is sitting below 60%, that's not just a stage-of-growth issue. It's a structural warning sign.
One place founders often slip: using revenue instead of gross profit in LTV. That mistake can make payback and CAC efficiency look far better than they are. In some cases, using gross revenue can inflate LTV by 2x to 3x, which then throws off your CAC payback period and hurts your credibility in investor due diligence.
Low gross margin also increases burn and puts pressure on burn multiple. That's why there's a simple rule here: don't scale your go-to-market team hard until gross margin is above 65%. If margins are weak, adding sales and marketing spend just makes the core issue bigger.
| Business Type | Healthy Gross Margin | Warning Threshold |
|---|---|---|
| Pure SaaS / Software | 70%–80% | <60% |
| SaaS + Services | 60%–70% | <55% |
If margins start to tighten, look first at:
- Infrastructure that may be overprovisioned
- Support headcount
- API costs that didn't drop as the business scaled
Once gross margin is stable, check whether existing customers are expanding the revenue base.
11. Rule of 40
After gross margin, the Rule of 40 is a simple way to check whether growth and profitability are staying in balance. The idea is straightforward: revenue growth plus EBITDA margin or free cash flow margin should total at least 40%. That gives teams a quick read on whether they should keep pushing growth or protect margin.
Rule of 40 = Revenue Growth Rate (%) + Profit Margin (%)
Put plainly, it shows whether a startup can give up some margin to grow faster, or accept slower growth to keep margin in line, without drifting too far off course.
At the board level, this metric is most useful for late-stage SaaS companies, especially public ones. It works well as a capital-allocation check. In practice, leadership can use it to decide whether to put more money into growth or pull spending in a bit, instead of using it as a stand-alone performance score. Earlier-stage startups usually look at it alongside burn multiple.
| Rule of 40 Score | What It Signals |
|---|---|
| 40%+ | Meets the benchmark for growth and profitability |
| Below 40% | Does not meet the benchmark |
Next, revenue per employee shows whether that growth is being delivered efficiently by the team.
12. Revenue Per Employee
The last check is simple: is revenue growing faster than headcount? That’s what Revenue Per Employee (RPE) helps you see.
RPE is annual revenue divided by headcount. It shows how well your team turns payroll into revenue. Put plainly, it’s a direct read on labor efficiency.
Revenue Per Employee = Total Annual Revenue ÷ Current Number of Employees
If headcount climbs faster than revenue, efficiency starts to slip. That makes RPE useful for hiring decisions. Every new role becomes a plain business call: will this hire help revenue grow faster than cost grows?
RPE works best when you track it next to CAC payback. If RPE is going up while CAC payback stays steady or gets better, hiring is probably on the right track.
Use RPE to avoid overhiring, but also to spot teams that are too thin. Add headcount only when recurring revenue can cover the fully loaded cost, plus a buffer.
Investors watch RPE too. They use it to judge team leverage, meaning the ability to grow revenue without adding headcount at the same rate. Company stage matters here. Older SaaS companies are expected to generate more revenue per employee than younger ones.
SaaS RPE benchmarks by company age:
| Timeline | Target RPE |
|---|---|
| 12–48 months | $100,000+ |
| 2–3 years | $185,000+ |
| 3+ years | $215,000+ |
| 5+ years | $245,000+ |
Source:
One practical move: automate repetitive work before you hire. That helps protect RPE as the company grows.
RPE rounds out the team-efficiency view. Next, look at all 12 metrics together before making allocation calls.
How to Read These Metrics Together
These metrics matter most when you read them as a system, not one by one. The value comes from the mix. On its own, any single metric can point you in the wrong direction.
Cash runway comes first. It outranks everything else. Once you know how much time you have, use the other metrics to spot the constraint behind it.
A strong LTV:CAC with weak NDR points to a leaky bucket. You can bring customers in, but you're not keeping enough value after they arrive. In that case, move spend from Sales to Product or Customer Success before adding more top-of-funnel budget.
Rising MRR with a worse burn multiple points to growth that costs too much. If burn multiple moves past 2.0x, audit GTM efficiency before adding headcount.
If gross margin drops below 60%, more sales and marketing won't solve the problem. It will just scale a weak margin structure. Fix cost of revenue first, then scale GTM.
Use the table below to connect metric patterns to action:
| Metric Combination | Signal | Recommended Action |
|---|---|---|
| Runway < 12 months | Existential risk | Cut non-revenue spend right away or fundraise |
| Strong LTV:CAC + Weak NDR | Leaky bucket | Shift spend from Sales to Product/Customer Success |
| MRR rising + Burn Multiple > 2.0x | Growth at an inefficient cost | Audit GTM efficiency; reduce non-essential OpEx |
| Gross Margin < 60% | Structural inefficiency | Fix cost of revenue before scaling GTM |
| High LTV:CAC (>5:1) + weak growth | Under-investment | Add GTM spend only if pipeline supports it |
Make these metrics the shared language across finance, sales, product, and operations. Review burn, retention, margin, and pipeline together each month so you can spot trouble early.
"The real issue isn't which CEO financial metrics to track. The issue is how to weight them so you focus on what actually moves your business." - Seth Girsky, Founder, Inflection CFO
Use these combinations as a fast way to interpret the metrics in the reference table below.
Quick Reference: What Each Metric Tells You
After the deep-dive metrics, use this table for a fast allocation check.
| Metric | What It Measures | Healthy Signal | Best Allocation Use |
|---|---|---|---|
| Cash Runway | Cash left | 18–24 months before the next raise | Below 12 months, stop non-essential spend and start fundraising |
| Burn Rate | Monthly cash outflow | Stable on a rolling 3-month average | If it starts climbing, slow hiring and trim discretionary spend before runway gets squeezed |
| Customer Acquisition Cost (CAC) | Acquisition cost | Efficient relative to LTV:CAC and payback period | If CAC jumps, pause paid channels and audit the conversion funnel |
| LTV:CAC Ratio | ROI per customer acquired | 3:1 or higher | Above 5:1, scale acquisition; below 3:1, fix product, onboarding, pricing, or ICP |
| CAC Payback Period | Payback time | Under 12 months | Under 12 months, scale acquisition; over 24 months, conserve cash and shorten payback |
| Burn Multiple | Cash burned per $1 of net new ARR | Under 1.5x is healthy; under 1.0x is excellent | Above 2.0x, audit structural costs and freeze discretionary spend |
| Monthly Recurring Revenue (MRR) | Monthly recurring revenue | Consistent month-over-month growth | If flat or falling, pause acquisition and fix churn |
| Annual Recurring Revenue (ARR) | Annual recurring revenue | Steady upward trajectory | Use as a baseline for headcount planning and investor reporting |
| Net Dollar Retention (NDR / NRR) | Retention from existing customers | Above 110% | Below 90%, shift budget to Product and Customer Success |
| Gross Margin | Profit after direct delivery costs | 70%–80% for SaaS | Below 60%, cut infrastructure and support costs before scaling go-to-market |
| Rule of 40 | Growth rate + profit margin combined | 40% or higher | Below 40%, rebalance growth and margin |
| Revenue Per Employee | Labor efficiency | Rising or stable as headcount grows | If it declines, pause hiring and improve productivity before the next hiring round |
Use this table before any budget call. Then check that the inputs come from clean books and consistent reporting.
Building a Reliable Metrics Stack
Before these metrics can guide budget decisions, the data underneath them has to be trustworthy. Every metric in this article depends on clean numbers. If your books are messy, burn, MRR, and CAC get warped fast. And once that happens, hiring plans, spending calls, and runway estimates start drifting in the wrong direction. Clean, up-to-date financial data is the base layer for every allocation call.
A common problem for startups is pulling metrics from disconnected systems. Most growth-stage companies track data across four to six separate tools, which creates silos. That’s how you end up with MRR on a dashboard that doesn’t match revenue on the income statement. It sounds small, but it can throw off major decisions.
The fix is a single source of truth. That means metrics should come straight from your accounting data, not from CSV exports and manual spreadsheet cleanup. A live dashboard shows stronger operating discipline than a spreadsheet.
To keep that source reliable, maintain a metrics dictionary. This is a shared document that defines each KPI in writing and gets sign-off from Sales, Finance, and the board. It helps stop definition drift. For example, Sales may count a pilot as ARR, while Finance only counts recognized recurring revenue. Same company, same metric name, two different meanings. That’s where trouble starts.
Once the data source is unified, set clear ownership and update timing for each metric.
Lucid Financials can centralize bookkeeping, tax, and CFO reporting so metrics stay current.
A simple review rhythm works well:
- Check cash and runway weekly
- Review revenue quality monthly
- Review unit economics quarterly
That cadence turns the metrics in this article into a live decision system.
Conclusion
Put together, these metrics make resource allocation less of a gut call and more of a repeatable process.
Resource allocation comes down to one thing: choosing the highest-return use of limited cash, time, and headcount. Each metric plays a different role in that system. Burn and runway define your limits. Unit economics show whether growth pays off. Revenue quality tells you if that growth can last. And revenue per employee keeps hiring in check.
There’s a hard truth here: broken unit economics are much harder to repair once the team gets bigger. That’s why the goal isn’t just to track numbers. It’s to build a dashboard that flags problems early, while there’s still time to act. Leading indicators like pipeline coverage and forecast accuracy can help you see revenue shortfalls before they show up in the financials.
Of course, none of this helps if the data is stale or off. Lucid Financials keeps your books clean and reporting current, so your allocation decisions rest on accurate data.
FAQs
Which metric should I check first?
Check cash runway first. It tells you how long your company can keep operating before it runs out of cash, which makes it the most time-sensitive metric.
If you run out of money, everything else comes second. Since runway affects every other business decision, you should review it every week.
How do I know if I should cut spend or invest more?
Balance survival metrics with growth efficiency. If runway falls below 12 months, or burn stays high without enough revenue growth, cut non-essential operating costs.
Spend more when unit economics look good. A solid benchmark is an LTV:CAC ratio of 3:1 or better and a burn multiple under 1.5.
It also helps to split expenses into two buckets:
- Strategic costs tied to growth
- Operational costs tied to day-to-day work
Use Lucid Financials to track these metrics in real time so you can see when to pull back and when to lean in.
What if some of my metrics look strong but others look weak?
Treat mixed metrics as a diagnosis, not a contradiction. The first step is to figure out which layer of the metric stack is driving performance.
For example, if growth looks strong but payback is weak, the problem may come down to customer quality, gross margins, or retention. That kind of split doesn’t mean the data is broken. It usually means one part of the business is pulling ahead while another is lagging behind.
Don’t try to fix everything at once. That’s how teams get buried in dashboards and still miss the main issue.
Instead, focus on the 5 to 7 KPIs that fit your growth stage and your current goals. Use those numbers to spot what needs action now, and what can wait a bit.