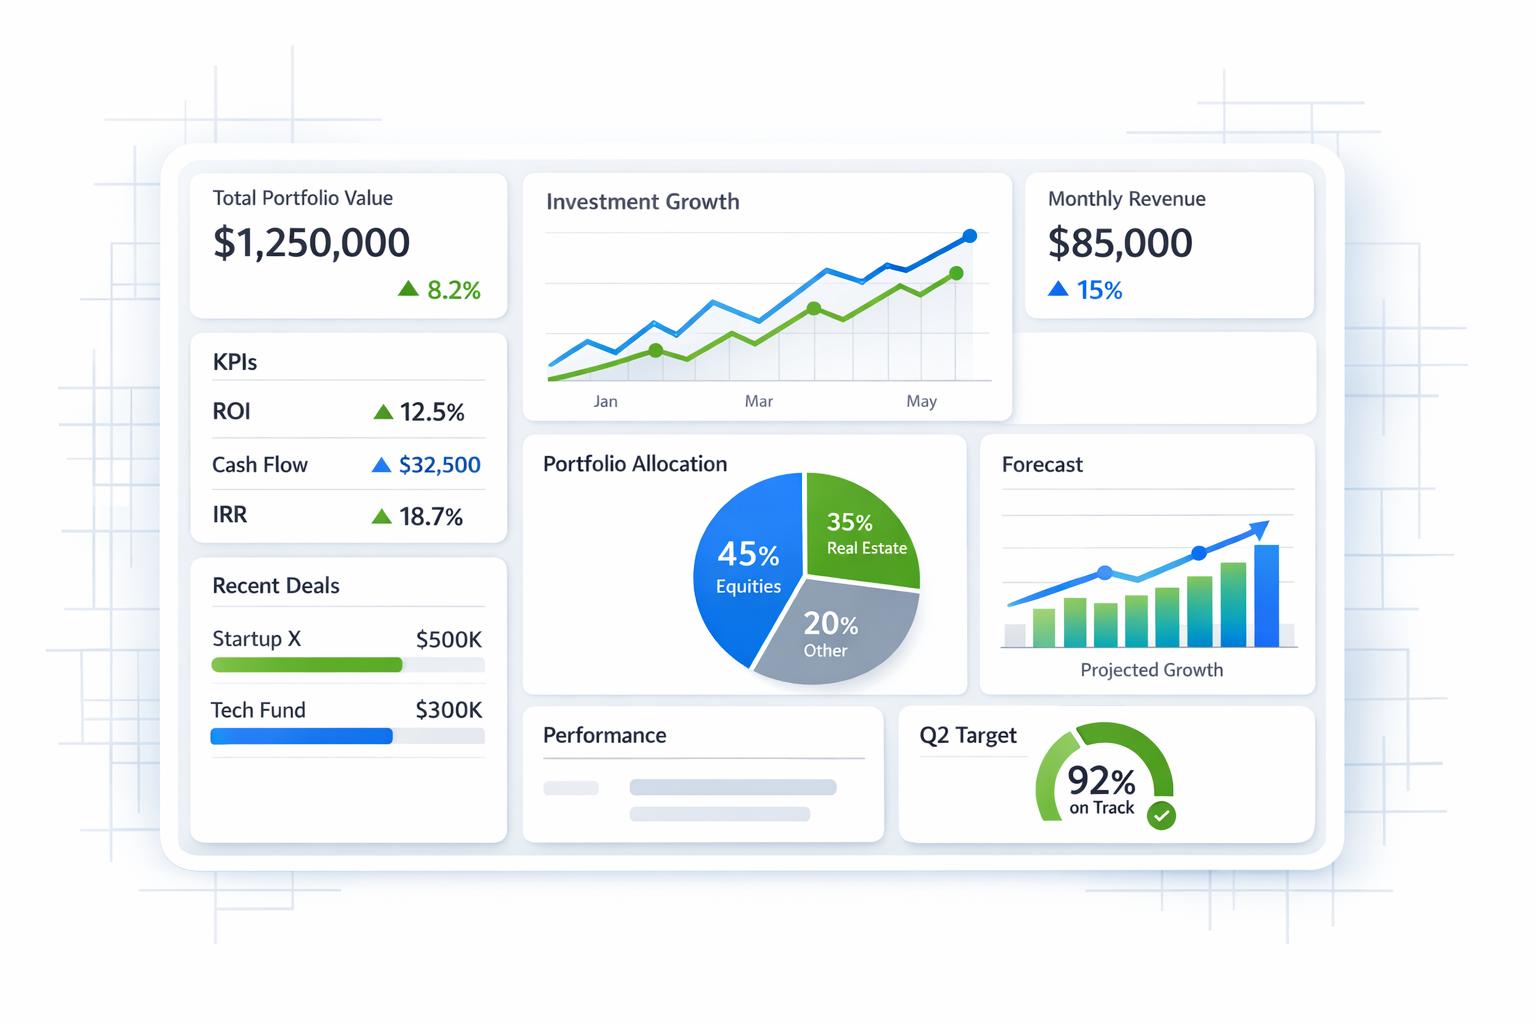
Expanding into the wrong market can drain cash months before revenue shows up. I’d treat expansion as a finance test first: if projected burn, CAC, payback, and runway get worse, the move likely should wait.
Here’s the short version:
- I’d use AI to rank markets based on demand, competition, pricing, and local friction.
- I’d use geospatial tools to check which areas inside a market look best, down to neighborhoods and drive times.
- I’d use forecasting models to test revenue ramp, cash burn, and break-even timing under different scenarios.
- I’d turn all of that into a simple go / pause / no-go scorecard.
- And I’d still require human review, because bad inputs can lead to bad calls.
A few numbers matter most before I expand:
- Cash on hand
- Monthly burn
- Customer acquisition cost
- Lifetime value
- Payback period
- Post-launch runway
The article’s main point is simple: AI helps me put scattered market and finance data into one view, so I can compare markets with more discipline instead of relying on gut feel. But AI does not make the decision for me. I still need clean numbers, current assumptions, and a local sense check before I commit $1.
This is the lens I’d use to decide whether a new market is worth the risk.
The Main Reasons Expansion Decisions Go Wrong
Fragmented Market Data Leads to Guesswork
Founders often do have market data. The problem is that it’s scattered across different tools, spreadsheets, and formats. Once that happens, clean market-to-market comparison gets messy fast.
So teams fall back on weak stand-ins like site visits or signups. Those numbers can look good on the surface, but they don’t show the full picture. They miss things like demand depth, local competition, purchasing power, and regulatory friction. And when there’s no shared view across the company, a market that looks promising in a dashboard can fall apart once actual money starts going out the door.
Financial Readiness Is Often Overestimated
Small finance teams often build expansion models on simplified assumptions. Revenue grows in a straight line. Hiring costs stay the same from market to market. Tax rates look fixed and predictable.
That kind of model usually breaks once a company enters a new market.
Expansion costs tend to be a lot messier than they first appear. They can include:
- local marketing
- localization
- state payroll taxes
- tax compliance
- extra headcount to support another time zone
That gap between the model and reality can pull the cash-out date forward by several months, often before any meaningful revenue shows up. If unit economics are already weak in the home market, expansion doesn’t fix that. It makes it worse.
Even when the spreadsheet looks complete, it still may not answer the one thing leadership needs to know: which market is worth the risk?
Having Data Does Not Always Lead to a Clear Decision
The core issue isn’t the amount of data. It’s that the data often doesn’t answer the go/no-go question.
It tells teams what’s happening. It doesn’t tell them whether City A or City B should be the next move. That’s where decisions get stuck. Growth sees one set of risks. Finance sees another. Product has its own concerns. Everyone is looking at the same numbers, but they’re not reaching the same call.
The company still needs one shared go/no-go test. AI helps turn those scattered signals into a ranked expansion decision.
sbb-itb-17e8ec9
How AI Supports Market Selection, Site Planning, and Forecasting
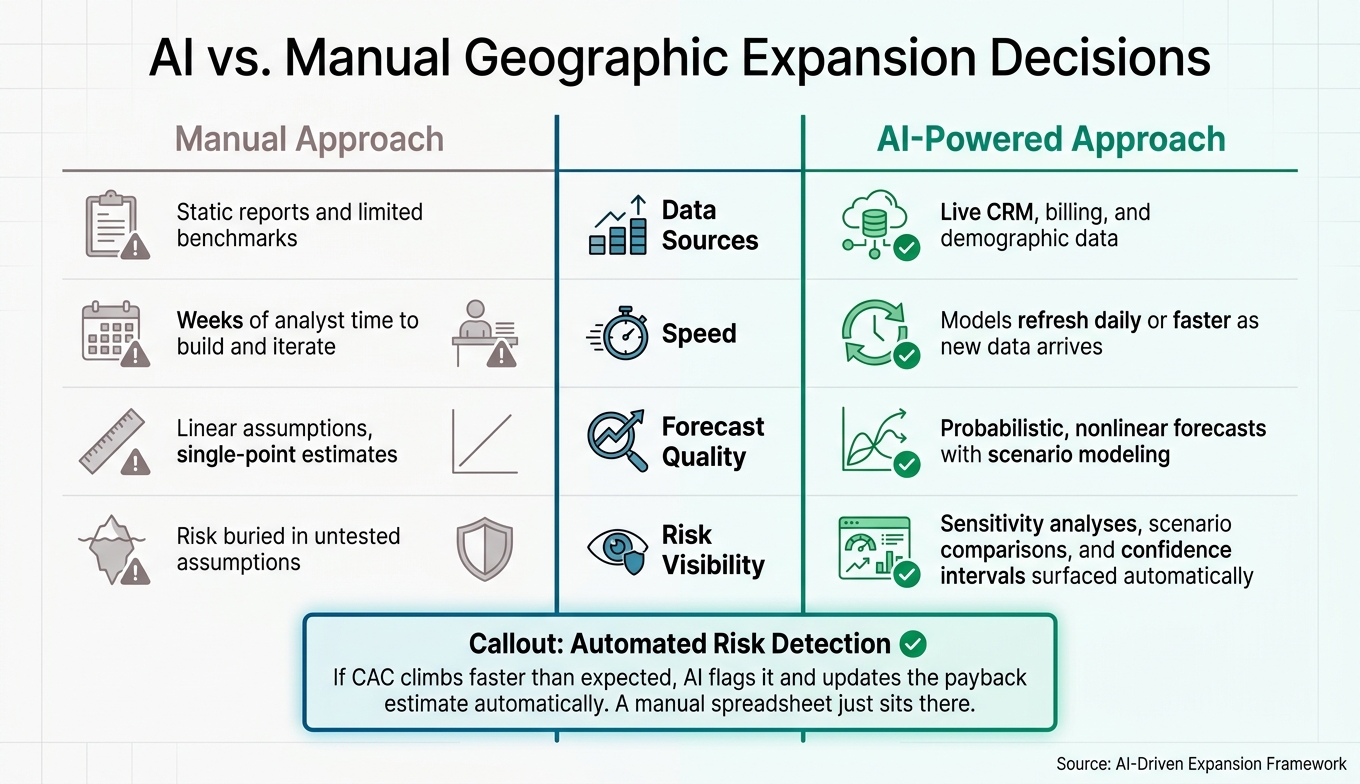
AI vs. Manual Expansion Decisions: Key Metrics Compared
AI Ranks Markets by Demand, Fit, and Risk
AI market scoring models pull scattered data into one ranked view. Instead of bouncing between disconnected spreadsheets, teams can combine ZIP code demand, conversion rates, industry density, and price sensitivity into a single market score. That makes it easier to put capital into markets that are more likely to pay back within 12 to 24 months.
Some market scoring tools assign weights like this:
- Demand: 25%
- Competitive opportunity: 20%
- Regulatory or infrastructure factors: 10% to 15% each
After markets are ranked, the job shifts from which market? to which part of that market?
Geospatial AI Helps Identify Stronger Launch Areas
Once a market makes the shortlist, geospatial AI helps narrow the best launch areas. A strong market can still flop in the wrong spot. Location intelligence tools look at demographics at the census tract level, map competitor density by drive time, and use anonymized mobility and foot-traffic data to show actual trade areas. That gives teams a clearer read on which neighborhoods have demand, easy access, and less competition.
Cannibalization risk can be measured too. If you're weighing two launch sites in the same metro, geospatial models can estimate how much the customer bases overlap and turn that overlap into a dollar impact on new revenue. Many platforms now package that output into a standard site brief.
That site-level read then feeds the revenue and payback forecast.
Predictive Models Estimate Revenue, Burn, and Payback
Predictive models answer the next big question: do the numbers work? AI forecasting tools use past performance from similar markets, then adjust for local demand signals and cost indices to estimate revenue ramp, burn, headcount, and break-even timing. They also account for nonlinear effects and give confidence intervals instead of one rosy forecast. In plain English, that turns expansion from a hunch into a financial test you can pressure-check.
| Dimension | Manual | AI |
|---|---|---|
| Data sources | Static reports and limited benchmarks | Live CRM, billing, and demographic data |
| Speed | Weeks of analyst time to build and iterate | Models refresh daily or faster as new data arrives |
| Forecast quality | Linear assumptions, single-point estimates | Probabilistic, nonlinear forecasts with scenario modeling |
| Risk visibility | Risk buried in untested assumptions | Sensitivity analyses, scenario comparisons, and confidence intervals surfaced automatically |
If CAC starts climbing faster than expected in a new market, an AI-driven model can flag it and update the payback estimate on its own. A manual spreadsheet, by contrast, just sits there until someone rebuilds it.
Together, these outputs make market selection look less like instinct and more like a financial call.
Using AI to Check Financial Readiness Before You Expand
After AI ranks the best markets, the next step is simple: can the company pay for the move without putting too much pressure on runway?
Model Expansion Scenarios Before Committing Capital
It helps to run a few paths in the same model before spending money. For example, you can test entering Market A now, waiting six months to keep more cash on hand, or going after Market B first because entry costs are lower.
That side-by-side view makes the tradeoffs easier to spot. One option may bring in more revenue, but also burn more cash. Another may look slower at first, yet give the company more breathing room.
The table below shows how three common expansion paths might compare across the metrics that matter most for a go/no-go decision:
| Scenario | Projected Revenue | Burn | Runway | Payback Period | Key Risks |
|---|---|---|---|---|---|
| Enter Market A now | Higher | Higher | More pressure | Longer | Higher early burn; local hiring required |
| Delay Market A by six months | Moderate | Moderate | Some preserved | Moderate | Slower revenue capture |
| Prioritize Market B first | Lower | Lower | Less pressure | Shorter | Faster payback; lower initial revenue |
Of course, a scenario model is only useful if the numbers behind it are still up to date.
Use Live Financial Data to Support Go/No-Go Decisions
Static spreadsheets get old fast. AI-backed reporting updates runway, cash flow, and budget variance automatically, so you can see if the company is still operating within safe limits as expansion plans move ahead.
A few numbers deserve close attention:
- Cash on hand
- Monthly burn
- Gross margin
- Accounts receivable aging
- Budget variance
- Forecast vs. actual performance by geography
If a new market starts using cash faster than expected, live reporting can flag it early, before it turns into a funding gap.
Where Lucid Financials Fits In
Once the decision framework is in place, the finance system needs to move at the same pace. Lucid Financials fits this workflow by bringing bookkeeping, tax, tax credits, and CFO support into one platform.
Founders can check runway, burn, and cash in Slack. At the same time, AI forecasts and scenario modeling help keep expansion decisions tied to current numbers.
A Practical AI Framework for Expansion Decisions
Use real-time financial insights to decide if expansion is a go, pause, or no-go.
Build a Simple Go/No-Go Scorecard
Once AI has ranked the market and checked runway, turn those inputs into one clear decision rule. A scorecard helps keep expansion decisions tied to facts instead of gut feel. Score each market across five criteria: market attractiveness, unit economics, operational capacity, compliance complexity, and cash readiness. Each one gets a threshold: green means go, yellow means pause and review, and red means no-go.
| Criterion | How AI Measures It | Go | Pause | No-Go |
|---|---|---|---|---|
| Market attractiveness | Composite score (0–100) blending demand, competition, and pricing power | Score above 75 | Score 55–75 | Score below 55 |
| Unit economics | Projected payback period in months | Under 12 months | 12–18 months | Over 18 months |
| Operational capacity | Expected workload increase and hiring timing | Under 20% workload increase; hiring within 90 days | 20–35% increase; 90–150 days to hire | Over 35% increase or no clear hiring path |
| Compliance complexity | Time to complete licensing, regulatory, and tax setup | Under 90 days | 90–180 days | Over 180 days or high enforcement risk |
| Cash readiness | Post-expansion runway in months | Over 18 months | 12–18 months | Under 12 months |
This makes the choice much easier to read. If a market looks strong on paper but cash readiness or compliance complexity lands in red, that’s a stop sign. One green score alone doesn’t make the case.
Balance AI Speed with Human Judgment
A scorecard can speed things up, but it can’t see everything. AI can process far more data than a team can by hand, and it can do it fast. Still, models trained on narrow market data may misread rural or mid-income regions. Old financials or mislabeled data can also throw off the result. And sometimes the local team knows what the model misses, like hiring friction, buyer habits, or local enforcement patterns.
That’s why every launch decision should still go through local review and finance sign-off. If someone overrides the model, write down why. That creates a paper trail and makes later reviews much easier.
Conclusion: Better Expansion Decisions Start with Better Inputs
AI can make expansion decisions faster and more disciplined, but the output is only as good as the inputs. Clean financials and current assumptions still shape the result. Use the model to rank the options, then use judgment to approve the move.
FAQs
What data do I need first?
Start with clear, measurable goals. Then focus on the 3 to 5 factors that matter most for your startup’s success.
From there, collect clean, standardized, reliable data from your core operations. If the data is messy, your forecast will be too. It’s that simple.
Your starting set should include MRR, ARR, CAC, churn, and expansion revenue. You’ll also want market research on:
- market size
- customer behavior
- competitive positioning
- relevant financial indicators
This gives you a solid base for planning with numbers instead of guesswork.
How do I know if a market is a go or no-go?
Move past gut feel and pressure-test the market with three clear scenarios: base, bull, and bear.
Look at the milestones that matter most:
- customer profitability
- market-level profit and loss
- the point where cumulative cash flow turns positive
Here’s the big warning sign: if your bear case shows you running out of cash before you reach those milestones, that’s a problem. It means the plan may look fine on paper when things go well, but starts to crack when growth slows or costs run higher than expected.
That’s where trigger points help. Set clear rules in advance so you’re not making calls in panic mode. For example, pause or reassess if:
- runway drops below 12 months
- growth falls under 5% over 3 months
Those numbers give you a line in the sand. If you hit them, stop, review the plan, and decide what needs to change before cash gets too tight.
Can AI accurately predict expansion risk?
AI can’t predict the future with perfect accuracy. But it can make startups much better at judging and handling expansion risk.
Instead of spitting out one final forecast, AI models run different scenarios, like bull, bear, and base cases. They also look at real-time data, spot odd patterns, and track the performance signals that matter most.
That gives founders a way to pressure-test their assumptions before making big moves. And when conditions change, they can adjust plans with more confidence.