A single API error can put cash, revenue, and close numbers at risk fast. I’d handle it the same way every time: log the exact error, reproduce it in a test setup, sort it into the right error type, and only then make a fix.
Here’s the short version:
- I start with proof, not guesses: error message, HTTP code, request ID, payload, records hit, and local timestamp.
- I test the issue in a sandbox first so I don’t add bad entries to live books.
- I sort the problem into one of four buckets:
- 401/403: login, token, or permission problems
- 400/422: bad fields, mapping drift, or schema mismatch
- 429/503: throttling, timeout, or slow batch jobs
- Connection/version issues: outage, DNS, firewall, or API changes
- I use idempotency keys when retrying so one retry does not create duplicate journal entries.
- I check report trust with a simple chain: <u>request → provider reference → ledger posting → reporting model → export file</u>.
- I mark numbers as low confidence if data freshness is unknown.
A few facts make this urgent. Even a short sync failure during month-end close or fundraising can push wrong balances into a board deck. And in stacks with 5+ connected systems - like banking, accounting, ERP, payments, middleware, and dashboards - every handoff is another place where data can fail.
If I wanted to cut repeat errors, I’d set alerts around:
- failed syncs
- token expiry
- retry spikes
- queue age
- stale source data
- latency across event, posting, reconciliation, and payment status
The rest of this article shows how I’d trace the root cause, fix it without muddying the books, and keep reports fit for close and investor review.
QuickBooks Online Reports API: A Guide to Building & Automating Financial Reports
sbb-itb-17e8ec9
Follow a Repeatable Workflow Before Changing Anything
Don’t jump straight into settings changes. Start with evidence. That keeps the books safe and makes triage a lot faster.
Collect the Right Data From Logs, Payloads, and Request IDs
Save the exact error message, HTTP status code, request ID, affected records, request payload, and timestamp in local time. Also note when the deploy happened and any config changes made right before the error showed up. Keep the raw API responses, then trace the failure from the original request all the way to the final report.
Reproduce the Error Safely in a Sandbox or Test Environment
Recreate the failure in a sandbox before touching production. Use sample transactions and a small, controlled set of source records so live entries don’t get pulled into the mess.
Check that the source data is current by reviewing the source update time and the last successful reconciliation run. Then compare a few recent failed production items against sandbox ledger postings to spot timing drift. If you retry the request, use the original idempotency key so you can confirm the call returns the same result without creating duplicate ledger entries.
Classify the Error Before Applying a Fix
Put the failure in the right bucket before you try to fix it. That sounds simple, but it saves a lot of wasted motion.
| Error Class | Typical Symptom | First Action |
|---|---|---|
| Authentication / Authorization | 401 or 403 responses | Verify credentials, scopes, and token freshness. |
| Data / Schema | Wrong fields or values | Validate required fields, mappings, and field types. |
| Rate Limits / Timeouts | Slow or dropped requests | Check retry/backoff settings, queue depth, and provider latency. |
| Network / Version Drift | Connection failures | Confirm the API version and recent release notes. |
Match the error class to the fix below.
Fix the Four API Errors That Most Often Break Reporting
Use the matching fix for the error you see.
Authentication and Authorization Errors: 401 and 403
A 401 means the system doesn’t recognize the caller. A 403 means it does, but still won’t allow access. When that happens, cash, revenue, and reconciliation feeds can stall.
The usual causes are expired OAuth tokens, revoked app access, and missing permission scopes. When a 401 or 403 shows up, collect the request ID, payload, affected ledger entry, and source timestamp. If source freshness isn’t clear, don’t automate the call.
Check token freshness and confirm the right scopes are in place. It also helps to set alerts before tokens expire, so you have time to step in before a scheduled close gets hit.
If access looks right and syncs still fail, the next place to look is payload validation.
Data and Schema Errors: 400 and 422
Missing required fields, bad mappings, invalid dates, and field-name or field-type mismatches are common causes here. Chart-of-accounts mapping drift is another big one. When that drifts, account-level reporting can go sideways fast.
If 400 and 422 errors start piling up, pause automated retries right away and inspect the newest failures first. A sudden spike usually points to a schema change or mapping drift, not just one bad record.
Then fix the payload and retry. Use required-field checks to validate the data, and save the failed payload along with the matching journal entry.
Rate Limits, Timeouts, and Slow Jobs: 429, 503, and Latency Spikes
High-volume syncs and large batch jobs often cause these issues. Use idempotency keys, and process retries in event order to avoid duplicate ledger entries or payments.
Track these four latency metrics:
- event latency
- ledger posting latency
- reconciliation latency
- payment-status latency
That gives you a clear view of slowdowns before they turn into stale balances.
If throttling doesn’t seem to be the problem, check provider status and version changes next.
Network Errors and API Version Drift: Connection Failures and Breaking Changes
If the API is reachable but reporting still breaks, start with status, then check version drift. Look at provider outages, DNS, firewall rules, and credentials first.
A deprecation or field change can quietly break downstream reporting. Version drift often changes response shapes, and that can break downstream report fields.
Pin to a supported API version when possible, and review change logs before close.
Error Patterns at a Glance
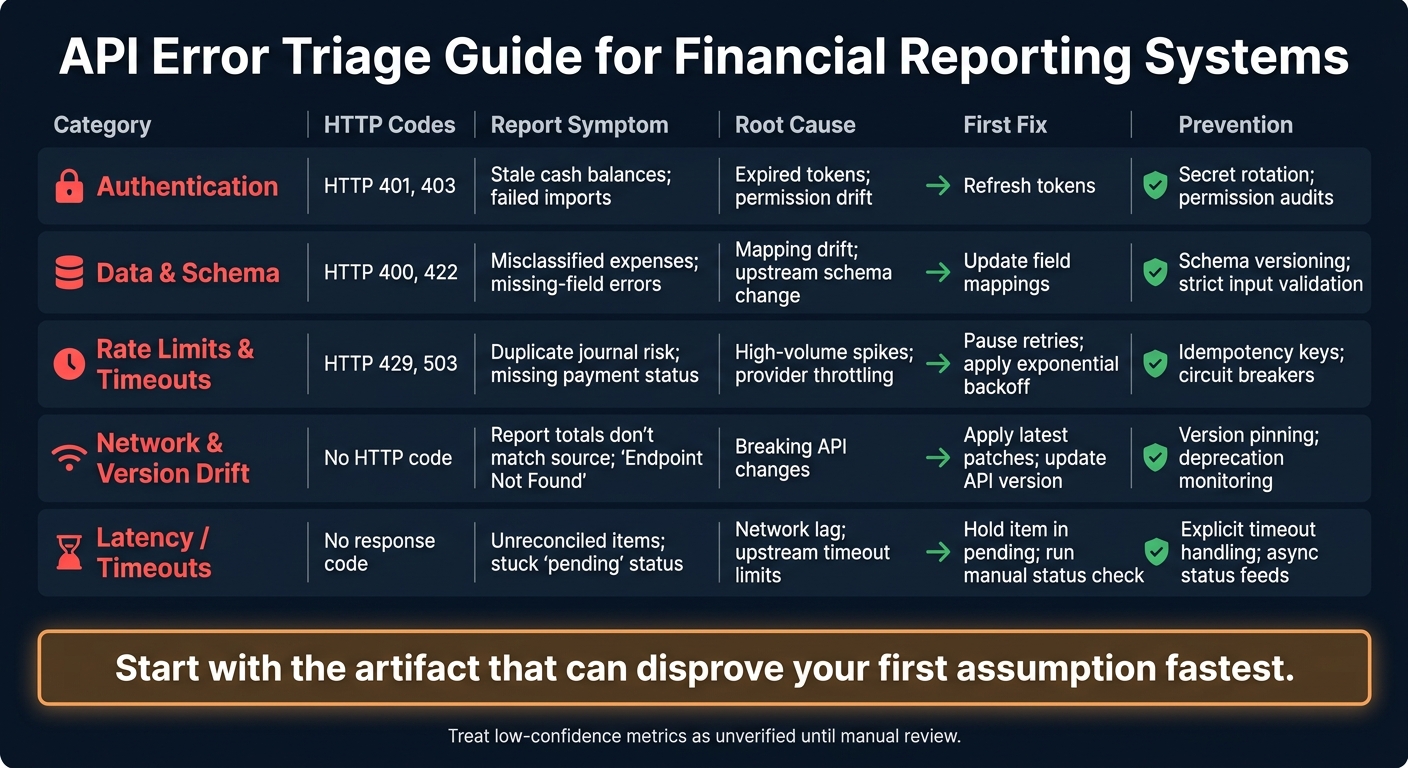
API Error Triage Guide for Financial Reporting Systems
Use this table to connect each symptom to the most likely cause, the first thing to check, and the safest fix. Once you've collected logs and reproduced the issue, this gives you a fast way to sort what went wrong. It also works well as a handoff sheet between teams after the failure is confirmed.
A Triage Table for Finance and Engineering Handoffs
The table below gives finance and engineering the same first move.
| Error Category | Common HTTP Codes | Report Symptom | Likely Root Cause | First Diagnostic Step | First Fix | Prevention Method |
|---|---|---|---|---|---|---|
| Authentication | 401, 403 | Stale cash balances; failed imports | Expired tokens; permission drift | Verify credential expiry and scope in the provider portal | Refresh tokens | Secret rotation; permission audits |
| Data & Schema | 400, 422 | Misclassified expenses; missing-field errors | Mapping drift; upstream schema change | Inspect the payload against the expected schema | Update field mappings | Schema versioning; strict input validation |
| Rate Limits, Timeouts, and Slow Jobs | 429, 503 | Duplicate journal risk; missing payment status | High-volume spikes; provider throttling | Check Retry-After headers; review queue age |
Pause retries; apply exponential backoff | Idempotency keys; circuit breakers |
| Network Errors and Version Drift | N/A | Report totals no longer match source data; "Endpoint Not Found" errors | Breaking API changes | Check provider status page and webhook traces | Apply latest patches; update to a supported API version | Version pinning; deprecation monitoring |
| Latency / Timeouts | No response code | Unreconciled items; stuck "pending" status | Network lag; upstream timeout limits | Check the four latency clocks: event, ledger posting, reconciliation, and payment status | Hold the item in pending; run a manual status check | Explicit timeout handling; async status feeds |
One diagnostic rule works across every category: start with the artifact that can disprove your first assumption fastest.
Treat low-confidence metrics as unverified until manual review. Each number should trace cleanly from request to export artifact.
Once the error is classified, the next step is monitoring and ownership so the same failure doesn't keep coming back.
Prevent Repeat Failures and Keep Reports Investor-Ready
Set Up Monitoring and Alerts Around Close, Cash, and Reporting Deadlines
Once the error is fixed, put monitoring and ownership in place so the same issue doesn't hit again during close.
Fixing a problem one time isn't enough if it can show up again during month-end close or right before an investor deadline. The aim is simple: catch failures before they affect close or investor reporting.
Tie alerts to financial risk, not just system activity. Watch for failed syncs, authentication failures, unusual retry volume, queue age, and stale source ingests. Then connect each alert to a plain business outcome, like cash position reporting or scheduled payout obligations. That makes alerts much easier to act on because the impact is clear.
Use timestamps in the alerts to show exactly where the delay happened.
On every dashboard tile, show freshness indicators: last source event time, last successful ingest, and completeness status for required fields. If freshness is unknown, treat the metric as low confidence and verify it by hand before using it.
Each alert should have:
- a named owner
- a threshold
- a response time
Document Ownership, Escalation Paths, and Recovery Steps
From detection, move straight to ownership.
Every integration needs a named owner and a clear escalation path. Without that, failures drag on while people try to figure out who owns the issue.
A lightweight runbook should spell out how to replay jobs with idempotency keys, how to classify failures for triage, and how to reconcile after a failed sync. Responders should also collect a first evidence set before making any changes: provider reference, payload, ledger posting ID, settlement status, and a source freshness stamp. That step helps avoid one of the most common recovery mistakes: applying a fix before the actual cause is known.
For finance and audit, keep the evidence trail intact.
Screenshots are not an audit trail. Keep journal entries, reconciliation artifacts, and reproducible export files. Each number should trace from request to export artifact: request → provider reference → ledger posting → reporting model → export artifact.
FAQs
How do I know an API error affected my financial reports?
Look for missing or old data, reconciliation gaps, and timestamps that don’t match. Check the API or webhook timestamps, the last successful reconciliation run, and whether the ledger actually posted.
Then trace a dashboard number back to its evidence chain: the provider request or event ID, the reconciliation artifact or journal entry, and the latest export used for review. If anything is missing or the timing is off, treat the report as low confidence.
When should I stop retries and investigate manually?
Stop retries and investigate manually when data freshness or timeliness is unclear, failures are spreading, high-impact metrics or settlement are affected, or repeated retries keep producing the same result without any new evidence.
Also pause retries before any high-impact automated escalation if metric confidence is low. First, verify that the source data is current enough to trust.
What should be in an API error runbook for finance teams?
An API error runbook should spell out the first steps for common failures. That includes connection problems, slow responses, and cases where data shows up wrong in the app or dashboard.
It also needs a simple checklist for verification. Teams should confirm:
- required fields are present
- configuration is correct
- inputs are valid
- upstream data feeds are working as expected
When something goes wrong, the runbook should call for immediate investigation using real-time metrics and audit logs. That way, responders aren’t guessing. They can look at what’s happening right now and trace what changed.
Just as important, the runbook should define clear escalation paths. If the issue points to abuse or compromise, there should be an emergency key-revocation process that people can use without delay.
Alerts matter too. The runbook should account for unusual activity such as:
- traffic spikes
- unfamiliar IP addresses
- off-hours access
- repeated authentication failures