Bad forecasts often come from bad pipeline data, not bad effort. I’d sum it up this way: if I want forecast error to move from roughly 12%–15% toward ±3%–5%, I need clean CRM records, deal scoring based on buyer activity, weekly review habits, and regular model updates.
Here’s the short version:
- Clean the data first. I need clear deal stages, current close dates, logged activity, and required fields on every open deal.
- Score deals by behavior, not rep opinion. The model looks at signals like deal age, meeting activity, engaged contacts, and stalled stages.
- Forecast with probabilities. A $120,000 deal at 65% win probability adds $78,000 to forecasted revenue.
- Test before replacing my current process. I should run the model next to my manual method for 30–60 days and compare both to actual revenue.
- Use the signals every week. I need alerts for stalled deals, slipped close dates, and commit deals that the model scores too low.
- Track the right metrics. The main ones are MAPE, slip rate, segment-level accuracy, and forecast bias.
A few numbers make the case fast. On a $10 million quarterly forecast, a 15% miss means a $1.5 million swing. And stage-weighted forecasting often lands around 15%–40% MAPE, while predictive models can cut that to 5%–15% when the setup is clean.
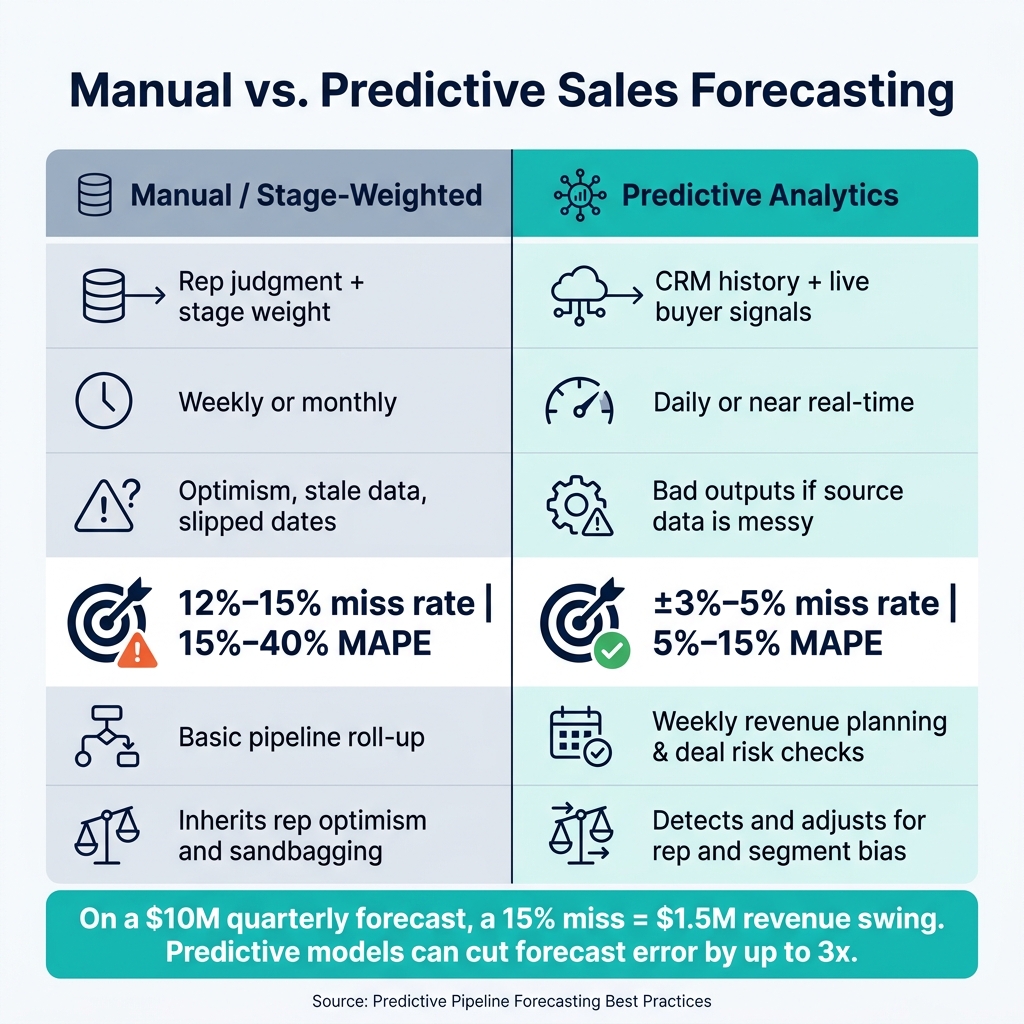
Manual vs. Predictive Sales Forecasting: Accuracy & Performance Comparison
The Predictive Pipeline: How to Drive Smarter Sales
sbb-itb-17e8ec9
Quick comparison
| Area | Manual / stage-weighted forecast | Predictive forecast |
|---|---|---|
| Main input | Rep judgment + stage weight | CRM history + live buyer signals |
| Update speed | Weekly or monthly | Daily or near real time |
| Common problem | Optimism, stale data, slipped dates | Bad outputs if source data is messy |
| Accuracy range | Often 12%–15% misses or 15%–40% MAPE | Can reach ±3%–5% or 5%–15% MAPE |
| Best use | Basic pipeline roll-up | Weekly revenue planning and deal risk checks |
If I had to reduce the article to one point, it would be this: predictive analytics helps only when I treat pipeline hygiene, forecast math, and weekly review discipline as one system.
Build a Reliable Data Foundation First
Once you know where the pipeline is breaking down, the next step is fixing the data your model learns from. Predictive analytics only works when CRM data is clean, consistent, and complete. As Janis Zech, CEO of Weflow, put it:
"A model trained on incomplete Salesforce records - missing activity data, stale close dates, no contact engagement history - will produce unreliable scores."
Audit CRM fields, deal stages, and activity data
Start with the last 12–24 months of closed-won and closed-lost deals. Review them across four checks:
- Activity coverage: at least one logged activity in the past 30 days
- Contact association: a primary contact assigned to each deal
- Stage compliance: exit criteria met
- Close date accuracy: how often dates slipped without a real change in the deal
Every open opportunity should include a deal amount in USD, an assigned owner, a close date, and a forecast category. To keep deals in the forecast, they also need a documented Next Step and Next Step Date.
This part matters more than it may seem. If Stage 3 means one thing to one rep and something else to another, the model won’t learn patterns. It’ll learn noise. Each stage needs clear entry and exit criteria. No gray area.
The model also needs enough history to spot patterns that hold up over time. A practical minimum is 200–300 closed opportunities and at least 12 months of clean win/loss data.
Automate data capture to reduce manual gaps
Manual logging leaves holes in the CRM. Sales reps spend about 17% of their time on manual CRM data entry, and that usually means records end up partial or late. The fix is simple: automate as much capture as you can.
When email, calendar, and call data sync straight into the CRM, meetings, outreach, and conversations get logged without reps doing the work by hand. Current tools can connect with Google Workspace or Microsoft 365 to auto-create contacts, log activity, and pull qualification signals like MEDDIC criteria from call transcripts.
One example makes the payoff pretty clear. A 20-person sales team that added automated data capture from Google Workspace and Zoom got back 10 hours per week per rep. At a $75/hour internal rate, that worked out to about $780,000 in annual cost savings.
Align sales data with financial reporting
Pipeline forecasts don’t stand alone. They need to match the way the business plans cash flow, headcount, and runway. That means Sales and Finance need the same definition of bookings, which is contract value, and recognized revenue, which is revenue recorded over time.
It also helps to share three forecast bands:
- Conservative
- Likely
- Upside
That gives Finance room to model different scenarios without guessing.
When CRM data and financial records match up, changes in the pipeline are much easier to reflect in cash flow plans and board reporting. It also makes live revenue updates far easier during weekly reviews.
Apply Predictive Analytics to Live Pipeline Forecasting
Once your CRM and finance data are clean, you can turn them into live deal scores. The idea is simple: use the data you already have in your CRM and engagement tools to score deals as they move through the pipeline.
Score each deal using historical and behavioral signals
Models like logistic regression and gradient boosted decision trees compare a live deal's traits with past deals to estimate the chance of a win. The strongest inputs tend to be deal age, activity volume, email and meeting frequency, number of stakeholders engaged, and stage stall time - when a deal has been sitting in one stage longer than similar won deals.
This matters because the model looks at behavior, not gut feel. As Janis Zech, CEO of Weflow, put it:
"The model doesn't care what the rep put in the forecast category. It looks at what's actually happening: how often the champion responds, how long a deal has sat in a stage, whether a business case has been shared."
A score alone isn't enough. You also need the reason behind it. Notes like "No executive buyer identified" or "moving slower than similar deals" give managers something concrete to coach on instead of just staring at a low number.
Calculate expected revenue from deal-level probabilities
To turn scores into a forecast, multiply each deal amount by its win probability and add the results together. So a $120,000 deal with a 0.65 win probability adds $78,000 to the forecast.
From there, plug that output into your current forecast bands. One practical rule is to include only deals with a predictive score of 40% or higher in the commit forecast. Anything below that should stay in upside only.
That gives you a live forecast you can check every week instead of a static snapshot.
Run a pilot against your current forecasting method
Don't swap out your current forecast on day one. Run the predictive model in parallel for 30 to 60 days alongside your current method. Start small with one team, region, or product line - ideally 10 to 20 reps - instead of pushing it across the whole company at once.
During the pilot, review the model every week and focus on where it disagrees with reps. Pay close attention to cases where the model flagged a stalled deal that a rep still kept in commit. Track Mean Absolute Percentage Error (MAPE) to measure total forecast error, and watch for bias - whether the model or the reps tend to over-forecast or under-forecast.
There’s a big gap here. Stage-weighted methods usually land in the 15% to 40% MAPE range, while well-set-up predictive models can cut that to 5% to 15%.
Only make the AI forecast your main method after it keeps beating the manual baseline and the team can understand why the model is making each call. Use what comes out of the pilot in weekly pipeline reviews and alerts, so the test is tied to day-to-day pipeline management.
Use Predictive Signals in Weekly Pipeline Reviews
After the pilot, weekly reviews are where predictive scores start to matter. This is where the team turns signals into action. Use these signals in weekly pipeline reviews, not in monthly dashboards that show up too late.
Track movement, risk, and coverage in one dashboard
Start each week with the pilot's score, probability, and close-date updates. Put the key signals in one dashboard: score, expected value change, close-date movement, last email or meeting, and risk flags.
Watch for a few patterns that tend to cause trouble:
- Deals sitting in a stage more than 2x longer than their historical average
- Single-contact deals in late stages
- Deals where the rep calls "Commit" but the model scores below the commit threshold
Coverage matters too. 3x coverage is the minimum. If coverage drops below 2.5x, treat it as a red flag.
A week-over-week movement view helps managers see what changed: which deals moved forward, which stalled, and which new opportunities entered the pipeline. Those are the signals to act on before the forecast is locked.
Set alerts for stalled or delayed deals
Automated alerts help the team catch issues while there's still time to fix them. For example, alert on any deal in the Proposal stage with no email or meeting activity for more than 14 days. Also alert on deals with repeated close-date pushes. A slip rate above 20% per quarter points to repeated optimistic close dates.
The table below links common risk signals to the next step:
| Risk Signal | Predictive Indicator | Recommended Action |
|---|---|---|
| Stalled or Disengaged | Deal in stage 2x longer than average, or no activity for 14+ days | Re-verify pain points; trigger manager deal scrub |
| Single-Contact Deal | Only one contact on a late-stage deal | Require multithreading; request intro to additional stakeholders |
| Forecast Divergence | Rep calls "Commit", model scores below the commit threshold | Move deal to "Best Case"; manager review required |
Connect pipeline changes to revenue and runway planning
Once Sales updates the forecast, Finance should work from those same numbers for runway planning. Weekly pipeline changes should feed into revenue and runway assumptions that same day. Sales and Finance should review the same forecast each week, side by side.
Use the weekly review to compare forecasted results with actual results, then refine the model.
Measure Forecast Improvement and Refine the Model
Once your weekly pipeline reviews are in place, the next step is simple: check whether the model is making your forecast better.
Compare predictive forecasts to stage-weighted forecasts
Run the predictive model next to your current stage-weighted forecast for 30 to 60 days. Then compare both against actual closed revenue.
That side-by-side test gives you a clean read on performance. On a $12 million quarter, cutting forecast uncertainty from $3.6 million to $1.2 million changes the conversation fast. It can mean the gap between guessing on headcount and making a confident hire.
Use the comparison below to spot where the predictive model outperforms your current approach.
| Dimension | Stage-Weighted | Predictive Analytics |
|---|---|---|
| Speed & Frequency | Weekly or monthly manual roll-ups | Daily or real-time continuous updates |
| Bias Handling | Inherits rep optimism and sandbagging | Detects and adjusts for rep and segment bias |
| Financial Planning | High uncertainty; difficult for runway planning | Higher confidence; supports spending and hiring decisions |
During the parallel test, pay close attention to forecast bias. If the model keeps over-predicting by more than 5%, tighten the probability thresholds before you use the output for financial planning.
Track accuracy by segment, rep, and reporting period
Big-picture accuracy can look good while trouble hides underneath. A 90% overall accuracy score can still cover up a rep segment that misses by 25% again and again.
That’s why it helps to break accuracy out by rep, team, and segment. Do the same for new-logo deals vs. expansion and mid-market vs. enterprise. If one area keeps drifting, you want to catch it early instead of letting the headline number fool you.
The main metrics to watch each month and quarter are:
- Forecast accuracy percentage
- MAPE (Mean Absolute Percentage Error)
- Slip rate
- Stage-to-stage conversion rates
Aim for a MAPE below 10% and a slip rate below 10% per quarter. If deals in the commit category score below 70% on the predictive model, move the threshold up before you depend on that output.
As new closed-won and closed-lost deals come in, the model should retrain on each new batch of outcomes. If it doesn’t get new inputs, accuracy can slip over 6 to 12 months. Check how often retraining happens and whether the model accounts for shifts in deal mix or market conditions.
Those cuts of the data show where the model is doing its job and where it still needs tuning.
Conclusion: The steps that improve pipeline accuracy most
The teams that improve accuracy the most tend to share four habits: clean and standardized CRM data, deal-level probability scoring tied to actual activity signals, a weekly review rhythm that links pipeline movement to finance calls, and model updates as new deal outcomes come in.
Better pipeline accuracy isn’t just a sales ops win. When Finance is working from a forecast with ±5% variance instead of ±15%, hiring choices, burn-rate planning, and board conversations get a lot tighter. For startups watching runway closely, that kind of precision turns a forecast into a plan. Platforms like Lucid Financials can help by giving founders and finance teams always-on, investor-ready reporting, so changes in the sales forecast show up in the financial model fast.
FAQs
How much clean CRM data do I need to start?
Start with clean, standard CRM opportunity data: opportunities, stages, amounts, owners, close dates, and activity history.
That’s the baseline. If your data is spotty or inconsistent, the model won’t have much to work with.
You also need enough closed-deal volume for the model to pick up patterns. In many AI forecasting tools, the usual floor is 100 closed deals per model to get output that means anything statistically. If you’re below that, skip the fancy stuff for now. Use simpler baselines first, then bring in ML later when you have more data.
What signals make a predictive sales forecast more accurate?
Predictive sales forecasts tend to be more accurate when they’re based on evidence from past performance and live activity, not gut feelings or personal opinions.
The main signals include CRM activity, buyer engagement, deal velocity, stage progression, intent data, firmographic details, and conversation sentiment. What matters most, though, is data quality. Forecasts work best when data is complete, logged the same way across the team, and tied to clear qualification criteria.
How do I know if predictive forecasting is working?
It’s working when forecast variance drops in a clear, measurable way. For example, mature deployments often move from about +/- 12% to 15% down to roughly +/- 3% to 5%.
You should also see a clear shift in how pipeline reviews happen. Instead of reactive, opinion-based discussions, teams start acting on signals earlier. At-risk deals get flagged sooner, executive confidence gets stronger, quota attainment improves, and there are fewer end-of-quarter surprises.