Your hiring plan is a cash plan first. If payroll makes up about 76.4% of startup spending, even a few hires can cut runway fast.
If I want investors to take my forecast seriously, I need to show four things up front:
- Who I plan to hire
- When each person starts
- What each hire costs in full
- How those hires change burn and runway
A simple example shows why this matters: $3,000,000 in cash with $150,000 in monthly burn gives about 20 months of runway. Add five hires at $12,000 per month each, and runway drops to about 14 months. That is the kind of change investors check right away.
Here’s the short version of what an investor-ready forecast needs to cover:
- Hiring tied to revenue targets, product milestones, or customer load
- Fully loaded cost, not base salary alone
- Monthly headcount by team, with hires, exits, and ending headcount
- Base, upside, and downside cases
- Clear links from headcount to P&L, cash flow, burn, and runway
- A short assumptions page with salary bands, start dates, attrition, and commission rules
I also need to show discipline in timing. That means using hiring triggers, building in fill delays, separating employees from contractors, and tracking forecast vs. actual every month.
Below, I’ll walk through the main parts investors want to review so the team growth plan is easy to follow and easy to test.
Connect Hiring Plans to Business Drivers and Milestones
Once your forecast shows total headcount, investors want to know why each hire happens when it does. A list of roles and start dates isn't enough on its own. What matters is the business case behind each one.
In this section, present hiring as proof of capital discipline. Each role should connect to a clear driver, not just a date on a spreadsheet.
Use Top-Down and Bottom-Up Headcount Planning Together
The strongest plans use both methods together.
With a top-down model, you might start with a target like reaching $1,500,000 ARR by December 2027 while keeping net burn below $150,000 per month and holding at least 18 months of runway. That gives you guardrails.
Bottom-up planning works from the role level upward. You use productivity assumptions to estimate how many people you need, what they'll cost, and what output they should produce.
For example:
- In sales, a common benchmark is $400,000–$800,000 ARR per fully ramped AE per year, depending on deal size and sales cycle length.
- In customer success, a typical CSM load is 30–60 accounts, depending on contract complexity.
- In engineering, headcount should tie back to specific roadmap deliverables and the team capacity needed to ship them.
Use top-down planning to set the limits. Use bottom-up planning to decide how headcount fits inside those limits based on actual work capacity.
If the two methods don't line up, fix the gap before investors point it out. That may mean revising targets, pricing, or the hiring sequence.
Tie New Roles to Milestones Investors Can Evaluate
After you've checked capacity, tie each new role to a business milestone that clearly triggers the hire. The trigger should be concrete and easy to test.
That can look like hiring a first CSM once you pass 40 paying customers or $500,000 ARR, adding a second AE after $750,000 ARR, bringing on a DevOps engineer when Product V2 launches, or adding 3 U.S. GTM roles after closing a $2,000,000 Seed round.
Investors can review triggers like these fast because they connect hiring to observable business events, not vague plans.
A simple table helps make that logic easy to scan in diligence:
| Milestone | Hires Triggered | Expected Outcome |
|---|---|---|
| $500,000 ARR or 40 paying customers | 1st CSM | Keep churn below 8% annually |
| $750,000 ARR | 2nd AE | Add sales capacity as demand grows |
| Product V2 launch | DevOps engineer | Improve reliability and support expansion |
| $2,000,000 Seed close | 3 GTM roles | Fund the next hires |
In your forecast model, include each role's monthly fully loaded cost so investors can see the burn effect right next to the hiring trigger.
Show How the Use of Funds Supports the Hiring Plan
The same logic should show up in your raise plan.
If you're raising $3,000,000 at Seed, you might allocate 60% ($1,800,000) to team growth, 25% ($750,000) to go-to-market programs, and 15% ($450,000) to infrastructure and contingencies.
Inside the team budget, get specific by function. For example, spell out that you're funding:
- 4 engineering hires to ship key product releases
- 3 AEs and 1 SDR to scale net new ARR
- 2 CSMs to support retention as accounts grow
Each hiring group should connect to a measurable result, such as growing from $300,000 to $1,500,000 ARR over 24 months while keeping net revenue retention above 100%. Investors want a straight line from capital to hires to output.
sbb-itb-17e8ec9
Build a Headcount and Personnel Cost Model Investors Can Trust
Once your hiring plan lines up with company milestones, turn it into a month-by-month roster and cost model.
Create a Master Roster with Start Dates, Compensation, and Status
Set up one row per person. Include role, department, employment type, base salary, start date, and status: active, approved, or forecasted. Use monthly columns for start date and payroll timing so payroll starts ONLY in the month that person actually joins.
If someone starts mid-month, prorate that first payroll month. After that, use the full monthly cost. Investors want to see timing that matches how hiring works in practice, not a smoothed-out estimate.
You should also build in a 30–90 day hiring lag for key roles. If your team usually fills 75% of roles on schedule, push some start dates out to reflect that. This kind of conservative timing tends to land better with investors because it shows you understand recruiting friction and have left room in the runway plan.
That roster then feeds your fully loaded personnel cost model.
Model Fully Loaded Employee Cost, Not Salary Alone
Salary is only part of the picture.
In the U.S., fully loaded employee cost often lands around 1.25–1.40× base salary, once you add taxes, benefits, retirement match, and equipment. So a $125,000 engineer often costs $156,250–$175,000 per year before one-time hiring costs.
Break out each piece of that load so investors can inspect the math:
- Benefits load
- Payroll tax
- Equipment per hire
If executives get richer benefits, give those roles a higher loaded factor on purpose. Don't apply one flat percentage to everyone if the cost structure isn't the same.
Separate Employees, Contractors, and One-Time Hiring Costs
Keep W-2 employees and contractors on separate lines. Contractors may have flat monthly retainers and usually don't carry payroll taxes or benefits, while W-2 employees do. That split helps investors see which costs are more fixed and which can move.
One-time hiring costs should also sit in their own category. A 20% recruiting fee on a $200,000 executive hire is a $40,000 cash hit. It shouldn't be blended into monthly payroll. The same goes for signing bonuses, relocation packages, and equipment. Those affect cash flow right away, so they need to stay separate from recurring payroll.
Choose the Right Forecasting Method for Your Stage
Use the method that fits the amount of data you have. Early-stage companies usually lean on milestone-based or as-is planning. Scaling companies often move toward demand-based or sales-capacity models.
| Method | Best For | Strength | Limitation |
|---|---|---|---|
| As-is / milestone-based | Early-stage companies | Ties hires to observable triggers | Less predictive when the business changes quickly |
| Demand-based | Scaling companies | Connects headcount to operational volume | Requires reliable demand data |
| Sales-capacity | Revenue teams | Links AEs and SDRs to quota and pipeline | Depends on accurate ramp assumptions |
| Trend-based | Companies with stable historical data | Projects from observed growth patterns | Breaks down during rapid pivots |
The investor-facing models people tend to trust most often mix methods. For example, you might use sales-capacity planning for revenue roles and milestone-based planning for product and operations.
That decision also changes how you pressure-test burn and runway across different hiring paths.
Stress-Test Hiring Plans with Scenarios, Burn, and Runway
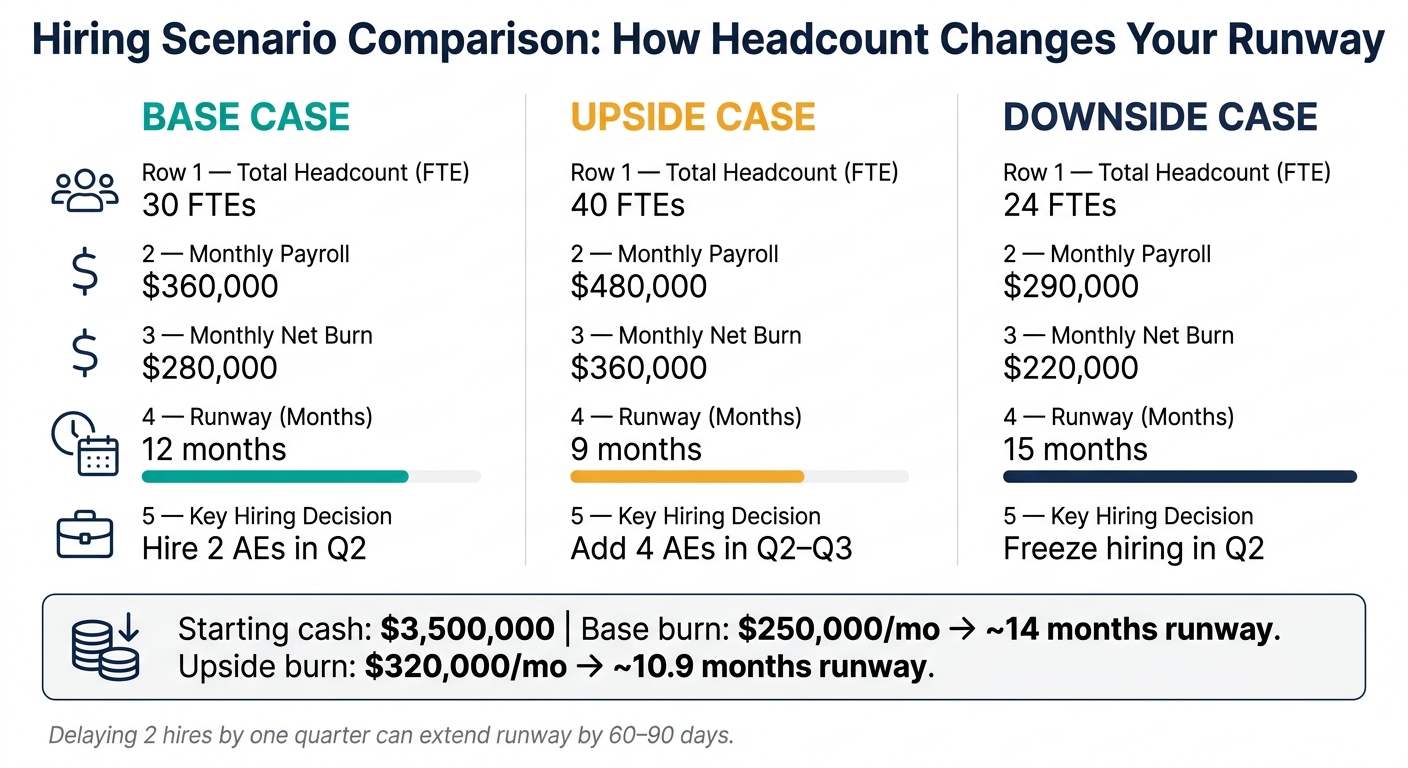
Investor-Ready Hiring Forecast: Base vs. Upside vs. Downside Scenarios
Scenario planning shows whether your loaded headcount plan can hold up if growth speeds up, slows down, or your next raise lands later than expected. After you’ve built your roster and loaded cost model, pressure-test the plan across different growth and fundraising paths.
Build Base, Upside, and Downside Hiring Cases
Create three versions of the hiring plan. Each one should include its own headcount pace, pay assumptions, and revenue outlook.
- Base case: follows current traction
- Upside case: assumes faster growth and earlier hires
- Downside case: models slower growth and a hiring freeze
The big rule here is simple: each scenario has to match itself all the way through. If the upside case adds four account executives in Q2–Q3, then monthly payroll, operating expenses, net burn, and runway all need to change with it. You can’t update headcount and leave the rest untouched.
Here’s what that looks like in cash terms: with $3,500,000 in the bank, a $250,000 base-case burn gives you about 14 months of runway. If burn climbs to $320,000 in the upside case, runway drops to about 10.9 months.
Set Hiring Triggers and Runway Guardrails
Tie hires to clear signals, not calendar dates. That keeps the plan grounded in what the business is doing, not what you hoped it would do six months ago.
Common examples include:
- Hire the next two account executives once MRR stays above $100,000 for 3 months
- Add a sales development rep when qualified opportunities stay above 40 per month for 2 quarters
Keep 9–12 months of runway. If base-case runway falls below 9 months, pause new hiring unless the move improves unit economics. Start fundraising when runway reaches 6–9 months. Put these rules on the assumptions page so they’re easy to see and hard to sidestep.
Review Forecast vs. Actuals Every Month
Use the base case as your working benchmark. The other scenarios are there to show how fast the plan can bend - or break - when conditions change. But that only helps if you check the model against actual results every month.
Compare actual headcount, payroll, and net burn to the base case each month, then update assumptions when variance shows up. If you planned for 35 FTEs and ended the month at 33, that gap can point to delayed hiring or a shift in demand. Even a small change can matter: delaying two hires by one quarter can extend runway by 60–90 days.
The table below shows how one hiring plan changes cash risk across three cases:
| Metric | Base Case | Upside Case | Downside Case |
|---|---|---|---|
| Total Headcount (FTE) | 30 | 40 | 24 |
| Monthly Payroll (USD) | $360,000 | $480,000 | $290,000 |
| Monthly Net Burn (USD) | $280,000 | $360,000 | $220,000 |
| Runway (Months) | 12 | 9 | 15 |
| Key Hiring Decisions | Hire 2 AEs in Q2 | Add 4 AEs in Q2–Q3 | Freeze hiring in Q2 |
Present the Forecast in a Format Investors Can Review Quickly
Once you've stress-tested the hiring plan, turn it into the format investors usually check first: one clean view they can scan in a few minutes. That view should line up with your pitch deck, data room, and financial statements. Keep it tight. Show growth, cost, and timing in one place.
Summarize Headcount by Department and Month
Build a simple grid with months across the top and departments down the side - Engineering, Product, Sales, Marketing, Customer Success, and G&A. For each department and each month, show these four fields:
- Opening Headcount
- New Hires
- Departures
- Ending Headcount
Use this formula: Ending Headcount = Opening + Hires − Departures.
Add a total company headcount row at the bottom so investors can spot the hiring pace right away. It also helps to mark milestone months in the grid, so the ramp matches the business events behind it.
Link Personnel Costs to the Income Statement and Cash Flow Forecast
Every cost in the headcount schedule - base salary, payroll taxes, benefits, bonuses, and commissions - should flow into the income statement. Map those totals to Research & Development, Sales & Marketing, and General & Administrative salaries and benefits. Put commissions on a separate Sales Commissions line.
Those same totals should also flow into the cash flow forecast as monthly cash outflows. Adjust for payroll timing, such as semi-monthly pay periods, so the cash view matches how money actually leaves the business.
Prepare a Short Assumptions Page for Diligence
Use one tab or one slide. Keep it to 10–20 rows and focus on the inputs that move the most dollars. A clean assumptions page usually includes:
- Salary bands by role and level
- Benefits and payroll tax load
- Planned start dates and hiring cadence
- Attrition rate
- Commission structure
- Fundraising timing tied to the hiring ramp
This gives investors a fast way to check your assumptions against U.S. market norms without digging through formulas. Label the model clearly, and note any external review in the data room. It also makes monthly updates easier.
Keep Forecasts Current with Integrated Reporting and AI Support
Use Live Financial Data to Avoid Stale Assumptions
After the model is built, the next check is simple: are the inputs still current? A hiring forecast is only as good as the data behind it. If payroll, offers, and cash balances fall out of date, burn and runway can drift fast - and investors will spot that. When a forecast no longer matches actual payroll or runway, it starts to lose trust.
Live inputs make the forecast useful between monthly reviews. Refresh it after each close, then update it right away after any hire delay, pay change, role freeze, contractor conversion, or financing close. If the company is hiring actively, a weekly refresh makes sense.
This is much easier when payroll, accounting, and reporting sit in one system.
How Lucid Financials Supports Investor-Ready Hiring Forecasts

Lucid Financials brings bookkeeping, tax, CFO support, and Slack-based reporting into one place, so hiring forecasts stay connected to live accounting data.
Conclusion: Make the Forecast Clear on Growth, Cost, and Timing
An investor-ready forecast should be clear on growth, cost, and timing. The table below covers the minimum points investors want to review.
| Element | Investor Checkpoint |
|---|---|
| Milestone-linked hiring | Each role linked to a specific business event or revenue target |
| Fully loaded costs | Salary, payroll taxes, benefits, bonuses, and recruiting fees included |
| Monthly headcount by department | Openings, new hires, departures, and ending headcount by department |
| Scenario planning | Base, upside, and downside cases with burn and runway impact |
| Ties to actual payroll and cash | Forecast reconciles to actual payroll and current cash position |
| Concise assumptions page | Salary bands, attrition, start dates, and fundraising timing |
Investors aren't looking for a perfect forecast. They want a plan that feels credible, stays tied to cash, and matches the rest of the financial model. When the numbers, assumptions, and growth story line up, diligence tends to move faster and trust in the team gets stronger.
FAQs
How do I decide when to hire?
Hire based on what the numbers and the business are telling you, not on a preset timeline.
A simple way to do that is to tie each hire to a clear milestone, like hitting $1,200,000.00 in ARR or closing a funding round. That keeps hiring grounded in progress instead of guesswork.
It also helps to map out what each new hire does to your cash runway over the next 12–18 months. A role might look overdue on paper, but the math can tell a different story fast.
Before you bring on a full-time employee, pressure-test the need. Ask this: What function breaks if we don’t fill this role in the next 90 days? If nothing meaningfully breaks, the hire may not be urgent yet.
What counts as fully loaded headcount cost?
Fully loaded headcount cost is the total cash cost of an employee beyond base salary. It usually includes base pay, payroll taxes, benefits, and job-related overhead like equipment, workspace, and software.
For budgeting and investor-ready forecasts, startups often estimate it at 1.25x to 1.4x the employee’s annual base salary.
How often should I update my hiring forecast?
Review your hiring forecast monthly and run a variance analysis to compare actual progress with your plan. Then share more formal updates quarterly.
This gives you an early read on gaps, helps you adjust when revenue targets or product roadmaps shift, and keeps hiring on pace with what investors expect.