If you want the short answer: use gross profit, not revenue, and expect most B2B SaaS payback periods in 2026 to land around 15–16 months. If you’re under 12 months, you’re in solid shape. If you’re in the 5–7 month range, you’re near the top end.
I’d sum up the article like this:
- All five tools measure CAC payback in months
- The base formula is CAC ÷ (monthly revenue per customer × gross margin)
- Brenton Way adds LTV, churn, and benchmark bands
- Wall Street Prep uses sales and marketing spend ÷ new MRR × gross margin
- The SaaS CFO goes beyond gross payback and can estimate net payback
- The main mistake to avoid is using revenue instead of gross profit, which can make payback look 20%–33% shorter
If I were picking fast:
- For a plain month count: Ideal Customer Profile or ProductLift
- For more context: Brenton Way
- For finance-led modeling: Wall Street Prep
- For net payback and expansion-heavy SaaS: The SaaS CFO
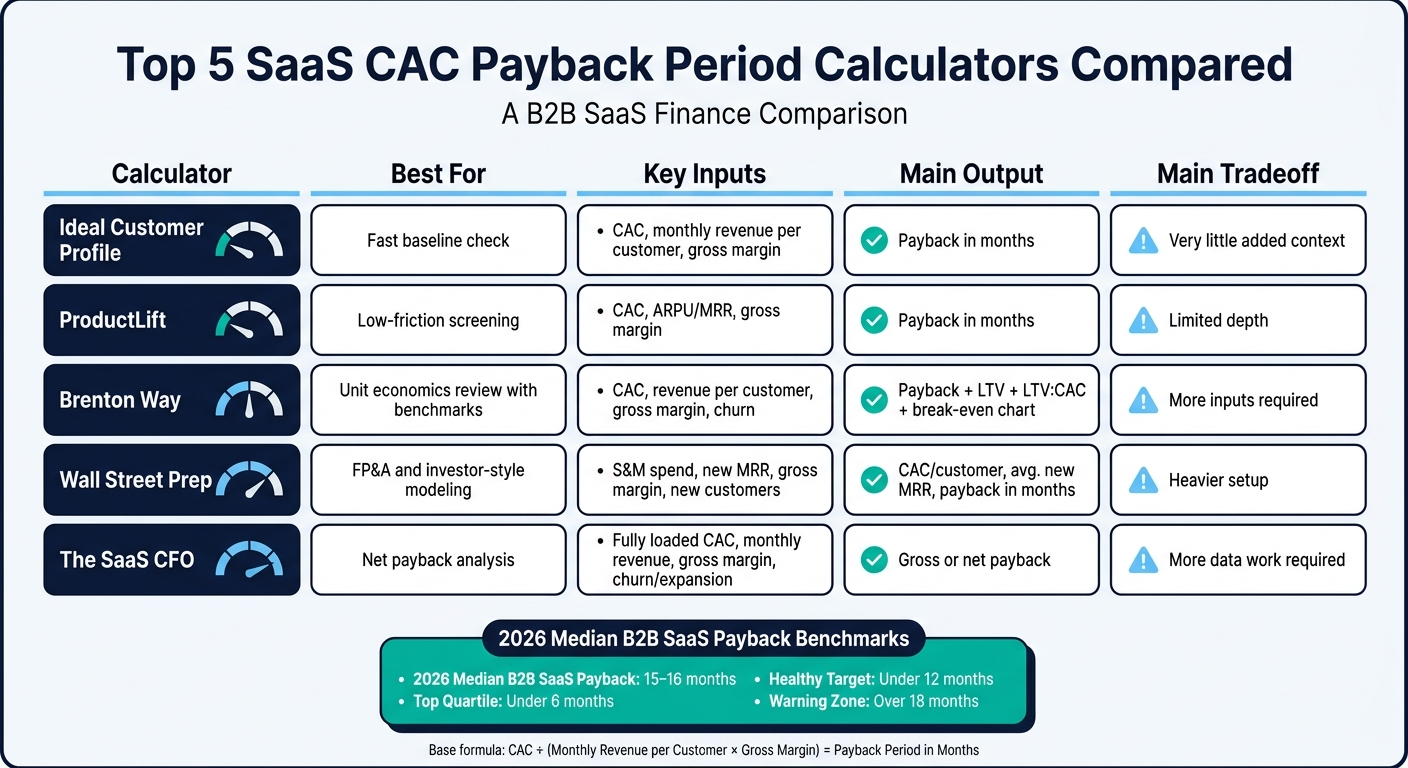
Top 5 SaaS CAC Payback Period Calculators Compared
CAC Payback Period | SaaS Metrics School | The SaaS CFO
sbb-itb-17e8ec9
Quick Comparison
| Calculator | Best For | Main Inputs | Main Output | Main Tradeoff |
|---|---|---|---|---|
| Ideal Customer Profile | Fast baseline check | CAC, monthly revenue per customer, gross margin | Payback in months | Very little added context |
| ProductLift | Low-friction screening | CAC, ARPU/MRR, gross margin | Payback in months | Limited depth |
| Brenton Way | Unit economics review with benchmarks | CAC, revenue per customer, gross margin, churn | Payback, LTV, LTV:CAC, break-even chart | More inputs |
| Wall Street Prep | FP&A and investor-style modeling | S&M spend, new MRR, gross margin, new customers | CAC/customer, avg. new MRR, payback | Heavier setup |
| The SaaS CFO | Net payback analysis | Fully loaded CAC, monthly revenue, gross margin, plus churn/expansion if needed | Gross or net payback | More data work |
Bottom line: I’d use the simplest calculator that answers the question in front of me. If I only need a fast check, I’d keep it simple. If I’m planning spend, headcount, or board reporting, I’d use a model with gross margin, fully loaded CAC, and, when needed, expansion revenue.
1. Ideal Customer Profile CAC Payback Calculator
Formula Basis
This calculator uses the standard CAC ÷ (monthly revenue per customer × gross margin) formula. The result is your payback period in months.
Inputs Required
You’ll need three inputs:
- Fully loaded CAC
- Monthly revenue per customer, such as ARPU or MRR per account
- Gross margin
Finance teams usually pull these numbers from accounting, billing systems, and the P&L.
Outputs and Benchmarks
It gives you one output: payback period in months. For targets, don’t rely on one company-wide number. It makes more sense to use segment-specific benchmarks instead.
Finance-Team Fit
This calculator fits board reporting and capital-efficiency analysis well. Think of it as the baseline tool in this list, then use the other calculators to compare more specific cases.
2. ProductLift CAC Payback Period Calculator
Formula Basis
If you want the same core metric in a lighter interface, ProductLift uses the standard payback formula. It factors in gross margin instead of raw revenue, then shows the result in a clean, simple format.
Inputs Required
Enter:
- CAC
- MRR per customer or ARPU
- Gross margin
Outputs
The calculator returns your payback period in months.
Finance-Team Fit
This tool works well for founders and finance teams that want a quick, low-friction payback check. It’s handy for fast screening before a deeper model review.
3. Brenton Way CAC Payback Calculator

Formula Basis
The Brenton Way calculator gives you more than a basic payback number. It puts payback, churn-based LTV, and benchmark bands in the same view, which makes it easier to judge what the number means in practice.
It uses the standard payback formula, then adds churn-based LTV context.
Inputs Required
You'll enter your CAC, monthly revenue per customer (or MRR per account), Gross Margin %, and Monthly Churn %. There’s also a business-model dropdown with benchmark bands for B2B SaaS, DTC eCommerce, consumer subscription, B2B services, and healthcare.
One key detail: churn affects LTV, not payback. That’s an easy point to miss. And if you want a number you can trust, use fully loaded CAC, including ad spend, salaries, and tools. If you leave those out, payback will look shorter than it is.
Outputs and Benchmarks
The calculator returns payback, estimated LTV, LTV:CAC, and a break-even chart. That break-even chart shows when cumulative gross profit crosses CAC.
For B2B SaaS, under 12 months is healthy, while over 18 months falls into the warning band. Here’s how Brenton Way frames the benchmarks across the business models it supports:
| Business Model | Healthy Payback Benchmark | Warning Band |
|---|---|---|
| B2B SaaS | < 12 months | > 18 months |
| DTC eCommerce | < 3 months | > 6 months |
| Consumer Subscription | < 6 months | > 9 months |
| B2B Services/Agencies | < 6 months | > 12 months |
| Healthcare Practices | < 12 months | > 18 months |
Source: Brenton Way
Finance-Team Fit
This one fits growth-stage teams that want a quick unit-economics check across channels or pricing. It’s free, doesn’t require signup, and works well for fast scenario checks.
4. Wall Street Prep CAC Payback Period Calculator

Formula Basis
For teams that want a more model-driven approach, Wall Street Prep looks at total sales and marketing spend instead of just CAC on a per-customer basis. Its formula is:
CAC Payback Period = S&M Expense ÷ (New MRR × Gross Margin %)
That matters because the model ties payback to gross profit, not top-line revenue. In practice, that makes it a better fit for finance-led work than early-stage founder screening.
Inputs Required
You’ll need total S&M expense, new MRR from newly acquired customers, gross margin %, and the number of new customers. Wall Street Prep also suggests using net new MRR for a tighter read on expansion and churn.
With those inputs, teams can pressure-test payback across different acquisition cases without much friction.
Outputs and Benchmarks
The calculator returns:
- CAC per customer
- Average new MRR per customer
- CAC payback period in months
In Wall Street Prep’s example, the result is a 14-month payback. Their rule of thumb is simple: most SaaS startups usually stay under 12 months.
Finance-Team Fit
This one is a better match for FP&A, PE, and banking teams that need audit-ready modeling, not a fast back-of-the-napkin estimate. If speed is the goal, it may feel a bit heavy. If precision matters most, it fits the job.
5. The SaaS CFO CAC Payback Period Model
Formula Basis
For teams that want the most complete view in this list, this model goes past simple gross payback. The SaaS CFO model uses the gross profit version of CAC payback. If you look at revenue alone, recovery speed can look faster than it is by 20% to 30%.
Inputs Required
You’ll need:
- fully-loaded CAC
- monthly revenue per customer
- gross margin %
You can also add churn and expansion revenue if you want to calculate net payback.
The tricky part is fully-loaded CAC. It takes more work to put together because it includes salaries, equity, and tools.
Outputs and Benchmarks
Those extra inputs make this model a better fit for land-and-expand businesses. It can also estimate net payback when you include expansion revenue and post-acquisition costs.
That matters because net payback can be 30% to 40% shorter than gross payback for land-and-expand businesses. As a broad SaaS benchmark, use 15 to 16 months.
If plain CAC payback doesn’t give you enough to judge capital efficiency, this model gives you a much better read.
Finance-Team Fit
This model is best for finance teams that need net payback, not just gross payback. In plain English, it’s a stronger fit for finance than for a fast founder-level screen.
How to Read Your Calculator Results
Use the formula that matches the decision in front of you: per-customer payback for unit economics, and period-based payback for GTM efficiency.
Here’s the simple way to think about it. Per-customer formulas tell you how long it takes to earn back the cost of acquiring one customer. Period-based models look at sales efficiency at the team or company level over a set period.
That’s why you shouldn’t compare the two unless the attribution window lines up, which is usually one quarter.
Once you know which formula you’re using, the next job is avoiding the errors that make the result look better than it is.
A common mistake is using revenue instead of gross profit. If you use revenue in place of gross profit, payback looks about 20% to 33% shorter than it should for typical SaaS margins. That’s not a small miss. It can distort hiring plans, budget calls, and how aggressively you spend.
Another common error is mixing time units. Monthly inputs and quarterly outputs don’t belong in the same calculation unless you convert them first. Put everything into the same time unit before you compare results.
Use the chart below to match the calculator output to the question you’re trying to answer.
| Use Case | Best Calculator Style | Why It Fits | Limits |
|---|---|---|---|
| Quick point estimate | Simple unit economics (CAC ÷ [ARPU × GM%]) |
Fast inputs; good for early-stage gut checks | Ignores churn; assumes customers stay forever |
| Unit economics deep-dive | LTV:CAC + payback hybrid | Connects recovery speed with total profitability | High LTV can mask dangerously slow cash recovery |
| Multi-segment SaaS | Segmented / channel-specific | Prevents SMB efficiency from hiding enterprise losses | Requires fully-loaded cost allocation per segment |
If you track these inputs every month, manual updates often become the main source of error. For recurring tracking, Lucid Financials can keep gross margin, CAC, and board-ready reporting consistent.
Pros and Cons of Each Calculator
The table below gives you the short version: when each tool is fastest to use, where it shines, and where it falls short.
| Tool | Top Advantages | Main Drawbacks |
|---|---|---|
| Ideal Customer Profile CAC Payback Calculator | Fastest option; 3 inputs; clean baseline payback read | No LTV; no break-even chart; excludes expansion revenue |
| ProductLift CAC Payback Period Calculator | Simple interface; quick payback result; low-friction for fast checks | Limited depth; not suited for detailed finance-team modeling |
| Brenton Way CAC Payback Calculator | Vertical-specific benchmarks for B2B SaaS, DTC, and Healthcare; includes churn in LTV calculations | Requires more data points than simpler tools; does not model churn impact on payback timeline |
| Wall Street Prep CAC Payback Period Calculator | Ties payback to gross profit via S&M spend; outputs CAC per customer and average new MRR | Assumes constant churn; ignores expansion revenue |
| The SaaS CFO CAC Payback Period Model | Supports net payback with expansion revenue; breaks down channel-level efficiency | Higher data requirements; can be noisy for small cohorts |
If you just want a fast gut check, Ideal Customer Profile and ProductLift are the easiest places to start. They keep things light and give you a quick answer without much setup.
If you need more than a surface-level read, the tradeoff changes. Brenton Way adds vertical benchmarks and folds churn into LTV calculations. Wall Street Prep ties payback to gross profit and gives you CAC per customer plus average new MRR. And The SaaS CFO model goes a step further by supporting net payback with expansion revenue and showing channel-level efficiency.
That said, more detail usually means more inputs. So the best tool often comes down to one simple thing: are you doing a fast check, or are you trying to model how the business actually performs?
Conclusion
The best calculator depends on the decision in front of you. Pick the one that fits the job: a fast screen, a benchmark check, or deeper cohort planning.
In 2026, median B2B SaaS CAC payback sits at 15–16 months, while top-quartile companies come in at under 6 months. That makes the choice pretty straightforward: use the simplest tool that answers the question you need to answer today. Go simple when you need speed. Go deeper when you need a planning view.
FAQs
How do I calculate fully loaded CAC?
To calculate fully loaded CAC, include all customer acquisition costs, not just ad spend.
That means factoring in costs like:
- Salaries
- Tools
- Commissions
- Contractors
- Overhead
The formula is simple:
Fully loaded CAC = Total Sales & Marketing Spend / Number of New Customers Acquired
The key is to include every acquisition-related cost tied to sales and marketing. If you leave out items like payroll or overhead, your CAC can look lower than it actually is.
When should I use gross payback vs. net payback?
Use gross payback for short-term cash flow planning, conservative forecasting, or when you want to measure new customer acquisition efficiency without expansion revenue. It shows how fast CAC is paid back from new customer revenue alone.
Use net payback for long-term unit economics, LTV modeling, and a more realistic view of revenue over time. It includes ongoing and expansion revenue, which can shorten the payback period.
What’s a good SaaS payback period in 2026?
In 2026, a good SaaS payback period is generally under 12 months.
The best-performing companies often land in the 6 to 8 month range, though that can vary based on stage and business model.