When it comes to growing your business, understanding LTV (Customer Lifetime Value) and CAC (Customer Acquisition Cost) is critical. These two metrics are essential for evaluating profitability and scaling effectively. The LTV:CAC ratio shows how much profit you earn for every dollar spent acquiring customers, with a target ratio of 3:1 often seen as healthy. But mistakes in calculating or interpreting these numbers can lead to flawed decisions.
Key Takeaways:
- LTV predicts the total gross profit from a customer over their lifetime, factoring in revenue, churn rate, and gross margin.
- CAC tracks the total cost of acquiring a customer, including marketing, sales salaries, and tools.
- A ratio above 3:1 is ideal, but exceeding 5:1 may indicate underinvestment in growth.
- Common errors include overestimating LTV, ignoring gross margin, and excluding key costs from CAC.
- Segmenting metrics by customer type or acquisition channel provides clearer insights.
Accurate calculations and reliable data are crucial. Missteps - like using revenue instead of gross margin for LTV or leaving out costs in CAC - can inflate metrics and mislead decisions. To avoid this, ensure all numbers are consistent, segmented, and grounded in your actual financials.
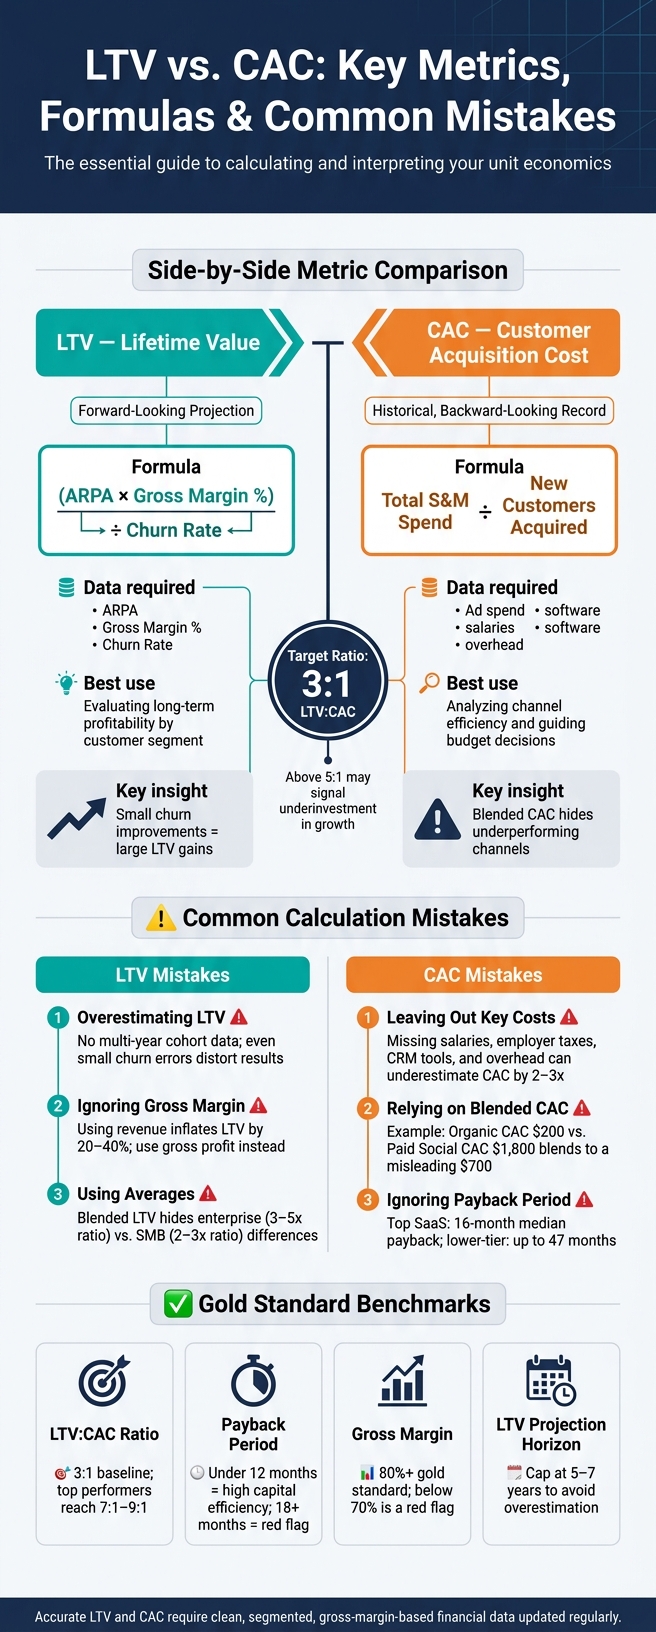
LTV vs. CAC: Key Metrics, Formulas & Common Mistakes
LTV and CAC: Core Concepts
How LTV Is Calculated
LTV, or Lifetime Value, hinges on three main factors: Average Revenue Per Account (ARPA), Gross Margin %, and Churn Rate. The formula looks like this:
LTV = (ARPA × Gross Margin %) ÷ Churn Rate
Because churn rate is in the denominator, even minor reductions in churn can lead to substantial increases in LTV.
"The churn rate is in the denominator of the LTV formula, which means small improvements in churn produce large improvements in LTV." - PitchGrade
For presentations, especially to investors, it's common to include a discount rate to reflect the time value of money:
(ARPA × Gross Margin) ÷ (Churn Rate + Discount Rate)
If your customers tend to increase their spending over time - via upsells or add-ons - you might factor in Net Revenue Retention (NRR) to capture that growth. However, it's a good idea to limit your projections to a 5- to 7-year horizon.
For early-stage startups, calculating LTV can be tricky. Without historical data, you're often left relying on estimates, which can make these projections less reliable.
Now, let's shift gears and break down how CAC is calculated.
How CAC Is Calculated
The formula for Customer Acquisition Cost (CAC) is straightforward:
CAC = Total Sales & Marketing Spend ÷ New Customers Acquired
A full CAC calculation includes all sales and marketing expenses, such as ad spend, salaries, commissions, bonuses, CRM subscriptions, SEO tools, and even event costs. Founders often miss hidden costs like software subscriptions or employee salaries, which can lead to underestimating the true acquisition cost.
It's also helpful to look beyond the overall (or blended) CAC and focus on channel-level CAC - the cost of acquiring customers through specific platforms or campaigns. For example, acquiring a customer via Google Search might cost significantly more than through a webinar series. Relying on averages can obscure these differences, making it harder to identify which channels are draining your budget.
LTV vs. CAC: Side-by-Side Comparison
The table below highlights the key differences between LTV and CAC:
| Feature | LTV (Lifetime Value) | CAC (Customer Acquisition Cost) |
|---|---|---|
| What it Measures | Total gross profit expected from a customer over the relationship | Total cost to acquire a single new customer |
| Formula | (ARPA × Gross Margin %) ÷ Churn Rate | Total S&M Spend ÷ New Customers Acquired |
| Data Required | ARPA, Gross Margin %, Churn Rate | Ad spend, salaries, software, overhead |
| Key Assumptions | Future retention and expansion behavior | Attribution accuracy and full cost inclusion |
| Temporal Nature | Forward-looking projection | Historical, backward-looking record |
| Best Use Case | Evaluating long-term profitability by customer segment | Analyzing channel efficiency and guiding budget decisions |
The main takeaway here is that LTV looks ahead, estimating the potential value a customer could bring in the future, while CAC looks back, capturing the actual costs spent to win that customer. When these two metrics are combined into a ratio, they provide powerful insights into the efficiency and profitability of your customer acquisition strategy - assuming both numbers are calculated accurately and consistently across your business.
sbb-itb-17e8ec9
The Conventional LTV-to-CAC Ratio is BROKEN
Common Mistakes With LTV
LTV calculations can lead to poor decisions if the assumptions behind them are flawed. This is especially risky during periods of growth or when seeking funding. To make meaningful comparisons between LTV and CAC, accuracy is non-negotiable.
Overestimating LTV With Too Little Data
Startups often jump into calculating LTV without enough retention data to back up their estimates. Without multi-year cohort data, you're essentially guessing churn rates - and even small errors in churn can throw LTV calculations way off.
"Assuming multi-year retention without multi-year data creates fantasy economics." - Graham Charlton, Vestd
This is risky because an inflated LTV might suggest customer acquisition is profitable, even when the actual gross profit says otherwise. To avoid this, limit projections to 5–7 years to reduce overestimation risks. Use historical cohort retention curves instead of speculative figures. If you lack solid data, it's better to admit the uncertainty than to rely on overly optimistic guesses.
Leaving Gross Margin Out of LTV
Another common pitfall is using revenue instead of gross profit in LTV calculations. Revenue alone doesn’t reflect the costs of serving a customer - like hosting fees, customer support, or onboarding expenses - so the actual value of a customer is often lower than it seems.
"Revenue is vanity for LTV. Gross profit pays back CAC." - Kishen Patel, Founder, Consult EFC
In fact, revenue-based LTV calculations can overestimate lifetime value by as much as 20–40%. A more reliable formula is (ARPA × Gross Margin %) ÷ Churn Rate, ensuring that the gross margin figure aligns with your real profit and loss (P&L). This way, you avoid spending more on acquisition than the profit a customer actually generates.
Using Averages Instead of Segments
A single, blended LTV figure often hides key differences between customer groups. For instance, high-value customers acquired organically can mask the lower profitability of those gained through paid channels. By averaging these together, you lose sight of critical insights.
"Understanding LTV across all your customers is good, but the real magic comes from segmentation." - Danny Feinberg, Founder, Path to Product
Customer segments, such as enterprise versus SMB, typically behave very differently. They have distinct churn rates, ARPA, and expansion trends. For example, enterprise SaaS often achieves LTV:CAC ratios of 3–5x, while SMB SaaS usually falls between 2–3x. Segmenting your data - like breaking it down by customer cohorts acquired during specific periods - can reveal where value is truly being generated and where inefficiencies are lurking.
Next, we’ll dive into common challenges with calculating CAC.
Common Mistakes With CAC
Getting CAC (Customer Acquisition Cost) right is just as critical as nailing down LTV (Lifetime Value). Missteps here can lead to skewed unit economics and financial headaches. Let’s break down the common pitfalls in calculating CAC and why they matter.
Leaving Out Key Costs
One frequent error is focusing only on paid advertising while ignoring other essential expenses. A complete CAC calculation should include:
- Sales team salaries and commissions
- Employer taxes
- CRM and attribution software costs
- Overhead allocations (office space, travel, etc.)
This is especially tricky for early-stage startups. Founders often spend countless hours on sales efforts without assigning a cost to their time. Once a dedicated sales team is in place, those "hidden" costs suddenly surface, revealing the real customer acquisition expense. Another common issue? Misaligning marketing budgets with actual sales cycles, which can distort efficiency metrics and lead to poor decision-making.
Relying Only on Blended CAC
Blended CAC provides a broad overview by averaging the total acquisition cost across all new customers. While useful for a quick health check, it can hide inefficiencies. Expensive, underperforming channels might slip under the radar when blended with more efficient ones.
"Segmented CAC by channel and cohort is the only version finance teams should trust." - David Skok, SaaS Metrics 2.0
Here’s an example: If your organic CAC is $200 and your paid social CAC is $1,800, a blended CAC of $700 might seem fine at first glance. However, this average masks the fact that paid social is draining resources without delivering proportional value. To get a clearer picture, break down CAC by channel and customer cohort.
Ignoring Payback Period
Even if your LTV:CAC ratio looks great, it doesn’t tell the whole story. The time it takes to recover your CAC - known as the payback period - is just as important. For example, two companies might both have a 4:1 LTV:CAC ratio, but if one recoups its costs in 6 months while the other takes 24 months, their cash flow situations will look very different. This directly impacts runway and growth planning.
"The obsession with LTV/CAC and the laissez-faire attitude to Payback Period is amongst the chief reasons you have a lot of companies that have raised a lot of capital and are now struggling." - Mark Suster, Managing Partner, Upfront Ventures
In 2026, investors are laser-focused on payback periods because they reflect actual cash flow rather than optimistic long-term projections. Top-performing SaaS companies typically achieve a median payback of 16 months, while lower-tier companies can take as long as 47 months - a gap with serious consequences for managing growth and financial stability.
For accuracy, always calculate payback periods based on gross margin, not revenue. This ensures you're accounting for the full cost of serving each customer.
Connecting LTV and CAC to Real Financial Data
Understanding the formulas for LTV (Lifetime Value) and CAC (Customer Acquisition Cost) is just the starting point. The real challenge lies in feeding these formulas with accurate, up-to-date data. Many startups stumble not because the math is wrong but because their data is outdated, incomplete, or scattered across different sources. Reliable data is the backbone of connecting essential financial metrics to actionable strategies.
Use AI-Driven Financial Tools for Accurate Data
The quality of your financial data can make or break your LTV:CAC ratio. If your bookkeeping is behind or cost details are spread across multiple spreadsheets, your unit economics will suffer.
Tools like Lucid Financials can help bridge this gap. These platforms consolidate real-time bookkeeping and expense data, ensuring that CAC calculations - covering salaries, commissions, software, and overhead - are always current and directly tied to your profit and loss (P&L) statement. The table below highlights how accurate data transforms metrics from unreliable to actionable:
| Metric Pillar | Red Flag | Gold Standard |
|---|---|---|
| CAC Attribution | Only counting ad spend; ignoring salaries and tools | Fully loaded CAC tied to the P&L; includes adjustments for sales cycle lags |
| LTV Accuracy | Based on revenue; assumes zero churn | Based on gross margin; includes cohort-based churn with a 5-year cap |
| Payback Period | 18+ months; relies on upfront payments to hide burn | Under 12 months; reflects high capital efficiency |
| Gross Margin | Below 70%; excludes support and infrastructure costs | 80% or higher; accounts for defensible COGS and economies of scale |
Segment Your Metrics for Clearer Insights
Once your data is clean, take the next step: segment your metrics. Averages across your entire customer base can hide critical differences. Breaking down LTV and CAC by acquisition channel (e.g., organic search vs. paid campaigns), customer type (SMB vs. enterprise), or signup cohort provides a sharper view of your performance.
"The real power of the LTV/CAC ratio is when you segment it by cohort." - Jake Ballinger, FP&A Writer, Cube
Segmentation helps identify weaknesses that might otherwise be masked by high-performing areas. For example, a paid channel might look effective on the surface, but when segmented, it could reveal a high CAC compared to organic channels. These insights are essential for refining strategies and allocating resources wisely.
Turn Metrics Into Decisions
Segmented LTV and CAC metrics aren't just numbers - they're tools for decision-making. For instance, you can model how hiring a new salesperson might impact your payback period and cash flow. Or, before increasing a paid channel's budget, run scenarios to see how even small changes in gross margin could shift your LTV:CAC ratio.
The ultimate goal is to make these metrics dynamic, updating regularly to reflect your business's pace. For fast-moving startups, recalculating LTV and CAC weekly can offer real-time insights into where to invest, where to cut back, and when to scale up. These metrics, when properly managed, become the foundation for smarter, faster growth decisions.
Conclusion: Getting LTV and CAC Right
Understanding and calculating LTV and CAC accurately is crucial to avoid common pitfalls that can skew your metrics. For instance, focusing only on ad spend can underestimate CAC by 2–3x, while using revenue instead of gross margin can inflate LTV by 20–40%. These missteps can throw off your ratio and impact decision-making.
While a 3:1 LTV:CAC ratio is often seen as the baseline for long-term viability, top-performing companies push much further, achieving ratios of 7:1 to 9:1 through strategies like improving net revenue retention. These differences underscore why precision is so important.
"LTV:CAC is not a marketing metric. It is the single integrated diagnostic for the entire customer lifecycle - acquisition efficiency, activation quality, retention durability, and expansion velocity." - Peter Vogel, Founder, peppereffect
Even with well-segmented metrics, the foundation lies in accurate financial data. Tools like Lucid Financials can help ensure your books are in order, your costs are fully accounted for, and your reporting meets investor expectations. When your calculations reflect true margins and retention data, these metrics evolve from simple tracking tools into actionable insights that drive growth. This highlights the value of integrating reliable data into every aspect of your financial strategy.
FAQs
What should I do if I don’t have enough retention data to trust my LTV?
If you don’t have enough retention data to confidently rely on your LTV, shift your attention to short-term metrics like the payback period. Early-stage startups often struggle with LTV due to factors like high churn rates and limited sample sizes. By focusing on the payback period - ideally within the range of 14 to 18 months - you can get a better sense of whether your CAC is manageable while working toward collecting sufficient data for a more precise LTV calculation.
How do I calculate a fully loaded CAC for my business?
To figure out a fully loaded Customer Acquisition Cost (CAC), you need to account for all sales and marketing expenses related to bringing in new customers - not just the obvious ones. This means including salaries, advertising spend, commissions, software tools, and even overhead costs for a specific time frame. Once you've totaled these expenses, divide that number by the total number of new customers acquired in the same period.
Formula:
Fully loaded CAC = Total sales & marketing expenses ÷ Number of new customers acquired
What’s a good CAC payback period for a startup?
A solid CAC payback period for a startup is generally 12 months or less. This means the company can recoup its customer acquisition costs within a year, which helps maintain healthier cash flow and supports growth. If the payback period stretches beyond this, it might signal cash flow issues or inefficiencies in operations. On the other hand, a shorter payback period suggests the business has more effective strategies for acquiring and retaining customers.