Your board doesn’t want to sift through endless spreadsheets - they want clear, actionable insights. Generic reports fail to answer critical questions like: Are we on track? What are the risks? Do we have enough cash? Custom reports bridge this gap by focusing on key metrics, trends, and forecasts that align with your board’s priorities.
Key Takeaways:
- Focus on What Matters: Highlight essential metrics like runway, burn rate, LTV:CAC, and NRR.
- Keep It Clear and Concise: A professional report should be 15–25 pages with a 1–2 page executive summary.
- Use Visuals Wisely: Include simple charts (line, bar, waterfall) with one-sentence takeaways.
- Tailor to Your Audience: Align reports with your board’s expertise (e.g., VCs prioritize growth; ex-CFOs focus on margins).
- Be Consistent: Stick to the same metrics, formats, and definitions month-to-month.
Action Steps:
- Define 8–12 KPIs that reflect your business goals.
- Automate reporting with tools that sync live data from sources like Stripe or payroll systems.
- Send reports 3–5 days before the meeting to allow for review.
- Always provide context and recommendations for any variances or risks.
Custom reports don’t just inform - they drive better decisions, build trust, and help secure funding.
How to Build a KILLER Financial Dashboard (Free Template)
sbb-itb-17e8ec9
What to Include in a Board Report
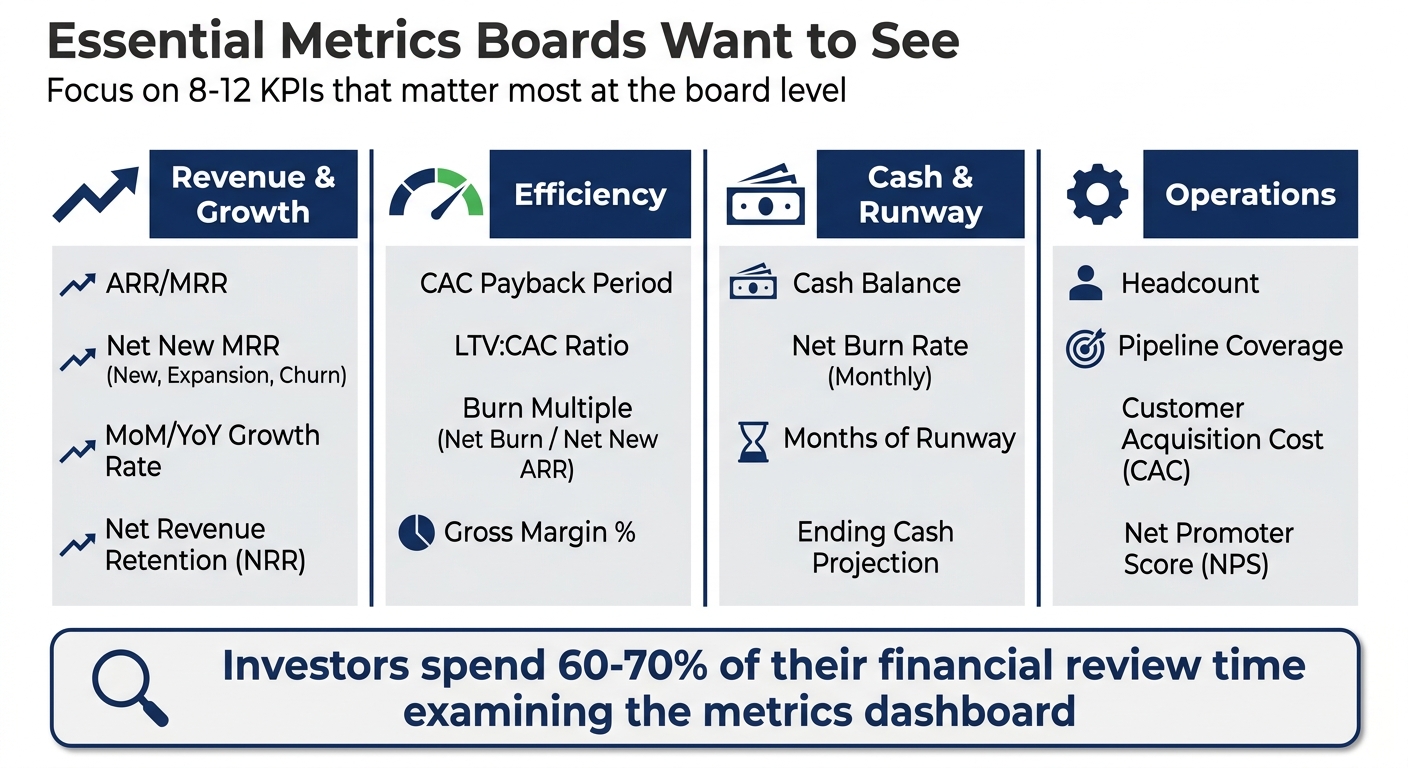
Essential Board Report Metrics by Category: Revenue, Efficiency, Cash & Operations
A professional board report typically spans 15–25 pages, broken down into specific sections: a 1–2 page executive summary, a 3–5 page financial review, a 2–3 page operational update, and a 1–2 page forward-looking strategic segment. This format ensures board members can quickly locate key information without unnecessary complexity.
The executive summary should address the most pressing questions: Is the business on track? What are the risks? Is there sufficient cash? Include a "Decisions Required" section at the top to highlight critical items for discussion during the meeting.
Metrics Boards Want to See
Focus on 8–12 key performance indicators (KPIs) that matter most at the board level. Investors typically spend 60–70% of their financial review time examining the metrics dashboard. Here's a breakdown of essential metrics by category:
| Category | Essential Metrics |
|---|---|
| Revenue & Growth | ARR/MRR, Net New MRR (New, Expansion, Churn), MoM/YoY Growth Rate, Net Revenue Retention (NRR) |
| Efficiency | CAC Payback Period, LTV:CAC Ratio, Burn Multiple (Net Burn / Net New ARR), Gross Margin % |
| Cash & Runway | Cash Balance, Net Burn Rate (Monthly), Months of Runway, Ending Cash Projection |
| Operations | Headcount, Pipeline Coverage, Customer Acquisition Cost (CAC), Net Promoter Score (NPS) |
Each metric should pass the "So What?" test - include a brief explanation of why the data matters and the actions being taken. For example, if NRR drops from 118% to 112%, explain: "This decline follows three enterprise downgrades due to feature gaps; corrective actions are underway for Q3".
Also, include a Budget vs. Actual comparison. Variances greater than 10–15% require specific commentary. For instance, if revenue was projected at $500,000 but came in at $425,000, explain whether the shortfall was caused by delayed deals, higher churn, or slower ramp times - and outline the steps being taken to address it.
How to Organize Your Report
A well-organized report ensures clarity and efficiency:
- Start with a traffic light dashboard (Red/Amber/Green) summarizing performance against defined thresholds. For example, mark runway as green if it's above 12 months, amber for 6–12 months, and red for less than 6 months.
- Follow with a 3–5 page financial review that includes a P&L with variance analysis, a cash flow summary, and highlights from the balance sheet. Move detailed data tables and department-level breakdowns to an appendix.
Your operational review (2–3 pages) should focus on the sales pipeline, customer success metrics like NRR and churn, and progress on product milestones. The strategic initiatives section (2–3 pages) should track the company’s 3–5 major goals using RAG (Red/Amber/Green) indicators.
The forward-looking section is especially important. While 78% of investors consider updated forecasts "critical" or "very important", only 42% of startups consistently include them. Provide updated forecasts with scenario analysis (Base/Upside/Downside) and outline hiring plans for the next quarter.
Send the board pack 5–7 business days before the meeting to allow time for pre-reading. This ensures the meeting focuses on discussions and decisions, rather than presenting data. As Philipp Siegert, Fractional CFO & Strategy Advisor at Structure First, puts it:
"Consistency and punctuality are stronger trust signals than the content of any individual update."
Using Charts and Visuals
Board members spend an average of just 4 minutes reviewing the financial section of a board deck. Visuals should communicate insights instantly. Use the right chart for the right purpose:
- Line charts for trends over time (e.g., revenue growth, cash runway)
- Bar charts for comparisons (e.g., actual vs. budget)
- Waterfall charts for breaking down variances (e.g., MRR changes from new sales, expansion, contraction, and churn)
Avoid pie charts - they make comparisons harder. Skip 3D effects and dual y-axes, as they can distort data and confuse readers. Stick to a maximum of four colors per chart and always start the y-axis at zero for bar charts to ensure accurate proportions.
Every chart should include a one-sentence annotation explaining its takeaway. For example, instead of just showing a revenue trend, add: "Revenue grew 8% MoM due to three new enterprise contracts signed in March." This approach saves time and ensures board members immediately understand the data.
For cash runway charts, include a secondary line showing a "target fundraise" or "worst-case" scenario. This helps the board visualize potential outcomes and plan accordingly.
As Team culta emphasizes:
"The financial section should tell a story, not present a spreadsheet."
Consistency in chart styles, metric definitions, and time periods month-to-month is crucial. This lets the board track trends effectively and aligns your visuals with the report’s overall structure, ensuring impactful insights. With these components in place, you're ready to build custom reports step-by-step.
How to Build Custom Reports: Step-by-Step
Creating a custom board report doesn’t have to be a time drain. The difference between a quick 30-minute report and a grueling 10-hour one often comes down to having the right infrastructure in place. With the proper steps, you can consistently deliver accurate, board-ready reports without overloading your finance team.
Define What You Need to Report
Start by answering three key questions: Are we on track? Where are the risks? Do we have enough cash?. These questions will help you decide which metrics deserve a spot in your report and which can be relegated to an appendix.
Tailor your metrics based on your board’s priorities. For example, VC partners often focus on growth and burn rates, while former CFOs are likely to zero in on margins and working capital. Stick to 8–12 KPIs for growth-stage companies or 5–7 for seed-stage startups. Each metric should be immediately understandable - if it’s too complex, it doesn’t belong in the main report.
Set clear thresholds for your RAG (Red/Amber/Green) indicators to avoid subjective interpretations. For instance, categorize runway as green if it exceeds 12 months, amber for 6–12 months, and red for less than 6 months. Document these thresholds so everyone understands what triggers each status. Consistency is crucial - review past reports to ensure your metrics remain stable unless there’s a clear reason for change. Keep in mind that board members typically spend 4–6 hours reviewing materials before meetings, so unexplained changes can lead to confusion or mistrust.
By defining and focusing on relevant metrics, you can create concise and impactful reports. Once you’ve nailed down these metrics, it’s time to choose tools that can automate and streamline the reporting process.
Choose Your Reporting Tools
Your choice of tools can make or break the efficiency of your reporting process. The best tools connect directly to live data sources - like your bank accounts, Stripe, or payroll systems - so you can focus on analysis rather than manual data entry.
FP&A teams often spend up to 75% of their time on repetitive tasks like data cleansing and preparation. The right platform can eliminate this bottleneck. For example, Lucid Financials uses AI-powered automation to generate board-ready reports and forecasts with just one click. It even integrates with Slack, enabling instant answers to questions such as "What’s our current runway?" or "How does this month’s burn compare to the plan?"
Look for tools that automate data integration from essential sources like your operating bank, revenue processor, and payroll provider. Standardized templates can further streamline the process, with KPI dashboards and P&L summaries auto-populated, leaving room only for qualitative commentary. Select tools with effective visualization options - line charts for trends, bar charts for comparisons, and waterfall charts for variance analysis. Avoid flashy features like pie charts, 3D effects, or animations; they can obscure data and look outdated. Every chart should have a one-sentence annotation highlighting its key takeaway, such as, "Revenue grew 8% QoQ due to enterprise sales".
For scenario planning, opt for tools that make reforecasting simple. This allows you to present different scenarios, such as a "Company Plan" versus a "Board Plan", showcasing your preparedness for various outcomes. Once your tools are in place, ensure they’re accurately syncing and updating your data.
Check Your Report for Accuracy
Accuracy is non-negotiable. Before sending out your board pack, conduct a thorough cross-check: ensure that the MRR in your KPI dashboard matches the revenue in your P&L, and that the cash balance aligns with your latest bank statement.
Investigate anomalies, like unexpected MRR spikes (e.g., 40% MoM), to confirm whether they’re legitimate business events or errors. If you’ve updated how a metric is calculated, restate prior months’ data using the new formula to maintain consistent comparisons.
Have experts review their respective sections - accountants for financial statements, FP&A teams for forecasting assumptions, and the CFO for overall alignment with the company’s narrative. As Cube Software puts it:
"The CFO is the 'no surprises' role. As the gatekeeper of the company's finances, you need to be intimately familiar with everything on your financial statements."
Accurate data builds trust and empowers strategic decision-making. Send your board pack 3–5 days before the meeting (or at least 48 hours in advance). This gives board members time to prepare thoughtful questions, ensuring meetings focus on strategy rather than basic data review. If you’re reporting bad news or missed targets, always include a plan to address the issue, explaining the cause and outlining specific actions being taken. Lastly, double-check that your live data syncs have been updated within the past 24 hours. Outdated data can undermine even the most polished presentation.
Best Practices for Board Reporting
Make Reports Easy to Read
Board members typically spend 4–6 hours reviewing materials before meetings. To respect their time and ensure clarity, keep your board pack between 15–25 pages, with an executive summary that’s just 1–2 pages. This summary should directly address critical questions like: Are we on track? Where are the risks? Do we have enough cash?
Use a clear visual hierarchy to make information easier to digest. Incorporate bullet points, headings, and RAG (Red/Amber/Green) indicators to highlight key points. Avoid cluttered visuals like pie charts, 3D effects, or charts with more than four colors. Instead, opt for line charts to show trends, bar charts for comparisons, and waterfall charts for variance analysis. Stick to a consistent report structure from quarter to quarter so board members can focus on trends without having to adjust to a new format each time.
Place the most important details - like financial headlines, key risks, and required decisions - at the beginning of your report. If a board vote is needed, include a clear "Board Action Required" section with your recommendation and its financial implications. As OnBoard aptly explains:
"A board report is a document that determines whether directors walk into a meeting ready to decide - or spend the first 20 minutes getting up to speed."
Match Metrics to Business Goals
Your board report should focus on metrics that align with your company’s strategic objectives. A concise set of 5–12 high-impact KPIs is ideal, tailored to reflect your company’s stage and priorities. For example, if growth is a key focus, include metrics like customer acquisition and revenue trends. For directors with a financial background, emphasize unit economics and cash efficiency.
Every piece of data should answer the "So What?" question. Numbers alone don’t tell the full story - add a clear narrative to explain why the data matters and what actions you plan to take. For instance, if pipeline coverage drops, don’t just report the decline. Explain the reasons behind it (e.g., slower enterprise deal cycles) and outline your plan to address the issue.
Consider your board’s composition when tailoring your report. Provide competitive insights and market share analysis for industry-savvy directors, while keeping detailed data tables in an appendix to maintain a focused narrative. Once your metrics are aligned with strategy, automating updates can ensure consistent and accurate reporting.
Automate Report Updates
Manual data preparation can eat up as much as 75% of a finance team’s time. Automation can drastically reduce this burden. By connecting your reporting tools to source systems like your ERP, CRM, bank accounts, or billing platforms (e.g., Stripe), you can eliminate manual entry and reduce errors.
Tools like Lucid Financials use AI-powered automation to create board-ready reports with a single click. These tools also provide real-time data via platforms like Slack, auto-populating KPI dashboards and P&L summaries. Tasks that once took over 10 hours can now be completed in just 30 minutes.
Even with automation, it’s important to verify the data. Take a few minutes to review auto-generated numbers for anomalies, like an unexpected 40% jump in MRR, before finalizing your commentary. Use a centralized semantic layer to define KPIs and business logic, ensuring consistency across all reports. Schedule reports at regular intervals - monthly or quarterly - to avoid the noise and fatigue caused by real-time updates. Finally, distribute reports securely through board portals with row-level security, rather than relying on email attachments.
Common Reporting Mistakes to Avoid
With your report complete, it's essential to sidestep common pitfalls that can weaken its effectiveness.
Including Too Much Data
Board members typically dedicate just 4–6 hours to reviewing materials. Overloading them with excessive data can dilute the report's purpose, making it harder to drive actionable decisions.
Stick to 8–12 key performance indicators (KPIs) that truly matter, rather than drowning the audience in dozens of metrics. As Grove FP puts it:
"If the chart requires two minutes of explanation, it is either the wrong chart type, too complex, or answering the wrong question."
Shift granular details - like department-specific tables, detailed financials, or raw data - to an appendix. The main report should focus on three pivotal questions: Are we on track? Where are the risks? Do we have enough cash? Annotate every chart or table with a brief note explaining its importance (e.g., "Revenue grew 8% due to enterprise sales").
Now, let’s move on to ensuring data consistency and reliability.
Using Inconsistent or Wrong Data
Inconsistent metrics or shifting KPI calculations can erode trust and confuse board members. To maintain credibility, standardize how data is calculated and presented across all reports. Document the methodology behind key recommendations to ensure clarity.
Follow the "no surprises" principle. As Christina Ross, CEO of Cube, explains:
"The CFO is the 'no surprises' role. As the gatekeeper of the company's finances, you need to be intimately familiar with everything on your financial statements."
When delivering difficult news, do so before the meeting. This builds trust and gives board members time to absorb the information.
Missing Context and Recommendations
Raw numbers without context turn a report into little more than a collection of charts and tables. Overwhelming the board with data without a clear narrative diminishes the report's value. Instead, focus on disciplined storytelling that ties financial data to the company's broader strategy.
For example, if pipeline coverage drops, explain the reasons behind it and propose a plan to address the issue. Pair any significant variances or risks with actionable solutions. If a board vote is required, be explicit about the decision needed and outline its financial impact.
As Deckary highlights:
"When 35% of board reports fail to include the actual survey questions or data sources behind their strategic recommendations, the problem is not data availability - it is reporting discipline."
Consider including a concise 1–2 page executive summary. Use this section to clarify whether the organization is on track, highlight major accomplishments, and flag critical risks. This approach positions the finance team as a strategic advisor, not just a data provider, ensuring the report aligns with company goals and the metrics outlined in this guide.
Conclusion
Key Takeaways
Custom board reporting improves communication with the board by addressing three essential questions: Are we on track? Where are the risks? Do we have enough cash?
The most effective reports focus on 8–12 key performance indicators (KPIs) that matter most, provide context for those numbers, and outline clear action plans. As Grove FP puts it:
"Numbers tell you what happened. The narrative tells you why it matters and what to do about it."
By integrating live data sources and automating report creation, finance teams can cut preparation time from hours down to about 30 minutes. This shift allows teams to spend more time on strategic analysis instead of data collection.
Consistency is another cornerstone of effective reporting. A well-organized board pack - typically 15–25 pages, including an executive summary, financial review, operational update, and forward-looking forecast - ensures board members can easily access the critical insights they need for every meeting. When paired with honest reporting and actionable recommendations, this approach positions finance teams as strategic advisors, not just data providers.
Use these principles to refine your board reporting process.
Next Steps
To implement these strategies, start by connecting your financial data sources - such as bank accounts, payroll systems, and revenue tools like Stripe. This eliminates manual data entry errors and ensures real-time accuracy. Then, establish a consistent reporting schedule, delivering your board pack 3–5 days before each meeting to give board members ample time for review.
Lucid Financials can simplify this entire process. Their AI-powered reporting platform produces investor-ready financials in just seven days. With features like Slack integration and real-time reporting, you can focus on delivering strategic insights while the platform handles data accuracy and report creation. Check out Lucid Financials to see how automation can turn your board reporting into a competitive edge.
FAQs
How do I choose KPIs my board will actually care about?
When selecting KPIs for your board, it's important to align them with the board's strategic priorities and core concerns. Boards typically focus on areas like tracking progress toward goals, identifying potential risks, and maintaining liquidity. To address these needs, spotlight metrics that offer a clear and actionable picture of the business.
Key metrics to consider include:
- Financial performance indicators: Revenue, gross margin, and EBITDA.
- Liquidity metrics: Cash position and related measures.
- Operational efficiency: Payment cycle metrics such as Days Payable Outstanding (DPO) and Days Sales Outstanding (DSO).
Keep the list concise - limit your KPIs to 15-20 metrics. To make the data more meaningful, include benchmarks and highlight trends over time. This approach provides valuable context and helps the board make well-informed decisions.
What’s the best way to set RAG (red/amber/green) thresholds?
Setting RAG thresholds works best when you define clear and measurable criteria for each color. Tie these thresholds directly to your KPIs or project metrics, ensuring they are specific and objective. This approach aligns your thresholds with your goals, making decision-making more straightforward and effective.
How can I automate a board pack without sacrificing accuracy?
To create a board pack that’s both automated and precise, start by linking live data sources like ERP systems or financial platforms. This ensures you’re working with real-time, dependable data. Automating essential tasks - like data reconciliation, variance explanations, and report generation - helps cut down on human errors. Additionally, standardizing report formats and setting up scheduled automated updates can keep your board packs consistent, reduce manual effort, and guarantee timely, accurate results.