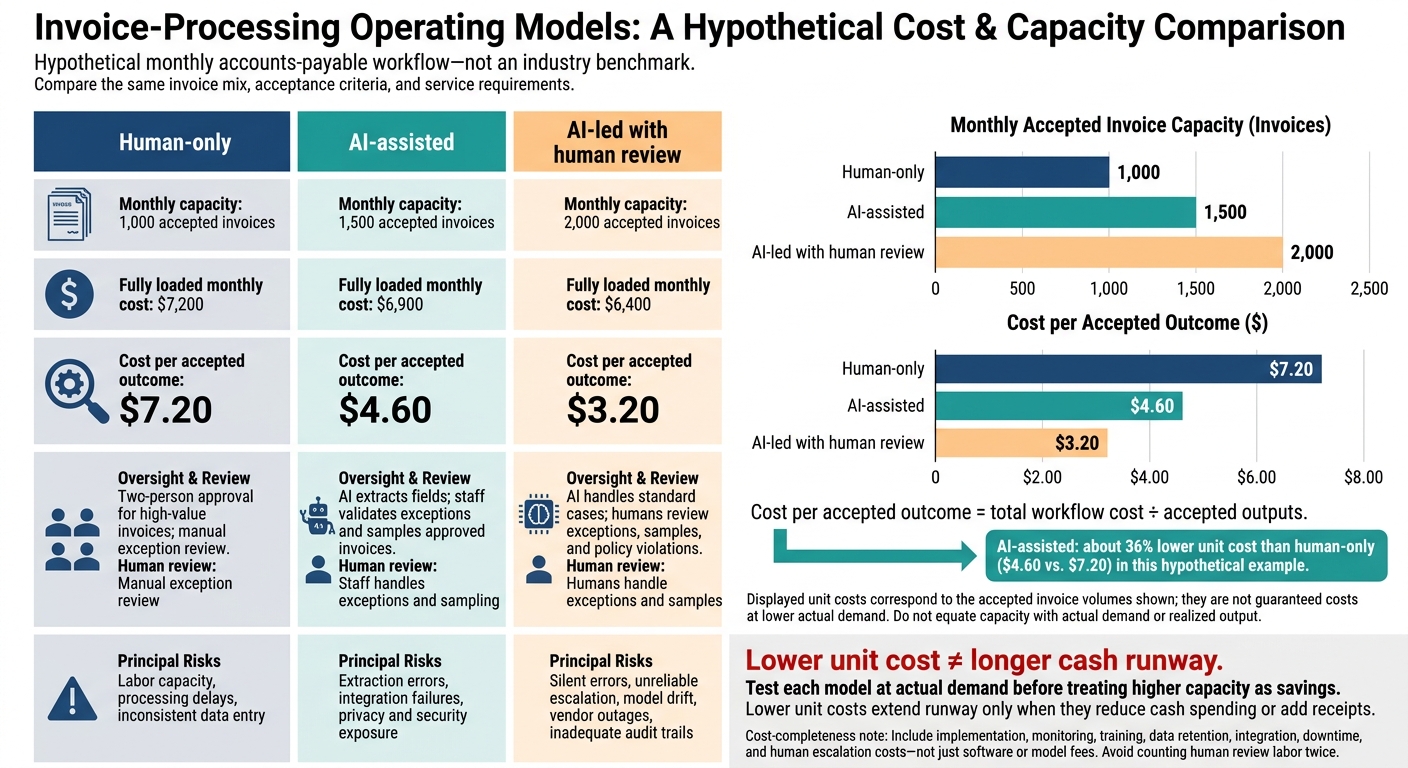
I judge AI savings by accepted work and cash left - not by the software bill alone. In this article’s hypothetical example, AI-assisted invoice processing costs $4.60 per accepted invoice versus $7.20 for human-only work: about 36% less. But that lower unit cost won’t extend your runway unless it reduces cash spending or adds receipts.
Here’s what I check before counting those savings:
- Total costs: Pay, benefits, hiring, AI setup, usage, maintenance, and human review - without counting review labor twice.
- Like-for-like benchmarks: Roles, company stage, location, workload, and quality standards, with shared costs assigned consistently.
- Accepted results: Completed work that meets your quality standard, plus review time, rework, and failures.
- Cash timing: When hiring and AI bills get paid, how adoption affects spending, and the first month cash drops below your reserve floor.
- Data and oversight: Reconciled records, dated assumptions, monthly updates, and privacy checks when patient information is involved.
My rule: test savings at actual demand, then <u>check the cash impact</u> before changing your hiring plan.
AI Benchmarks Are Shifting to Useful Work per Cost
sbb-itb-17e8ec9
Build a Fully Loaded Workforce Cost Baseline
Once you’ve recorded your assumptions, build the baseline using actual payroll, accounting records, bank feeds, and AI usage logs from the same monthly reporting period. Use direct connections where available.
Inventory Staff, Contractors, and AI Workflows
Keep a single roster of employees, contractors, open roles, and AI systems. Separate planned capacity from active spending. Map hiring dates, onboarding, and demand against available capacity - not just headcount.
Include the time people spend checking AI outputs. Your benchmark should account for that oversight work, too. Use this roster as the starting point for the loaded cost calculations below.
Calculate Fully Loaded Human and AI Costs
Include recurring and one-time costs in each category, and keep cash outflows separate from accounting expenses. Account for payroll taxes, benefits, onboarding, productivity ramp-up periods, AI setup, usage, maintenance, and human review of outputs and exceptions.
Use annual run rates for planning, but forecast hiring, usage, and one-time costs in the months they occur. For annual subscriptions, record the full payment in the payment month for cash planning. Spread the accounting expense over the service term.
Allocate Shared Costs Across Entities
Assign direct costs first. Then allocate shared management, software, and review costs using a documented driver, such as staff hours or workflow volume. Doing this now lets later benchmarks compare like-for-like units. When consolidating, redistribute shared costs only once.
Use the same allocation method for human and AI costs to keep comparisons consistent.
| Workforce type | Cost components | Data source |
|---|---|---|
| Staff | Base pay, employer payroll taxes, benefits, onboarding, productivity ramp-up | Payroll records, benefit bills, onboarding records, and ramp-up estimates |
| AI systems and workflows | Subscriptions, setup, usage, maintenance, human review | Invoices, usage logs, and review time |
Benchmark Pay, Capacity, and AI Costs
AI vs. Human Invoice Processing Costs
Choose Benchmark Data and Tools
Start with the loaded baseline from the prior section, then calibrate it against external market data.
Use BLS Occupational Employment and Wage Statistics (OEWS) to match pay by job duties, geography, and industry. Cross-check those figures against compensation surveys and recent hiring data. Record the exact field definitions used to put each source on the same basis. OEWS covers roughly 830 occupations, but use it only as a wage anchor. It does not price equity or full employment cost.
Use payroll and accounting records for actual internal costs, planning models for scenarios, and AI logs for workflow cost and quality. Have finance or operations review AI-generated title mappings, cost classifications, and scenario drafts.
| Data source or tool | Purpose | Key inputs | Limitations | Update frequency | Validation |
|---|---|---|---|---|---|
| Public wage data, such as BLS OEWS | Establish broad occupation and location ranges | SOC occupation, geography, industry, wage percentiles | May lag current hiring conditions; does not establish equity, benefits, or startup-specific premiums | Annually or when a new release is available | Confirm occupation duties, location, release date, and percentile |
| Compensation surveys | Benchmark startup-specific cash and equity practices | Company stage, size, industry, level, geography, cash, equity | Methods and samples vary; some data are self-reported or vendor-defined | Quarterly or semiannually | Check sample coverage, valuation date, level mapping, and inclusion of equity |
| Payroll and accounting systems | Calculate actual loaded labor cost | Wages, payroll taxes, benefits, bonuses, contractors, departments, entities | Coding errors and inconsistent allocations can distort results | Monthly close | Reconcile to the general ledger, payroll register, and headcount roster |
| Workforce planning models | Test hiring, attrition, capacity, and runway scenarios | FTEs, start dates, compensation, utilization, hiring timing, revenue assumptions | Forecasts are assumptions, not observed performance | Monthly and at each planning cycle | Compare prior forecasts with actual hires, costs, and output |
| AI usage and quality logs | Measure workflow-level AI cost and performance | Model calls, tokens or usage units, software seats, review time, failures, rework, accepted outputs | Usage volume is not productivity; vendor pricing and quality can change | Weekly workflow review and monthly close | Reconcile invoices, sample outputs, record acceptance, and review exceptions |
Set Pay Bands and Workforce Metrics
Define roles by responsibilities, decision scope, skills, and expected outcomes - not just internal titles. Match each role to a market occupation, choose a target percentile or salary midpoint, and document the policy. Set bands for base pay or broader compensation. Keep equity separate, with explicit assumptions for valuation, vesting, dilution, and equity grant renewals.
Track payroll share, fully loaded cost per employee or FTE, revenue per employee, gross profit per employee, and labor cost per accepted service unit. These benchmarks help guide hiring, automation, and runway decisions.
Keep denominators consistent. Specify whether headcount means period-end employees, average employees, or FTEs. Convert part-time hours into FTEs using the same method, and separate results by legal entity, location, and business unit.
With pay and capacity benchmarks in place, measure what those costs produce.
Measure Cost per Accepted Outcome
Cost per accepted outcome = total workflow cost ÷ accepted outputs.
Track completion, first-pass acceptance, rework, exceptions, turnaround time, and service quality. Keep pilot, production, and scaled assumptions separate. Pilots may carry unusually high setup and review costs. Production usage may stabilize, while scaled work may qualify for volume pricing or need added quality controls.
Calls, tokens, and seats measure consumption - not productive capacity. Compare operating models on the same workflow using the same acceptance standard.
Compare Human-Only and AI-Assisted Work
The table below is a hypothetical monthly accounts-payable workflow, not an industry benchmark.
Compare the same invoice mix, acceptance criteria, and service requirements.
Test each model at actual demand before treating higher capacity as savings.
Operating model Monthly capacity: accepted invoices Fully loaded monthly cost Quality controls and human review Human review Cost per accepted outcome Principal risks Human-only 1,000 $7,200 Two-person approval for high-value invoices; manual exception review Manual exception review $7.20 Labor capacity, processing delays, inconsistent data entry AI-assisted 1,500 $6,900 AI extracts fields; staff validates exceptions and samples approved invoices Staff handles exceptions and sampling $4.60 Extraction errors, integration failures, privacy and security exposure AI-led with human review 2,000 $6,400 AI handles standard cases; humans review exceptions, samples, and policy violations Humans handle exceptions and samples $3.20 Silent errors, unreliable escalation, model drift, vendor outages, inadequate audit trails
Include implementation, monitoring, training, data retention, integration, downtime, and human escalation costs - not just the model invoice or software subscription. Route low-confidence results, missing data, unusual transactions, safety-sensitive decisions, and system outages to an appropriately trained human.
When protected health information is involved, determine whether the startup is a covered entity or business associate, whether the vendor handles electronic protected health information, and whether a business associate agreement and security controls are required. HIPAA’s Security Rule requires regulated entities to implement workforce-security policies so personnel handling electronic protected health information have appropriate authorization, supervision, and access.
Forecast Cash Runway and Update Benchmarks
Model Hiring and Automation Scenarios
Use the loaded cost baseline and accepted-outcome benchmarks from the prior section to test how different staffing and automation plans affect runway.
Model changes in hiring timelines, AI productivity assumptions, and implementation start dates. Track their effects on cash runway, the reserve floor, and operating cash flow. Include loaded workforce costs, accepted output capacity, and review burden. For new hires, account for salary, benefits, onboarding expenses, and productivity ramp-up. For AI tools, include implementation time, data preparation, team training, and recurring usage costs.
Compare forecast ending cash with your reserve floor, and flag the first month cash falls below that floor. Use dashboards to monitor burn rate in real time, with alerts when spending patterns threaten runway. Feed monthly actuals from bank, payroll, and accounting systems into the forecast.
Change one assumption at a time to isolate its cash impact. Update each scenario monthly using actual results.
Scenario Headcount Recurring AI cost Loaded workforce cost Monthly net cash burn Runway Accepted output capacity Key assumption Approved hiring Scheduled hires Planned usage Include salary, benefits, and onboarding Rises as hires start, before added receipts Baseline against reserve floor Allow for ramp-up Hires start on schedule Hiring freeze No new hires Current usage Existing payroll Lower if receipts hold Extends if receipts hold Handle demand with the current team Demand stays within current capacity Faster growth Earlier hires Higher usage Add salary, benefits, and onboarding Rises until added receipts offset spending Shortens unless receipts offset earlier spending Match higher demand Higher demand supports the added spend Delayed hires, higher AI usage Deferred hires Added usage Current payroll plus AI and oversight costs Falls if deferred payroll exceeds added AI costs Extends if net cash savings hold Validate added capacity AI productivity gains offset the delay Staff redeployed to other workflows Unchanged Workflow-dependent Existing payroll Falls only if redeployment avoids spending or adds receipts Unchanged without a cash benefit Shift capacity between teams Staff can move to new work Increased AI usage As planned Higher volume Include oversight Rises unless added receipts offset usage costs Shortens without an offsetting cash benefit Measure accepted output Usage stays within plan Lower adoption, more review Retain needed staff Actual usage Add review time Rises if retained staff or review adds cash costs Shortens if cash costs exceed plan Reduce expected gains Adoption or quality falls short
Assign clear owners to maintain the forecast, validate AI-generated outputs against historical performance, and update assumptions when hiring, AI usage, pricing, or implementation timing changes.
Conclusion: Check Costs, Outcomes, and Cash Impact
Link loaded costs, benchmarks, and validated AI outputs to accepted outcomes and cash payments. After each close, reconcile forecast cash with actuals, including implementation and recurring AI costs. Update the model whenever hiring, compensation, headcount, AI usage or pricing, or implementation assumptions change.
FAQs
How much data do I need to validate AI savings?
Data quality matters more than volume when validating AI savings. Start with accurate, standardized, clean data. Scattered or inconsistent financial records can lead AI to amplify bad assumptions.
Aim for 12 to 24 months of historical financial data, including revenue, expenses, headcount, and customer metrics. Connect data from accounting, payroll, CRM, and banking systems to get a complete, real-time picture.
When should I automate instead of hiring?
Automate repetitive, rule-based, or data-heavy tasks so your team can focus on planning and decisions. If your team can handle the workload - or AI tools can fill the gap - automation is often the lower-cost option. Hire when the work calls for human judgment, empathy, or complex problem-solving that technology can’t match.
Before committing, use AI-powered scenario modeling to assess cash flow and runway. Set revenue milestones or runway thresholds to help decide when to hire.
How do I forecast savings when AI quality varies?
Put data integrity and human oversight first. Audit financial and HRIS records to ensure the data is standardized, complete, and free of errors. This helps reduce inaccurate AI predictions.
Model best-case, worst-case, and actual outcomes to see how hiring plans affect burn rate and runway. Ask for confidence ranges, not single estimates. Check projections against past performance and industry benchmarks. Have people review them regularly and adjust for anomalies or market shifts outside the model’s training data.