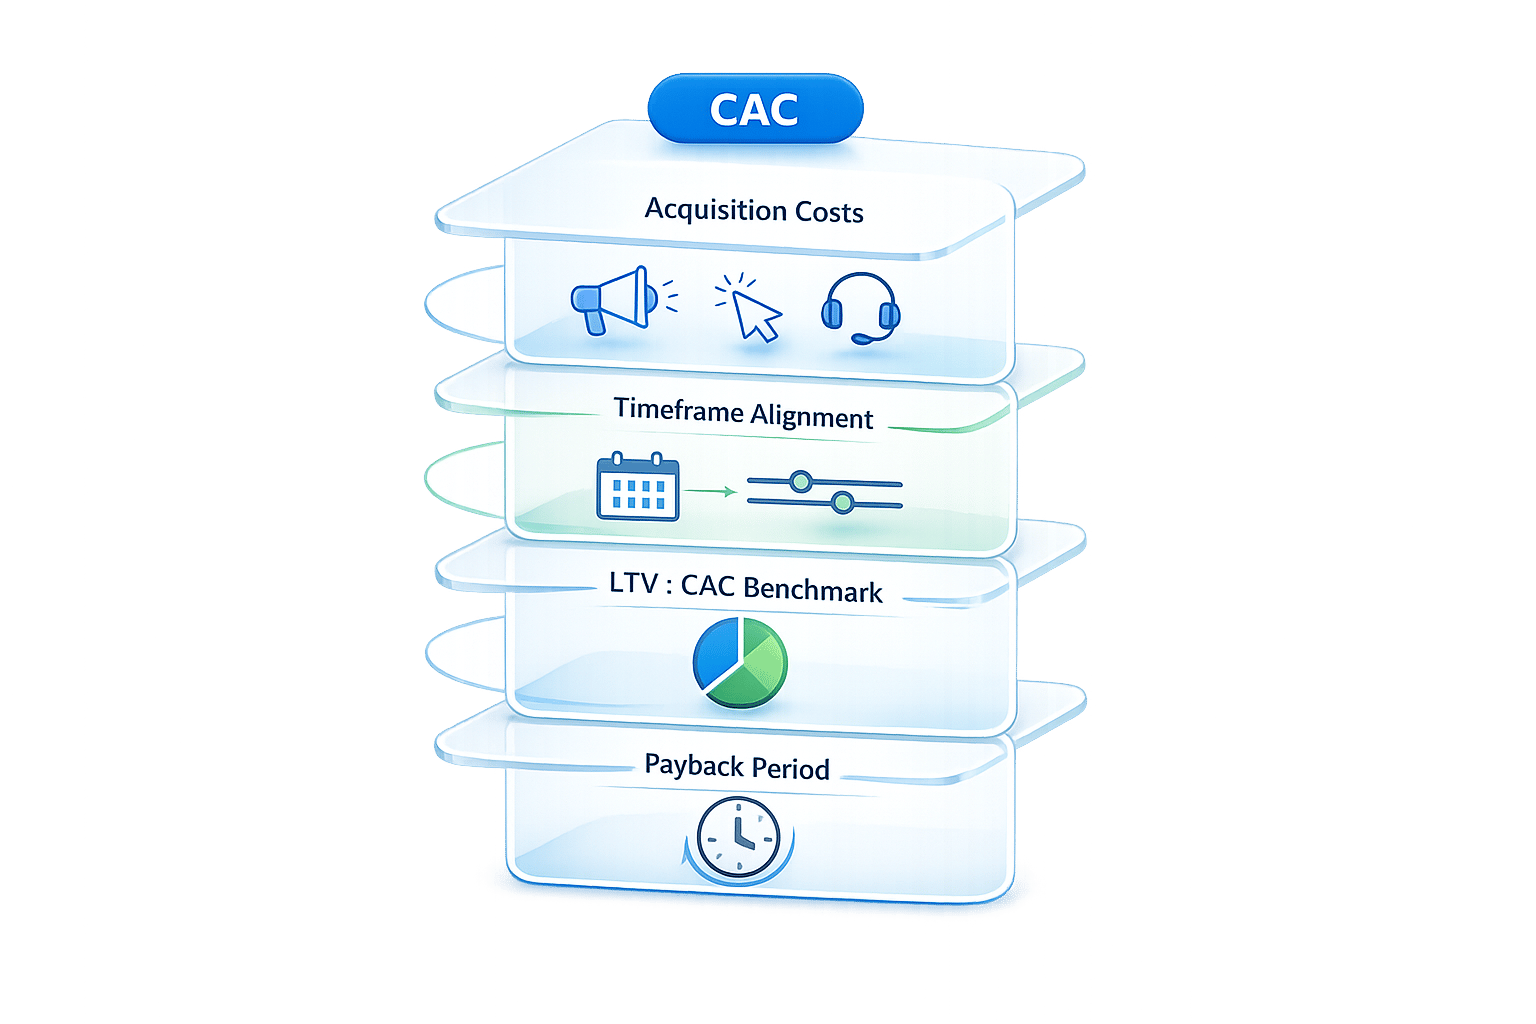
AI budget sensitivity analysis helps startups manage financial uncertainty by simulating how changes in key variables like customer acquisition cost (CAC) or churn rate impact metrics such as cash runway, profitability, and growth. Traditional methods rely on manual spreadsheets, but AI tools automate this process, providing faster, more accurate insights.
Key takeaways:
- What it does: Adjusts inputs (e.g., CAC, churn) to test their impact on financial outcomes.
- Why it matters: Startups face tight margins, and even small changes in metrics can significantly affect cash runway or revenue.
- How AI helps: Automates testing, integrates live data, and accounts for variable interactions using tools like Monte Carlo simulations.
- Benefits: Reduces planning time by 50%, improves forecasting accuracy, and identifies risks early.
The Basics of Budget Sensitivity Analysis
Key Inputs and Outputs in Startup Financial Models
Budget sensitivity analysis is only as good as the data it uses. For startups, the main inputs typically fall into four categories: growth drivers (like monthly recurring revenue growth rate, conversion rates, and sales cycle length), retention metrics (such as churn rate and Net Dollar Retention or NDR), efficiency levers (customer acquisition cost and gross margin), and operational costs (headcount, hiring pace, and payroll load).
The outputs, on the other hand, include metrics like cash runway, monthly burn rate, CAC payback period, and months to profitability. These numbers reveal whether your business is financially stable or heading toward a cash shortfall.
| Input Category | Key Variables | Impacted Outputs |
|---|---|---|
| Growth Drivers | MRR growth rate, conversion rate, sales cycle length | Revenue trajectory, fundraising timing |
| Retention Metrics | Gross churn, Net Dollar Retention (NDR) | Revenue stability, LTV, runway |
| Efficiency Levers | CAC, gross margin % | Burn rate, cash consumption |
| Operational Costs | Headcount plan, hiring pace, payroll load | Operating expenses, runway |
For SaaS startups, the MRR growth rate is often the most important factor, followed by churn and customer acquisition costs (CAC). For example, in a $5M ARR company with $2M in cash, the difference between optimistic and pessimistic scenarios could mean a 15-month difference in cash runway.
With these inputs and outputs in mind, let’s explore how manual sensitivity analysis tackles these variables.
How Manual Sensitivity Analysis Works
Before automation tools became common, startups relied on manual methods to test the impact of changing variables. The most widely used manual method, called One-at-a-Time (OAT) analysis, involves adjusting one input at a time while keeping the rest constant. This allows you to see how a single change affects key outputs. For example, you might increase CAC by 10% and observe how it impacts cash runway before resetting and testing another input.
This manual process typically starts with a centralized assumptions tab - a single dashboard that consolidates all key inputs. A simple scenario selector (e.g., assigning 1 for Worst, 2 for Base, or 3 for Best) can help toggle between different cases quickly using functions like CHOOSE or IFS. This approach avoids hard-coded numbers, making it easier to switch scenarios without errors.
Best Practices for Effective Sensitivity Analysis
While manual techniques are useful, following certain best practices can make your sensitivity analysis more effective and focused on what truly matters.
One common mistake is testing too many variables at once. In most business models, only 3–5 variables account for the majority of outcome variance - often as much as 80%. For early-stage SaaS companies, changes in acquisition rate and NDR alone can explain up to 80% of revenue fluctuations.
Another pitfall is using uniform ranges, like ±10%, for all variables. Instead, base your test ranges on historical data or market benchmarks. This ensures that each variable’s range reflects its actual risk profile. Additionally, don’t test variables in isolation if they tend to move together. For instance, a longer sales cycle often leads to higher CAC and lower conversion rates. Testing these factors separately might underestimate the combined risk.
"A founder should be able to say, with confidence, that if CAC rises by twenty percent and churn rises by one point, the runway falls by four months and the next raise needs to happen earlier." - Amanda Breen, Senior Features Writer, Startupinsides.com
Finally, assign responsibility for each key assumption to a specific leader on your team. Aleksandar Stojanovic, CEO & Founder of Fiscallion, explains: "Ownership isn't about accountability for the result. It's about accountability for the signal." This means that when metrics like churn start to shift, someone is monitoring and addressing the issue before it becomes a major financial problem.
sbb-itb-17e8ec9
How AI-Powered Budget Sensitivity Analysis Works
Data Integration and Preparation
AI-powered sensitivity analysis starts by pulling in clean, connected data, making financial planning more efficient. Tools like Lucid Financials integrate directly with accounting and payroll systems, automatically importing live data. This eliminates the hassle of manually entering numbers into spreadsheets and reduces the risk of outdated information affecting your financial models.
Instead of running a one-time analysis, AI platforms conduct rolling monthly reviews, continuously updating assumptions with the latest data. This transforms your financial model into a dynamic tool that evolves over time, rather than a static report revisited quarterly. With this constantly refreshed data, your analysis becomes more accurate and actionable.
AI Modeling and Driver Analysis
Once the data is ready, AI pinpoints the variables that have the biggest impact on outcomes. Using techniques like regression analysis and simulations, it prioritizes financial drivers based on their influence on metrics like cash flow or EBITDA. The results are often visualized in a tornado chart, which highlights the variables that cause the most significant changes in financial performance. This level of clarity paves the way for automated scenario testing.
What sets AI apart is its ability to account for interaction effects - how variables influence each other. For instance, a price reduction might boost sales volume, or wage inflation could coincide with labor shortages. Traditional one-variable analysis often misses these complex relationships.
"Sensitivity analysis is the prerequisite for scenario analysis - driver selection depends on knowing which variables have the highest sensitivity." - Onetribe Advisory
A good practice is to focus on 5–8 key drivers that cover revenue, costs, and timing. Testing every single budget line item can overwhelm decision-makers and obscure the most critical factors.
Automated What-If Scenarios and Simulations
Once the key drivers are identified, AI automates scenario testing, eliminating the need for manual adjustments. It sets realistic ranges based on historical data and market benchmarks, avoiding arbitrary assumptions. For example, variables like churn and sales volume are analyzed using historical trends and cohort performance.
For deeper insights, AI employs techniques like Monte Carlo simulations, which run thousands of randomized combinations of key inputs. This creates a probability distribution of outcomes, providing a clearer picture of potential risks and opportunities. For instance, a seemingly small 1% monthly increase in churn could result in a 12% annual revenue loss for a SaaS company.
Here’s a quick breakdown of sensitivity levels and their applications:
| Sensitivity Level | Method | Primary Use Case |
|---|---|---|
| Level 1 | One-variable (Tornado Charts) | Identifying which single assumptions pose the most financial risk |
| Level 2 | Two-variable (Data Tables) | Examining how variables interact (e.g., price vs. volume) |
| Level 3 | Break-even Sensitivity | Detecting early warning signs for cash shortages or covenant breaches |
AI-Powered Budgeting: A Practical Guide
Step-by-Step: Running AI Budget Sensitivity Analysis
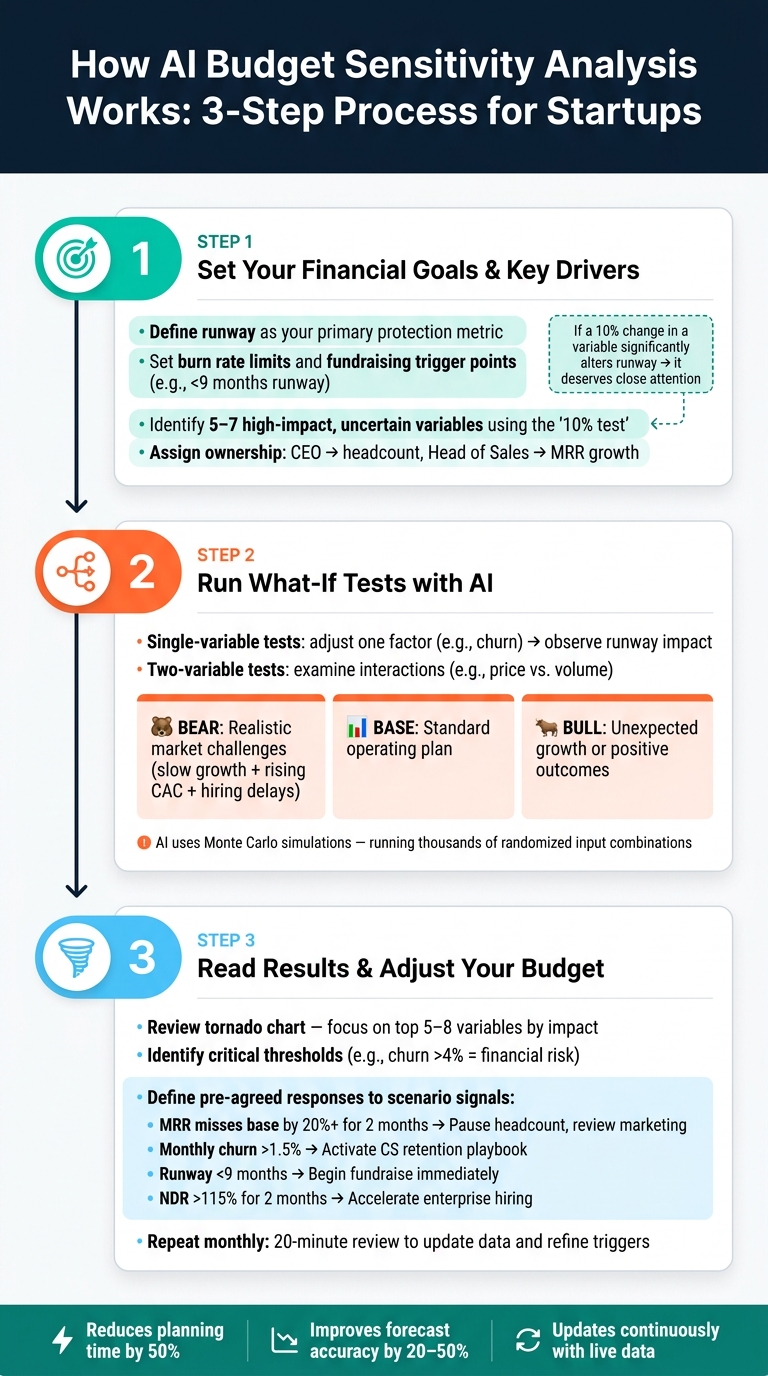
How AI Budget Sensitivity Analysis Works: 3-Step Process for Startups
Set Your Financial Goals and Key Drivers
Start by defining your financial protection goals. A key metric to focus on is runway, which indicates how long your business can operate before reaching a critical milestone or needing additional funding. Once you’ve set this, determine an acceptable burn rate and establish a clear trigger point - like deciding to initiate fundraising when your runway dips below nine months.
With your goals in place, identify 5–7 variables that are both impactful and uncertain. Use the "10% test" to evaluate these variables: if a 10% change in a factor (e.g., churn rate or hosting costs) significantly alters your runway, then it’s worth close attention.
Assign ownership of these key drivers to specific team members. For example, the CEO might take charge of headcount, while the Head of Sales monitors MRR growth. Aleksandar Stojanovic, CEO & Founder of Fiscallion, explains:
"Ownership isn't about accountability for the result. It's about accountability for the signal."
Once you’ve clarified your goals and assigned responsibilities, you’re ready to simulate scenarios using AI.
Run What-If Tests with AI
With your key drivers identified, AI can simplify scenario testing. Start with single-variable tests - adjust one factor, like churn, and observe its effect on runway. This helps you pinpoint which variables have the most influence. Afterward, test combinations of two variables, such as price and volume, to understand their interaction.
Next, build three core scenarios: Bear, Base, and Bull.
- Bear: Reflects realistic market challenges - not catastrophic, but a plausible shortfall.
- Base: Represents your standard operating plan.
- Bull: Captures opportunities from unexpected growth or positive outcomes.
Sticking to these three scenarios keeps things manageable and avoids overcomplicating the decision-making process. In Bear scenarios, adjust related inputs together - for example, slow growth, hiring delays, and rising CAC - to better reflect potential risks.
Read the Results and Adjust Your Budget
Once your tests are complete, analyze the results to guide budget adjustments. Start by reviewing a tornado chart, which ranks your variables based on their impact on metrics like runway or EBITDA. Focus on the top five to eight variables that have the most influence, and ignore less relevant factors.
Identify critical thresholds where your financial stability could be at risk. For instance, if your analysis shows that churn exceeding 4% would jeopardize the business, that figure becomes a key guardrail. Use these thresholds to define pre-planned responses:
| Scenario Signal | Trigger | Pre-Agreed Response |
|---|---|---|
| Toward Bear | MRR growth misses base by 20%+ for 2 months | Pause open headcount; review marketing spend |
| Toward Bear | Monthly churn exceeds 1.5% | Activate CS retention playbook; escalate to CEO |
| At Bear | Runway drops below 9 months | Begin fundraise process immediately |
| Toward Bull | NDR exceeds 115% for 2 months | Accelerate enterprise motion; approve next hiring tranche |
Make this sensitivity analysis a recurring process rather than a one-time event. Dedicate 20 minutes each month to updating your data, re-running scenarios, and refining your triggers to stay aligned with your goals.
How Startups Can Use AI Budget Sensitivity Analysis
Use Cases in Startup Financial Planning
Startups are increasingly turning to AI to take their financial planning to the next level. By building on traditional manual sensitivity analysis, AI-powered tools make forecasting more actionable and dynamic. Founders can now simulate changes in key metrics - like customer acquisition costs or conversion rates - to test how these shifts impact their financial runway. This means they can evaluate decisions like hiring plans or pricing adjustments with greater confidence. For example, AI can model how even a 1% increase in churn could affect long-term revenue and customer lifetime value, helping startups anticipate risks and make smarter, data-backed decisions.
These tools demonstrate how AI can simplify complex financial scenarios, giving startups a clearer path to stability and growth.
Benefits of AI-Powered Sensitivity Analysis
AI doesn’t just speed up the process - it transforms it. Tasks that used to take hours can now be completed in seconds, allowing startups to update their models monthly with fresh data. This approach not only increases efficiency but also reduces errors in multi-variable scenarios. AI can identify risks that might go unnoticed in manual analysis, such as the combined impact of rising customer acquisition costs, longer sales cycles, and declining conversion rates - all of which could deplete runway faster than expected.
Amanda Breen, Senior Features Writer at Startupinsides.com, explains it well:
"Sensitivity analysis gives that risk a number, a timeline, and a response path."
For U.S.-based startups, this capability is especially valuable when managing investor relations. Real-time, investor-ready reports make a strong impression during board meetings or fundraising rounds, showcasing a startup’s ability to adapt and plan effectively.
But the real power of AI lies in its ability to turn insights into actionable strategies.
Turning Insights into Decisions
Insights are only valuable if they lead to action. Platforms like Lucid Financials are designed to make that leap easier for startups. With its CFO support tier, Lucid offers tools like AI-driven what-if scenario modeling, improved visibility into cash flow and runway, and board-ready reports - all integrated into platforms like Slack. Founders can ask straightforward questions about their burn rate or runway and get instant, data-driven answers without waiting for monthly financial updates.
This makes financial planning a continuous process, allowing startups to pivot quickly as conditions change. The goal is to empower founders to make informed decisions in real time, ensuring their business remains agile and resilient.
Conclusion: Why AI Makes Budget Sensitivity Analysis Better
Key Takeaways for Startup Founders
AI-driven sensitivity analysis transforms how startups navigate financial uncertainty. It speeds up decision-making while pinpointing the variables that truly impact your business - whether it's churn, customer acquisition costs, or payroll growth.
Traditional spreadsheets can only handle a handful of scenarios, but AI can evaluate hundreds, uncovering risks you might miss and automatically updating forecasts with real-time data. According to McKinsey, businesses using AI for forecasting and budgeting have seen error reductions of 20–50%, giving startups with small finance teams a much-needed advantage.
AI won't replace your financial instincts - it enhances them. By simplifying complex scenarios, it delivers clear, actionable insights faster than manual processes ever could. These insights can help you fine-tune your financial strategy and make smarter decisions as you embrace AI-powered budgeting.
Next Steps for Getting Started
To start leveraging AI for sensitivity analysis, focus on two or three key drivers that matter most to your business, such as MRR growth, churn rate, or hiring pace. Run targeted what-if scenarios - like comparing a baseline forecast to a downside case (e.g., revenue dropping 10% or churn increasing by 2%). Observe how these changes impact your cash runway. Start small to build confidence, then broaden your scope as you go.
If building your own system feels daunting, platforms like Lucid Financials simplify the process. They offer AI-powered scenario modeling, cash flow tracking, and investor-ready reporting - all accessible in real time through tools like Slack. It’s an efficient way for U.S.-based startups to harness AI without needing a full-scale finance team.
FAQs
What data do I need to run AI budget sensitivity analysis?
To conduct an AI-driven budget sensitivity analysis, you'll need 12–24 months of historical financial data. This includes details like revenue, expenses, headcount, and customer metrics. For the most accurate results, integrate real-time data sources such as accounting software, CRM platforms, bank accounts, and payroll systems. Incorporating external benchmarks and market trends can further refine the analysis. Tools like Lucid Financials streamline this process by automating data collection and highlighting the critical factors that influence your financial standing.
How does AI handle linked drivers like CAC, conversion rate, and sales cycle length?
AI analyzes the connections between critical factors such as customer acquisition cost (CAC), conversion rates, and sales cycle length to illustrate their effect on financial results. By incorporating real-time data, it visualizes how shifts in one metric can impact your budget, cash flow, and overall runway. Tools like Lucid Financials take this further by simulating "what-if" scenarios, instantly updating forecasts to help startups see how specific changes affect their business's financial health.
How do I turn sensitivity results into clear triggers and budget actions?
To make sensitivity results practical, focus on critical metrics like customer churn or revenue growth that directly affect your financial health. Define clear thresholds - like a churn rate exceeding 10% or revenue dropping below $50,000 - that will prompt immediate action. Lucid Financials keeps a close watch on these metrics in real time, delivering automated alerts so you can swiftly activate contingency plans and respond effectively.