To improve AI churn predictions, I start with clean data and customer behavior - not a more complex model. I use only information available before each prediction, then test whether the scores match actual customer departures.
Here’s what I check before using those scores to guide spending:
- Data: Define churn, connect customer records, and keep future information out of training.
- Models: Compare simple baselines, boosting, and ensembles using the same test data.
- Results: Check precision, recall, and whether predicted risks match actual churn rates - not accuracy alone.
- Timing: Test on later customer records and wait for the prediction period to end.
- Business impact: Weight risk by revenue and test whether outreach retains enough revenue to cover its cost.
My rule: <u>a churn score is an estimate, not a promise</u>. It can help you plan retention budgets and runway - but predicting who will leave is not the same as proving you can persuade them to stay.
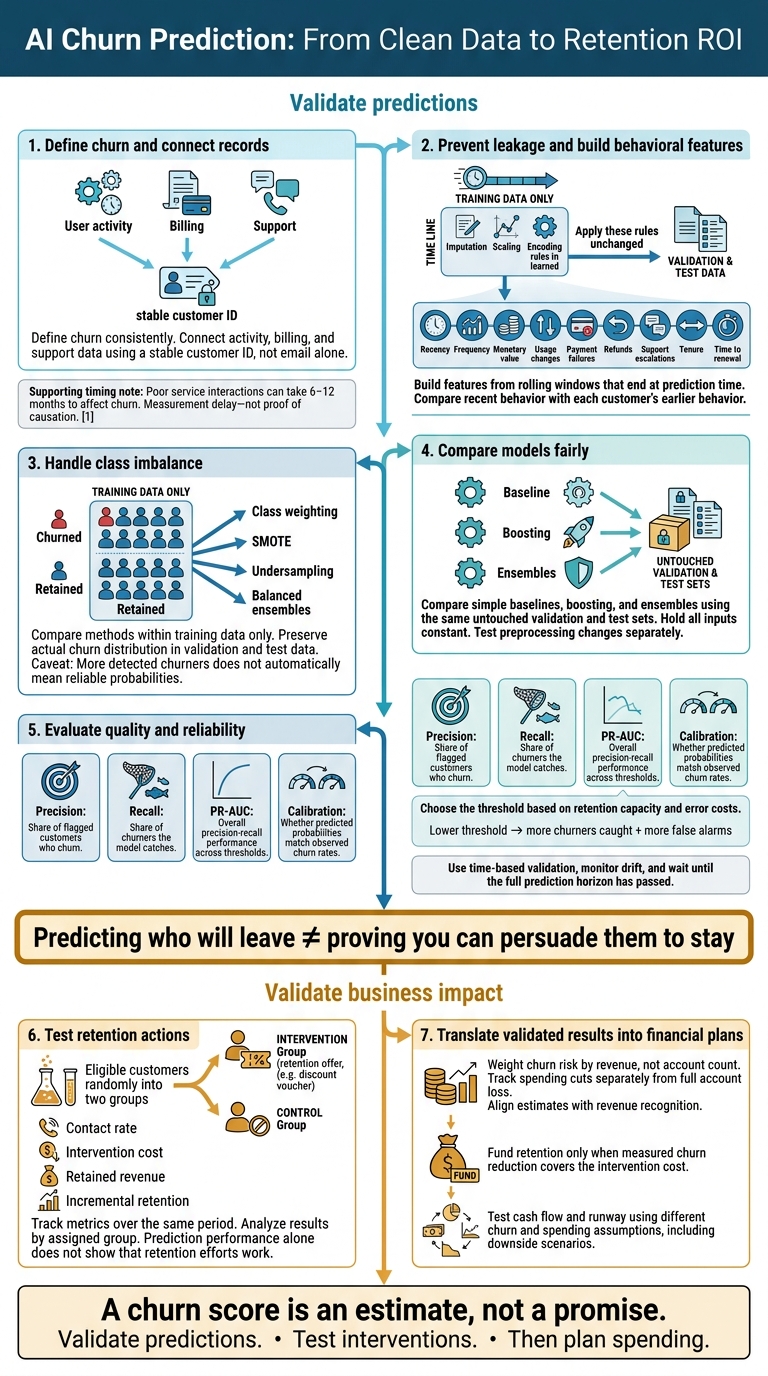
AI Churn Prediction: From Clean Data to Retention ROI
I Built a 94% Accurate ML Model… It Failed 😳 | Customer Churn Prediction Project | project maker
sbb-itb-17e8ec9
Prepare Data for Churn Prediction
Turn raw customer records into churn inputs you can test without introducing bias. Connect activity, billing, and support data using a stable customer ID, not email alone. Define churn consistently before labeling records. Poor service interactions can take 6–12 months to affect churn, so short follow-up windows may miss customers who leave later. Treat that delay as a measurement issue, not proof of causation.
Clean Data and Prevent Leakage
Learn imputation values, scaling parameters, and encoding rules from training data only. Then apply those same rules to validation and test data without changing them. Fix date and billing formats, and separate duplicate records from actual repeat contacts. Leave out any information that would not have been available at prediction time.
| Method | Problem addressed | Models most affected | Misuse risk |
|---|---|---|---|
| Missing-value imputation | Incomplete activity or billing fields | Models that cannot accept missing values | Unrealistic imputation rules can distort behavior patterns |
| Duplicate removal and format correction | Repeated rows, inconsistent dates or amounts | All models | Mistaking repeat behavior for duplicates can remove valid records |
| Outlier treatment | Extreme values or recording errors | Especially linear and distance-based models | Aggressive trimming can remove meaningful extremes |
| Categorical encoding | Text fields such as plan or support category | Models requiring numeric inputs | Can leak labels unless fitted within training folds |
| Scaling | Numeric features on different ranges | Distance-based and regularized models | Can expose test-data statistics if done before splitting |
Turn Customer Behavior Into Features
Build features from rolling windows that end at prediction time. Where data is available, include recency, frequency, monetary value, usage changes, payment failures, refunds, support escalations, tenure, and time to renewal.
Compare recent behavior with each customer’s earlier behavior instead of relying only on lifetime totals. Select features using training data only. Useful predictors will vary by industry, customer segment, and churn definition.
Track resolved tickets, repeat contacts, and billing outcomes separately. Repeat contacts, unresolved issues, and billing friction may signal churn early; they’re more than support metrics. Research summaries report that 67% of AI chatbot users repeat their issue to a human. Test repeat-contact behavior as a feature rather than assuming it signals churn for every customer.
Handle Class Imbalance in Training
When few customers leave, a model can favor those who stay and miss churners. Compare approaches using training-only weighting or resampling. Preserve the actual churn distribution in validation and test data.
Check probability calibration, too. Detecting more churners does not necessarily mean a score accurately reflects their probability of leaving.
| Approach | Purpose | Possible gain | Limitation |
|---|---|---|---|
| Class weighting | Increase the training penalty for missed churners | Higher churn recall without creating records | Can increase false alarms and distort probabilities |
| SMOTE | Generate synthetic minority-class training records | Better coverage of underrepresented churn patterns | Can create unrealistic customer combinations; categorical fields need special handling |
| Undersampling | Reduce nonchurn training records | Less majority-class dominance and faster training | Discards potentially useful customer information |
| Balanced ensembles | Train multiple models with balanced samples or weights | More stable detection across samples | Adds complexity; probabilities still need calibration checks |
After controlling leakage and building features from pre-churn behavior, compare model families using the same untouched validation and test sets.
Compare Models and Measure Prediction Quality
After preprocessing and handling class imbalance, compare every candidate against the same baseline using the same untouched validation and test sets. Only rank models across studies when the churn definition, prediction window, class balance, and validation setup match.
Compare Baselines, Boosting, and Ensembles
When comparing baselines, boosting models, and ensembles, keep the customer records, feature set, prediction window, test split, and all other inputs constant. Test preprocessing changes separately so you can tell whether gains come from the data or the model.
Evaluate Predictions Beyond Accuracy
With the comparison setup fixed, look beyond accuracy. A model can score well on accuracy while missing many churners.
Report precision and recall at your chosen threshold. Use PR-AUC to assess ranking quality, and check calibration on the held-out test set to see how well predicted probabilities match actual churn rates. These measures help you decide whom to contact and how aggressively to intervene.
| Measure | What it tells you | Why it matters |
|---|---|---|
| Precision | Share of flagged customers who churn | Helps limit unnecessary outreach |
| Recall | Share of churners the model catches | Shows how many at-risk customers you find |
| Precision-recall AUC (PR-AUC) | Overall precision-recall performance across thresholds | Useful when churn is rare |
| Calibration | Whether predicted probabilities match observed churn rates | Helps prioritize retention actions |
Choose your threshold based on retention capacity and error costs. A lower threshold catches more churners but also produces more false alarms. Weigh the costs of missed churners, outreach, and incentives, then report precision and recall at your chosen operating point.
Assess the Reliability of Churn Research
After measuring model performance, check whether the evidence behind it holds up.
Check Study Design and Compare Evidence
Start with the definition of “churn.” Customers who stop buying are not the same as customers who cancel. Use time-based validation, since churn may happen months after the event that triggers it.
Service-quality studies can help identify churn signals, but they do not replace churn benchmarks. Treat the sources below as indirect evidence only.
Source quality check: indirect evidence
| Source | Sample size | Limitation |
|---|---|---|
| Qualtrics XM Institute | 20,001 respondents | Self-reported survey data |
| Zendesk CX Trends | 4,500 respondents | Vendor-sponsored survey |
| Forrester CX Index | 110,000 participants | Not a churn-model evaluation |
Check Calibration, Drift, and Data Limits
A risk ranking is not a reliable revenue forecast. High containment can also mask poor resolution quality.
Monitor drift over time: as customer behavior changes, older probability scores may no longer be reliable. Check that customer data use follows consent, privacy commitments, and applicable requirements. Wait until the full prediction horizon has passed before evaluating outcomes.
Test the Impact of Retention Actions
Customers with high churn risk will not necessarily respond to outreach. Where feasible, randomly assign eligible customers to intervention or control groups. Over the same period, track contact rate, intervention cost, retained revenue, and incremental retention. Analyze results by assigned group, not just among customers who respond.
Prediction performance alone does not show that retention efforts work. Interventions must improve retention before spending is tied to predicted risk.
Use Churn Estimates in Financial Planning
Once churn scores are validated and calibrated, turn them into financial estimates.
Estimate Revenue at Risk and Retention Budgets
Weight churn risk by revenue, not account count. Track spending cuts separately from full account loss.
Align predicted churn with revenue recognition and renewal dates. This helps forecasts show when revenue will be lost, including lower spending from customers who don’t cancel.
Fund retention only when measured churn reduction covers the intervention cost. Use experiments to compare the value of added retained revenue against the cost of the intervention.
Test cash flow and runway with scenario forecasts that use different churn and spending assumptions. Set budgets and runway assumptions to account for downside risk - not just the base case.
Conclusion: Validate Predictions and Business Results
Recent studies point to a clear lesson: clean preprocessing, behavioral features, leakage control, and proper evaluation improve churn accuracy more than model complexity alone. Churn scores matter only when they hold up in held-out tests and help guide revenue-at-risk decisions.
Repeat contact and conversation abandonment can reveal hidden churn risk. But financial planning and retention spending need calibrated probabilities and tests of actual outcomes. Prediction does not prove intervention works: a higher risk score does not establish retention lift. Any churn score must meet that standard before it enters financial planning.
FAQs
How much customer data do I need to predict churn?
You probably already have enough data to get started. Modern AI models use information from your CRM, billing, and support systems. To build a reliable model, aim for 6–12 months of historical data from at least 500 customers [2].
Gather behavioral, transactional, support, and contextual demographic data [3][4]. Bringing it all into one place is the first key step toward accurate churn predictions you can act on [4].
How often should I retrain my churn model?
Retrain your churn model at least every 30 days to keep predictions accurate as customer behavior, market trends, and product features change [2][3][4].
Between updates, monitor model performance and data drift [2][3]. If accuracy drops below your set threshold - typically 70% to 75% - retrain immediately using new data [2]. Regular, automated updates help your model reflect actual outcomes, support customer retention efforts, and keep financial reporting precise.
How can I identify at-risk customers who will respond to outreach?
Use AI to track behavior changes in real time, rather than relying only on static metrics. Build a health score from 0 to 100 based on login frequency, feature adoption, support ticket sentiment, and billing activity. Look for drops in usage, negative sentiment, and stalled workflows.
Focus personal outreach on high-risk, high-value accounts. For moderate-risk customers, use automated, personalized campaigns. These signals can help you step in 30 to 90 days before a customer leaves.