If I had to sum it up in one line: AI helps startups update base, downside, and upside reports faster - but only when the numbers going in are clean.
I’d boil the article down to this:
- I need clean accounting, payroll, and billing data before I trust any AI output.
- I should limit board scenarios to 10–20 key drivers tied to burn, runway, hiring, revenue, and fundraising.
- I can use AI to turn 12–24 months of past data into a forecast, then test what happens if plans change.
- I should package results into a fixed board format: summary, essential financial metrics, P&L, cash flow, runway, and headcount.
- I still need finance and the CEO to review assumptions, flagged items, and the final memo before anything goes to the board.
In plain English, the article’s point is simple: AI cuts the manual work in scenario reporting, but it does not replace finance judgment. If revenue slips, hiring slows, or cash burn climbs, AI can update the model fast and show the effect on cash-out dates, runway, and headcount plans. But if the source data is off, the report will be off too.
Here’s the shortest way I’d explain the workflow:
| Step | What I do | What AI helps with |
|---|---|---|
| 1 | Clean books and set account tags | Checks for odd items and data gaps |
| 2 | Pick board-level drivers | Builds forecast logic from those inputs |
| 3 | Model base, downside, upside | Recalculates cash, burn, and runway |
| 4 | Build board pack | Updates tables, charts, and written notes |
| 5 | Review before sending | Drafts memo, but people approve final output |
A few details stand out. The article suggests a monthly close in 5–10 business days, then an AI-led forecast update after actuals roll in. It also pushes for a quarterly board cadence, so directors see the same scenario structure each time instead of a new format every quarter.
I also like that the article keeps the board lens tight. Instead of flooding directors with every line item, it focuses on a few decisions:
- hiring
- runway
- fundraising
- go-to-market changes
That’s the right frame. Boards usually want to know: What changed? How much runway do we have? When do we run out of cash? What decision do you want from us? The article stays close to those questions.
One more point matters: the write-up treats AI as a reporting tool, not a free pass. I still need human review for:
- account coding
- anomaly checks
- scenario assumptions
- board memo tone
- final sign-off
So if you want the core takeaway, here it is: AI makes scenario-based reporting easier to update, easier to compare, and easier for a board to scan - if I build the process around clean data, fixed drivers, and human review.
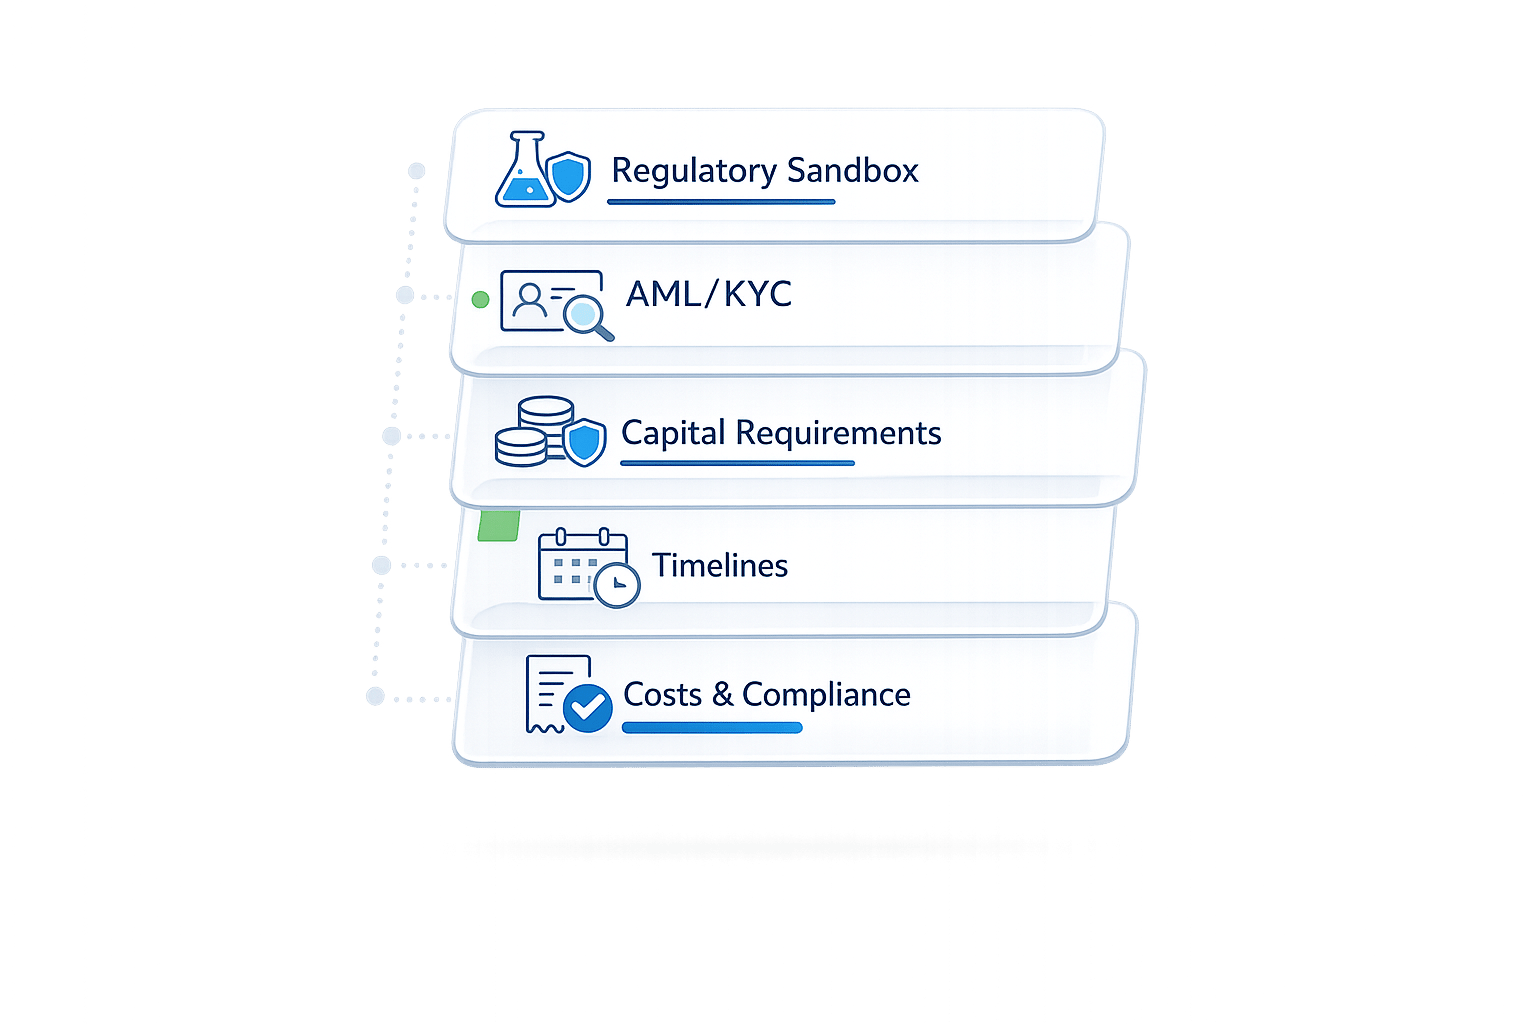
AI-Powered Scenario Analysis with Power BI and EVA

sbb-itb-17e8ec9
Build a Clean Financial Data Foundation for AI
AI scenario tools are only as reliable as the data behind them. If your books are messy, your outputs will be too. Clean records, steady categories, and reconciled data come first.
That work starts with a chart of accounts and tagging setup built for scenario analysis.
Align Your Chart of Accounts and Startup Metrics
Your chart of accounts (CoA) is the backbone of every scenario you build. Set it up so it maps straight to the questions your board asks, without piling on extra detail.
Separate recurring revenue from one-time fees. Split COGS from OpEx. Tag expenses by function so AI can isolate the inputs that move cash, burn, and runway.
Each expense line should also include a reporting tag, such as department, product, or segment. That gives AI a clean way to slice burn by team or model different growth paths. Without those tags, scenario outputs get fuzzy.
Define burn, runway, CAC, and LTV with exact account-level inputs so every report follows the same logic. Once that structure is in place, you can connect the systems feeding it.
Connect Accounting, Payroll, and Billing Data Into One Reporting Flow
Bring your accounting, payroll, and billing systems into one reporting flow through APIs or native integrations. That way, the scenario model works from one source of truth for revenue, headcount, and spend.
Instead of forcing AI to sort through three mismatched exports, you give it one clean dataset. Lucid Financials centralizes bookkeeping, CFO support, and Slack-based reporting in one platform.
After the data is unified, add review controls before leadership sees the report.
Set Review Controls Before Reports Go to Leadership
Run AI anomaly checks during close, then have finance approve flagged items before board review. That keeps board scenarios tied to reviewed inputs, not raw system data.
Once the data foundation is in place, the next step is choosing the drivers that will shape each scenario. With the foundation set, the board can focus on base, downside, and upside cases instead of reconciling data.
Set Up AI-Driven Scenarios Step by Step
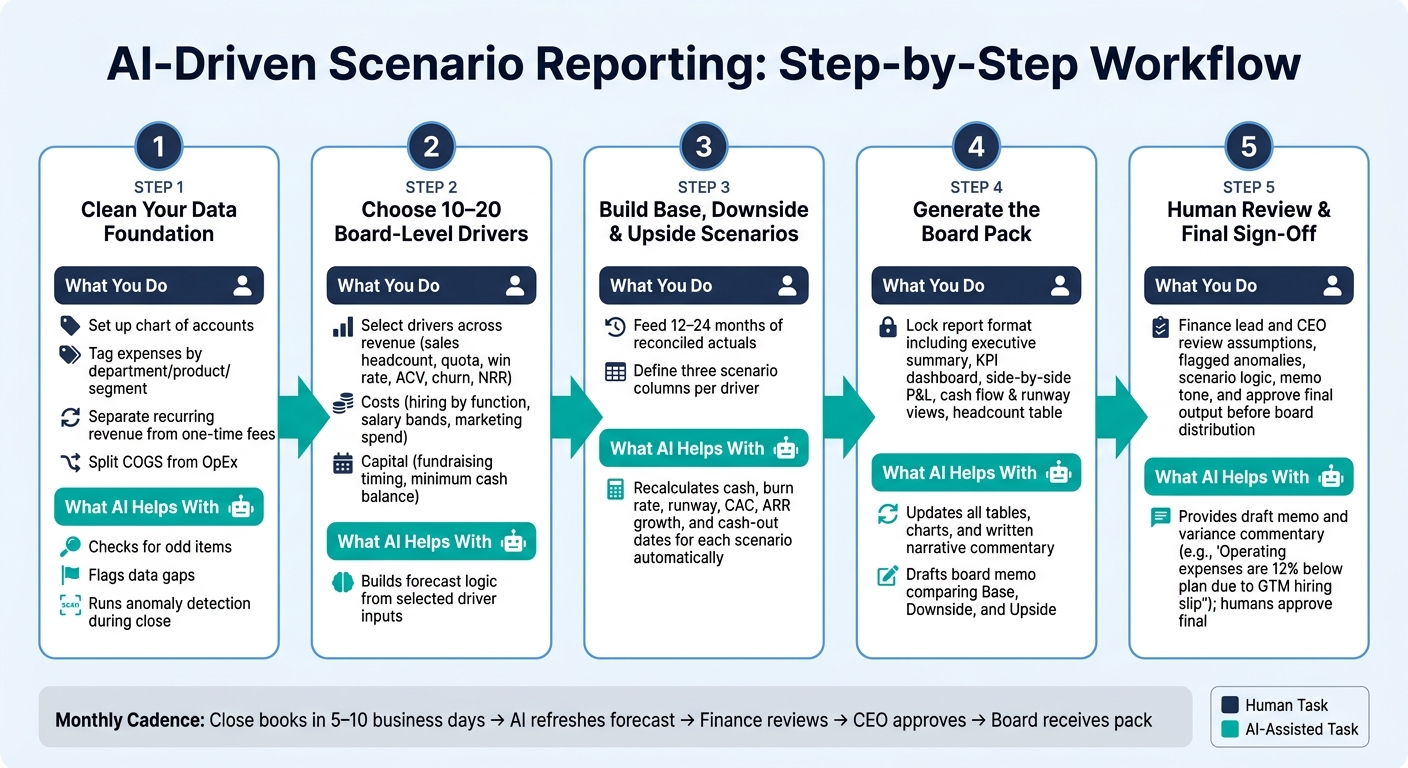
AI Scenario Reporting Workflow for Startups
Once your data is clean and in one place, you can start building scenarios that line up with the choices your board has to make.
Choose the Drivers That Matter to Your Board
After the data foundation is set, the next move is simple: pick the small set of inputs that shape board-level decisions.
Not every finance variable needs to show up in a board scenario. Focus on 10–20 drivers that most directly affect cash burn, runway, and core business performance. Keep everything else in supporting schedules.
On the revenue side, that usually means sales headcount, quota, ramp time, win rate, average contract value, churn, and net revenue retention. On the cost side, track hiring by function, salary bands, benefits, payroll taxes, marketing spend, and software or infrastructure costs. On the capital side, track fundraising timing, target raise amount, and your minimum cash balance.
Your company stage changes what matters most. Pre-seed and seed boards usually care most about runway, burn rate, and basic unit economics. Series A boards tend to shift toward CAC, payback period, and sales productivity. Series B+ boards usually look harder at gross margin, operating leverage, and cohort retention. If you’re not sure which inputs to include, ask board members which five drivers they’d want to see in every scenario.
Those drivers become the inputs AI uses to build your baseline forecast.
Use AI to Build a Baseline Forecast and Test What-If Assumptions
Once you’ve picked your drivers, feed AI 12–24 months of reconciled revenue, expense, and headcount data. From there, AI can spot seasonality, spending patterns, and revenue ramps, then turn that into a starting P&L and cash forecast.
This is where scenario work gets much easier. You can cut marketing spend and let the model recalculate CAC, new customer volume, ARR growth, and runway. Or you can add engineers at a set salary band and see how monthly burn changes, plus when cash drops to your minimum threshold.
With the baseline in place, a simple driver table makes side-by-side scenario review much easier.
Add a Driver Table for Base, Downside, and Upside Cases
Use one driver table to show how each scenario changes the main levers. Keep it tight: one row per driver and three columns for Base, Downside, and Upside.
| Driver | Base Case | Downside Case | Upside Case |
|---|---|---|---|
| New Sales Reps per Quarter | 3 | 1 | 4 |
| Avg Annual Quota per Rep (USD) | $800,000 | $700,000 | $900,000 |
| Minimum Cash Balance Threshold | $1,500,000 | $1,000,000 | $2,000,000 |
If churn, CAC, or fundraising timing matter a lot for your business, add them as extra rows in the same format.
When you stress-test the downside case, push on the areas that can actually hurt the plan: slower bookings, higher churn, a hiring freeze, or fundraising earlier than expected. For the upside case, stay grounded. It should be optimistic, not fantasy.
Turn Scenarios Into Board-Ready Reports With AI
Once your scenarios are built, the next step is turning them into a board pack directors can skim in minutes. The goal is simple: make it clear, consistent, and easy to update.
Standardize the Report Pack Your Board Will Review
A repeatable board pack makes scenario review much easier. Directors can move from one case to the next without stopping to decode a new layout each time.
The core pack should include:
- An executive summary
- A KPI dashboard
- A side-by-side P&L by scenario
- Cash flow and runway views
- A headcount table by scenario
Use USD figures with U.S. formatting. That means $1,500,000 instead of $1.5M, unless your board already prefers shortened figures. Use MM/DD/YYYY for all dates, like 03/31/2027 for a cash-out date.
Board members usually look at the executive summary first. That section should show:
- Runway in months for each scenario
- The cash-out date for each scenario
- Changes since the last board meeting
- The specific decisions you want the board to approve
Once this template is set, AI can refresh the tables and charts at each monthly close without changing the format. That fixed structure matters. It gives AI a stable layout to update month after month.
Use AI to Draft the Narrative Behind the Numbers
Boards act on context, not just numbers. AI can draft the written commentary that explains why each scenario looks the way it does. That gives your finance team a head start instead of asking them to write every memo from a blank page.
Feed the AI your scenario outputs, 12–24 months of actuals, and a direct prompt: "Using the attached scenario outputs and 12–24 months of actuals, write a concise board memo that compares Base, Downside, and Upside, quantifies runway and cash-out dates, and highlights changes versus the last board-approved plan." The model can then produce variance commentary like: Operating expenses are 12% below the previous plan because GTM hiring slipped and marketing spend stayed low. End the memo with the decision the board needs to make.
That said, finance leadership should always review and edit the AI draft before it goes to the board. Check the numbers, the tone, and whether the message fits your current plan. Lucid Financials combines AI-generated commentary with review by an experienced CFO team, so the memo that reaches your board is fast to produce and tied to actual numbers.
Add a Scenario Comparison Table for Fast Board Review
A single comparison table at the front of the board pack helps directors scan Base, Downside, and Upside fast. Keep it tight: one row per metric, one column per scenario, plus a notes column that spells out what each case means for the business.
| Metric | Base Case | Downside Case | Upside Case | Notes |
|---|---|---|---|---|
| ARR at Year-End | ||||
| Monthly Net Burn (Peak) | ||||
| Runway (Months) | ||||
| Ending Headcount | ||||
| EBITDA Margin |
Use this as the front-page summary, then place the detailed P&L below it. That way, directors can compare growth, burn, runway, and hiring tradeoffs at a glance.
Run an AI Reporting Process and Keep Human Oversight
AI helps most when scenario reporting runs the same way every month, every quarter, and every time leadership needs an update. Once the board pack format is locked, the process should follow a fixed monthly and quarterly rhythm.
Refresh Scenarios on a Monthly Close and Quarterly Board Cadence
A practical monthly rhythm looks like this: close the books within 5–10 business days after month-end, then trigger AI-powered financial planning to refresh forecasts that rolls actuals forward and updates runway, burn, and scenario outputs automatically. The finance lead should review flagged items before the updated forecast goes to the CEO and functional leaders.
That monthly refresh then feeds the quarterly board pack. On the quarterly board cycle, lock the as-of date, refresh base, downside, and upside using the same drivers and scenarios defined earlier, and have finance sign off on the narrative.
Use Slack or Chat-Based Access for Real-Time Leadership Questions
The same live model should also handle ad hoc leadership questions between closes. Slack access gives founders a direct line to the same forecast model between reporting cycles. A founder might ask: If we slow engineering hiring by 50% starting October 1, how many extra months of runway do we gain? Lucid Financials integrates directly with Slack, so founders can ask plain-English questions and get AI-assisted answers.
If leadership decides to slow hiring or make another material change, that decision should flow back into the next formal forecast refresh. Otherwise, the board pack can drift away from the actual plan, and that’s where things start to get messy.
Conclusion: Make Scenario Reporting Faster, Clearer, and More Useful With AI
AI speeds up the workflow, but finance still owns the assumptions, thresholds, and final sign-off. That means assigning data owners, running monthly sanity checks, locking cut-off dates, and requiring CEO and finance sign-off on AI-generated board materials.
FAQs
What data should I clean before using AI for scenario reporting?
Clean and organize the datasets you plan to use for AI-powered scenario reporting. Normalize them so you don’t end up comparing apples to oranges across time periods, file formats, or measurement units.
It also helps to use automated validation checks, keep tight data governance in place, and deal with outliers honestly instead of cherry-picking the numbers that fit the story. Just as important, update your inputs on a regular basis so old or unverified data doesn’t skew your projections.
Which scenario drivers matter most for my board?
Focus on the metrics that line up with your board’s main goals.
- For growth: revenue growth, monthly recurring revenue, CAC, churn, and pipeline conversion
- For profitability: EBITDA margin, operating income, and expense-to-revenue ratios
- For fundraising: burn rate, cash runway, and LTV:CAC
How often should I refresh AI-generated board scenarios?
With AI-powered platforms like Lucid Financials, scenario updates don't rely on periodic manual refreshes. Since they connect straight to your accounting, payroll, and banking systems, scenarios update automatically in real time.
That means your models reflect the latest actuals and market conditions, so you can pull accurate, investor-ready insights whenever you need them.