Want to make smarter spending decisions? Here's the key: classify your expenses into two categories - strategic (long-term growth investments) and operational (day-to-day necessities) - and measure their ROI (Return on Investment) differently. Why does this matter? Companies that track ROI effectively are 50% more likely to hit their goals.
Key Takeaways:
- Strategic Spending: Focuses on future growth (e.g., R&D, market expansion). Returns often take 12–36 months.
- Operational Spending: Covers recurring costs (e.g., payroll, subscriptions). Returns are quicker and more predictable.
- ROI Formula:
(Net Profit / Cost of Investment) × 100. - Metrics to Track:
- Customer Acquisition Cost (CAC): Total sales/marketing costs ÷ new customers.
- Lifetime Value (LTV): Revenue expected per customer over their lifecycle.
- Contribution Margin: Revenue left after variable costs.
How to Measure ROI:
- Classify Expenses:
- Strategic: Long-term, hard to reverse, creates new revenue streams.
- Operational: Short-term, easy to adjust, preserves existing revenue.
- Set Timeframes:
- Operational ROI: 3–12 months.
- Strategic ROI: 12–36 months.
- Adjust for Risk: Use risk-adjusted ROI for long-term investments by modeling multiple scenarios.
- Track Over Time: Monthly metrics ensure spending stays effective.
Example:
- Operational ROI: Automating invoicing saves $28,600 annually with a $22,990 investment. ROI = 24.4%.
- Strategic ROI: Expanding into a new market might yield 80–150% ROI in 3 years but requires patience.
Bottom Line: Use ROI to compare initiatives, prioritize budgets, and make data-driven decisions. But remember - some long-term investments, like brand positioning or team development, offer value that numbers alone can't capture.
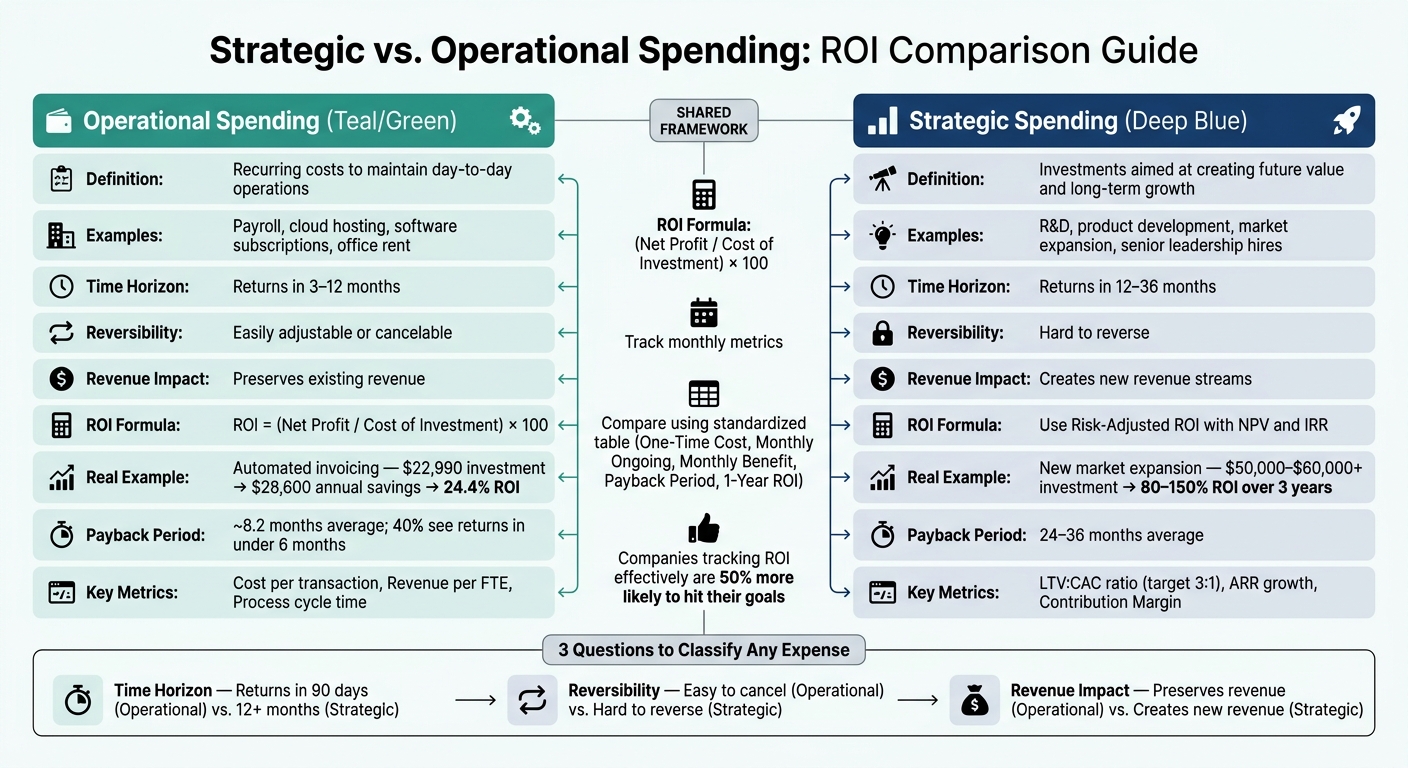
Strategic vs. Operational Spending: ROI Comparison Guide
Measuring Return on Investment (ROI) for all spending in your business
Defining Strategic and Operational Spending
Building on our ROI framework, it's crucial to establish clear definitions for accurate expense classification. Proper classification is the foundation for effectively applying ROI calculations.
What Is Strategic Spending?
Strategic spending refers to investments aimed at creating future value. Instead of focusing on immediate operational needs, these expenditures prepare your company for long-term growth. Examples include R&D, product development, expanding into new markets, or hiring senior leaders to drive innovation.
For AI-driven startups, a prime example would be investing in AI infrastructure. This might include compute resources, specialized tools, and skilled engineering teams needed to develop or enhance a core product. These investments are expected to deliver returns over time, not necessarily in the next quarter.
"The distinction between spending and investing is therefore not about frugality versus ambition. It is about intent, expected return, time horizon, and measurable outcomes." - Iniobong Uyah, Content Strategist & Copywriter, Epirus
What Is Operational Spending?
Operational spending encompasses recurring costs required to maintain day-to-day operations. These include payroll, cloud hosting, customer support tools, office rent, and software subscriptions. While essential for keeping the business running, these expenses don't directly drive growth.
For AI companies, AI inference costs should be classified carefully. If tied to customer-facing features, they belong in COGS. If used internally, they fall under SG&A or R&D. Misclassification of such costs can skew your gross margin and present a misleading picture to investors.
A Simple Checklist to Classify Your Spending
To determine whether an expense is strategic or operational, consider these three questions:
- Time horizon: Will the expense deliver returns within 90 days, or is it geared toward benefits over 12 months or more? Short-term returns typically indicate operational spending, while long-term benefits point to strategic investments.
- Reversibility: Can the cost be quickly canceled or reduced if necessary? Easily reversible expenses are usually operational, whereas harder-to-reverse costs lean toward strategic.
- Revenue impact: Does the expense preserve existing revenue, or is it meant to create new revenue streams? Maintenance-related costs are operational, while those aimed at generating new growth are strategic.
If an expense aligns with all three strategic criteria - long-term horizon, difficulty to reverse, and focused on new revenue - it should be classified as strategic. If it meets none, it's operational. Many expenses will fall somewhere in the middle, so consistency in classification is key for your team.
Once your spending is clearly categorized, you can apply a consistent framework to measure ROI effectively.
A Framework for Measuring ROI
When expenses are clearly categorized, a consistent approach to measuring ROI allows for straightforward comparisons between operational and strategic investments. Without this structure, budget decisions often rely more on guesswork than solid data.
The ROI Formula and Key Metrics
At its core, the ROI formula is:
ROI = (Net Profit / Cost of Investment) × 100
For example, if you invest $50,000 in a sales automation tool and it generates $30,000 in net profit, your ROI would be 60%. However, this formula is only as accurate as the data you use to calculate it.
To make ROI calculations more practical, it’s important to track three key metrics:
- Customer Acquisition Cost (CAC): This is calculated by dividing total sales and marketing expenses by the number of new customers acquired. It helps you understand how much it costs to gain each customer.
- Lifetime Value (LTV): This represents the total revenue you expect from a customer over the course of their relationship with your company. A strong LTV:CAC ratio is typically 3:1 or better.
- Contribution Margin: This is the revenue remaining after subtracting variable costs. It shows how much each dollar of revenue contributes to covering fixed costs and generating profit.
These metrics provide essential context. For instance, while a 60% ROI might look impressive on paper, a long CAC payback period could create cash flow challenges that need to be factored into your planning.
Once these metrics are established, it’s crucial to align your evaluation period with the return cycle of each type of expense.
Choosing the Right Time Horizon
The timeframe for evaluating ROI should depend on the type of expense. Operational costs often show results within 3–12 months, while strategic investments may take 12–36 months to yield meaningful returns.
The stage of your company also plays a role. Early-stage startups often require quicker payback periods to conserve cash, while more mature companies, such as those in Series B or later, can afford to wait longer for returns. As financial analyst Narayan from Metaflow explains:
"A 12-month horizon is appropriate for cash flow and payback period analysis. A full lifetime projection is appropriate for brand equity and long-term investment decisions." - Narayan, Author at Metaflow
Using the wrong time horizon can lead to poor decisions. For example, judging the success of a market expansion investment after only 90 days would be like pulling a sourdough starter out of the oven after just one day - it’s far too early to see results.
Risk-Adjusted ROI for Long-Term Decisions
For long-term investments, it’s essential to account for uncertainty. Standard ROI calculations assume that projections will go exactly as planned, but risk-adjusted ROI offers a more realistic approach. This method models three scenarios - base, upside, and downside - and assigns probability weights to each. It also incorporates Net Present Value (NPV) to adjust future returns to their present-day value, reflecting the time value of money.
Here’s how it works: calculate the expected ROI for each scenario, apply probability weights, and compute a weighted average. For instance, if your base case projects a 45% ROI (60% probability), the upside scenario projects 90% ROI (25% probability), and the downside scenario projects -10% ROI (15% probability), the risk-adjusted ROI would come out to approximately 48%. This provides a more realistic figure to present during decision-making discussions.
"A positive NPV means the investment creates value; negative means it destroys value." - SimpleFeasibility
This approach is particularly useful for evaluating complex investments like AI or infrastructure projects. These often come with hidden costs - such as model and API fees, talent acquisition, data preparation, and governance - that can push expenses 20–40% higher than initial estimates if not closely monitored. By combining these methods, businesses can make better-informed decisions about allocating resources across both operational and strategic priorities.
How to Calculate ROI for Operational Spending
This approach focuses on calculating returns from operational costs, emphasizing recurring expenses and short-term gains.
Identifying Costs and Benefits
To start, identify all associated costs and the benefits they generate. A common mistake, especially among startups, is underestimating costs by only accounting for vendor invoices. Don't forget to include internal expenses like management, training, and integration.
The total cost of ownership includes both direct costs (e.g., licenses, subscriptions) and indirect costs (e.g., project management, training). Studies show that direct costs typically make up 35% of a project’s budget, with the remaining 65% coming from indirect costs.
On the benefits side, it’s important to separate cost avoidance (e.g., eliminating manual tasks, reducing errors, avoiding new hires) from revenue generation (e.g., faster sales cycles, increased conversion rates). Automation ROI often skews heavily toward cost avoidance, which accounts for about 70%, while revenue generation contributes roughly 30%. Revenue benefits are frequently discounted by 50% to account for attribution uncertainty.
When calculating labor savings, use fully loaded labor rates, which range from 1.4x to 1.8x an employee’s base salary. For instance, an employee earning $80,000 annually costs the company between $112,000 and $144,000 when benefits and overhead are included.
With these costs and benefits identified, let’s walk through an example.
Step-by-Step ROI Calculation
Here’s a practical example to demonstrate the calculation process.
A 15-person startup adopts an automated invoicing tool to replace its manual accounts payable process. Before automation, the finance team spent 12 hours weekly on invoice processing, with a loaded labor rate of $55 per hour.
Cost Breakdown:
| Cost Category | Amount |
|---|---|
| Implementation labor (50 hrs × $170 loaded rate) | $8,500 |
| Data preparation (20 hrs × $160 loaded rate) | $3,200 |
| Training and change management (4 hrs × 15 users × $40/hr) | $2,400 |
| Integration development | $6,800 |
| Total Investment | $20,900 |
After implementation, processing time drops from 12 hours to 2 hours per week, saving 10 hours. At $55 per hour, that’s $550 per week or approximately $28,600 annually. Adding a 10% contingency buffer, the adjusted investment totals $22,990.
Using the ROI formula:
ROI = (Net Profit / Cost of Investment) × 100
In this case:
ROI = ($28,600 − $22,990) / $22,990 × 100 ≈ 24.4%
This represents a positive return within the first year. Automation projects in finance and operations often achieve payback in about 8.2 months, with 40% seeing returns in under six months.
"CFOs don't want novel measurement approaches. They want your AI project to fit into the same financial model they use for trucks, software licenses, and warehouse expansions." - Scott Armbruster, AI Strategist
Metrics to Track Operational Performance Over Time
Calculating ROI is just the beginning. To maintain efficiency, it’s crucial to monitor performance regularly. Costs can creep up, and benefits may decline over time. For example, AI models lose 5% to 10% of accuracy annually without retraining, which can erode initial savings.
Track these metrics monthly:
| Metric | What It Measures |
|---|---|
| Cost per transaction | Total processing cost divided by transaction volume |
| Revenue per FTE | Total revenue divided by full-time headcount |
| Process cycle time | Time to complete tasks like invoicing or onboarding |
| Tier-1 automation rate | Percentage of support tickets resolved without human input |
| Lead response time | Time from inquiry to first sales contact |
If baseline metrics don’t improve by at least 20% within 60 days of full deployment, it may be time to reassess spending. A simple one-page summary tracking benefits vs. costs and cumulative savings is typically enough for finance teams to stay on top of performance. Regular tracking ensures you can reallocate resources effectively, as we’ll explore in the next section.
sbb-itb-17e8ec9
How to Measure ROI for Long-Term Investments
Long-term investments - like launching a new product line, expanding into untapped markets, or developing an AI platform - require a broader perspective. Unlike short-term operational costs, these investments demand a multi-year framework to assess their return on investment (ROI).
Linking Investments to Financial Outcomes
To measure ROI effectively, avoid vague promises of growth. Instead, tie each investment directly to measurable financial outcomes. For instance, if you're investing in AI-driven customer support, you might map the benefits as follows: faster resolution times → reduced customer churn → increased annual recurring revenue (ARR). Each step in this chain requires a specific metric to ensure the results are tangible. Without this clarity, the outcomes remain speculative.
"The productivity argument was the right metric for the GenAI pilot phase, but the market has matured. Enterprises are now demanding that every AI capability connect directly to revenue growth or margin improvement." - Keith Kirkpatrick, Futurum Group
To make these connections clearer, organize benefits into three distinct tiers:
| Tier | Benefit Type | Example |
|---|---|---|
| Tier 1 | Direct cost reduction | Fewer support staff needed |
| Tier 2 | Revenue impact | Higher conversion rates, lower churn |
| Tier 3 | Strategic/soft value | Brand positioning, future optionality |
Tiers 1 and 2 are easier to justify financially, while Tier 3, though important for strategy, shouldn't be the sole driver of the financial case.
Multi-Year ROI Calculation
Long-term investments often follow a J-curve trajectory: ROI is negative in the first year due to upfront costs, but benefits typically accelerate in years two and three. A phased rollout can help manage expectations: no immediate gains during the build phase, gradual improvements during pilot and ramp-up phases, and full benefits once the project stabilizes.
To calculate long-term ROI, use tools like Net Present Value (NPV) and Internal Rate of Return (IRR) over a 3-to-5-year timeframe. These methods account for the time value of money, providing a more accurate picture than a simple ROI percentage. For strategic AI projects, the average payback period is 24–36 months, with a 3-year ROI typically ranging from 80–150% for platform-based investments.
One often-overlooked expense is change management, which can consume 20–30% of the total project budget but is frequently underestimated at less than 10%. Additionally, ongoing costs like infrastructure, maintenance (usually 15–25% of the original development cost annually), and model retraining should be included.
"Traditional CapEx/OpEx models undercount AI costs by 40–60%... because most finance teams treat AI as a one-time capital purchase rather than a living operational system." - Alice Labs
This structured approach ensures a comprehensive evaluation, blending both measurable financial metrics and qualitative insights.
Accounting for Value That ROI Does Not Capture
Some benefits of long-term investments - like competitive positioning, organizational learning, talent attraction, and strategic flexibility - are difficult to quantify. To address this, score these intangible benefits on a 1–5 scale with a brief written explanation. Present these scores alongside the financial summary, not as a replacement for it. If the financial case is weak but the strategic value is compelling, highlight this explicitly so leadership can weigh their options.
One intangible that can be measured indirectly is adoption rate. A project with an 85% adoption rate versus 40% can lead to a 3x to 4x difference in NPV. If you're unsure about prioritizing an initiative with low near-term ROI, model adoption scenarios aggressively - adoption often determines whether a long-term investment succeeds or falls flat.
Comparing Spending and Reallocating Resources
Once you've calculated ROI for both operational and strategic initiatives, the next step is comparing the results to figure out where your budget should go.
Building a Side-by-Side Comparison Table
To make an informed decision, use a consistent financial format for every initiative. As Scott Armbruster explains:
"CFOs don't want novel measurement approaches. They want your AI project to fit into the same financial model they use for trucks, software licenses, and warehouse expansions."
This means sticking to standardized metrics like upfront costs, recurring monthly expenses, monthly benefits, payback periods, and 1-year ROI. Here's an example of what such a comparison might look like:
| Initiative | One-Time Cost | Monthly Ongoing | Monthly Benefit | Payback Period | 1-Year ROI |
|---|---|---|---|---|---|
| Project A (Operational) | $32,900 | $3,020 | $21,460 | 1.8 months | 571% |
| Project B (Strategic) | $50,000 | $5,000 | $15,000 (est.) | 5.0 months | 140% |
Monthly Benefit accounts for time value, revenue gains, and cost avoidance, minus ongoing monthly costs.
This table makes trade-offs clear at a glance. For example, Project A delivers faster returns and greater certainty, while Project B has less immediate ROI but might offer higher long-term potential. There’s no universal right answer - it all depends on your company’s specific goals and priorities.
How to Prioritize Based on ROI and Business Goals
With a clear side-by-side comparison, you can prioritize initiatives based on both short-term returns and alignment with broader business objectives. If funds are tight, focus on operational projects that deliver results quickly - ideally with payback periods under 12 months and measurable improvements within 60 days. A helpful benchmark: if a project doesn’t improve its core metric by at least 20% within 60 days, it might be time to shift resources. As Armbruster points out, "Finance respects teams that kill bad projects based on data, not stubbornness."
If your financial runway allows for it, you can invest in longer-term strategic projects - provided they’re backed by solid financial metrics like NPV (Net Present Value) and IRR (Internal Rate of Return), rather than just a compelling story. A payback period of 4 months is generally a strong signal to proceed, while 18 months calls for careful consideration, and 36 months often requires rethinking the entire business case.
These prioritization strategies help guide not just current decisions but also future budgeting and resource allocation.
Using ROI Analysis in Budgeting and Reforecasting
ROI analysis shouldn’t be a one-and-done exercise. Instead, it should become a key part of your quarterly budget reviews and reforecasting cycles. Avoid vague timelines like "we’ll check in later." Instead, set specific milestones - such as reevaluating a strategic initiative at 6 months if ARR (Annual Recurring Revenue) hasn’t increased, or reviewing an operational tool if adoption rates are below 70% by day 90.
This is where tools like Lucid Financials shine. By providing AI-powered CFO support, Lucid offers startups real-time access to accurate financial data, scenario modeling, and board-ready reports. This eliminates the need to manually update spreadsheets before every reforecast. With live, up-to-date numbers, you can make resource allocation decisions that are fully data-driven. Incorporating these ROI insights into your budgeting process ensures your spending remains flexible and informed by the latest financial realities.
Conclusion: Using ROI to Allocate Resources and Drive Growth
Using ROI effectively isn't about chasing a perfect number - it’s about creating a reliable process to guide spending decisions. By categorizing expenses and applying ROI calculations, you can compare opportunities side by side and make more informed budget choices.
Take this example: Switching to a new payment processor might cost $12,000 upfront but save $1,500 monthly, resulting in a 50% ROI within a year and an 8-month payback period. On the other hand, investing $60,000 in a self-serve onboarding flow could yield $420,000 in gross profit over three years - a 600% ROI - but with more uncertainty. These comparisons help you prioritize based on clear financial tradeoffs rather than gut feelings.
ROI works best when it’s part of your ongoing financial processes, not a one-time analysis. After closing your books each month, review major expense categories and update ROI figures. At quarterly board meetings, include a simple ranking of initiatives by ROI, payback period, and alignment with strategic goals. During annual budgeting, start with essential operational expenses, allocate funds to high-ROI opportunities, and trim low-ROI areas to maintain your financial targets. This approach ensures consistent and focused resource allocation.
However, ROI isn’t a one-size-fits-all tool. Avoid cutting every project that doesn’t show immediate payback - investments in areas like compliance, security, or team development often provide long-term benefits that aren’t easily quantified. Treat early ROI estimates as rough guides, revisit assumptions regularly, and compare projects using consistent timeframes and full cost analyses (including internal labor) before making decisions.
FAQs
How do I classify borderline expenses that feel both strategic and operational?
When dealing with borderline expenses, focus on their intent rather than simply the type of invoice. Here's how to approach it:
- Treat routine, short-term costs - like payroll, software subscriptions, or compliance fees - as operational. These are essential for day-to-day functioning.
- For non-routine, discretionary investments aimed at generating long-term benefits (typically over 3–5 years), classify them as strategic. These often involve growth or innovation.
- If an initiative includes both operational and strategic elements, break it down into components and assign classifications proportionally.
- Still unsure? Perform an ROI and time-to-value analysis, factoring in both direct and indirect costs, to ensure the expense aligns with strategic goals.
This method ensures clarity and proper alignment with organizational priorities.
What discount rate should I use for NPV in risk-adjusted ROI?
When calculating Net Present Value (NPV), it's standard practice to use your company’s cost of capital as the discount rate. This rate is often called the hurdle rate and typically corresponds to the Weighted Average Cost of Capital (WACC).
For many businesses, a WACC of around 12% is a common benchmark. Investments with an Internal Rate of Return (IRR) exceeding this hurdle rate are generally considered to add value. On the other hand, projects with an IRR below this level may diminish shareholder value.
How do I track ROI when benefits are hard to attribute (like brand or adoption)?
To measure ROI for aspects like brand growth or adoption, blend measurable direct outcomes with indirect benefits using a consistent scoring approach. Begin by establishing a baseline, then set clear KPIs for a defined period, such as 12–48 months. The ROI formula to follow is:
(Direct Benefits + Indirect Benefits − Total Costs) / Total Costs × 100.
Incorporate the RICE framework to evaluate the anticipated impact, and adjust your scoring monthly as fresh data becomes available.