If I want a startup valuation that investors won’t push back on right away, I start with benchmarks. In the U.S., recent median figures sit around $13.3 million for seed pre-money and $48 million for Series A pre-money. For pre-seed SAFEs, median caps range from about $10 million to $18 million, depending on check size.
Here’s the short version:
- I first match the benchmark to the stage and deal type
- I pull clean numbers like ARR, revenue, gross margin, burn, runway, churn, and growth
- I compare my startup to 5–10 similar companies
- I apply the right multiple to build a low, base, and high valuation range
- I test that number against dilution, since 15%–25% is common in many seed and Series A rounds
- I use that range to explain why my company belongs at the low, middle, or high end
A simple example: if a SaaS startup has $1.2 million ARR and the market range is 6x–14x ARR, the valuation range is about $7.2 million to $16.8 million. If that company takes in $3 million at a $12 million pre-money, dilution is about 20%.
The main point: I don’t pick a number first and look for data later. I use current market data, my own metrics, and close comps to build a range I can explain in plain English.
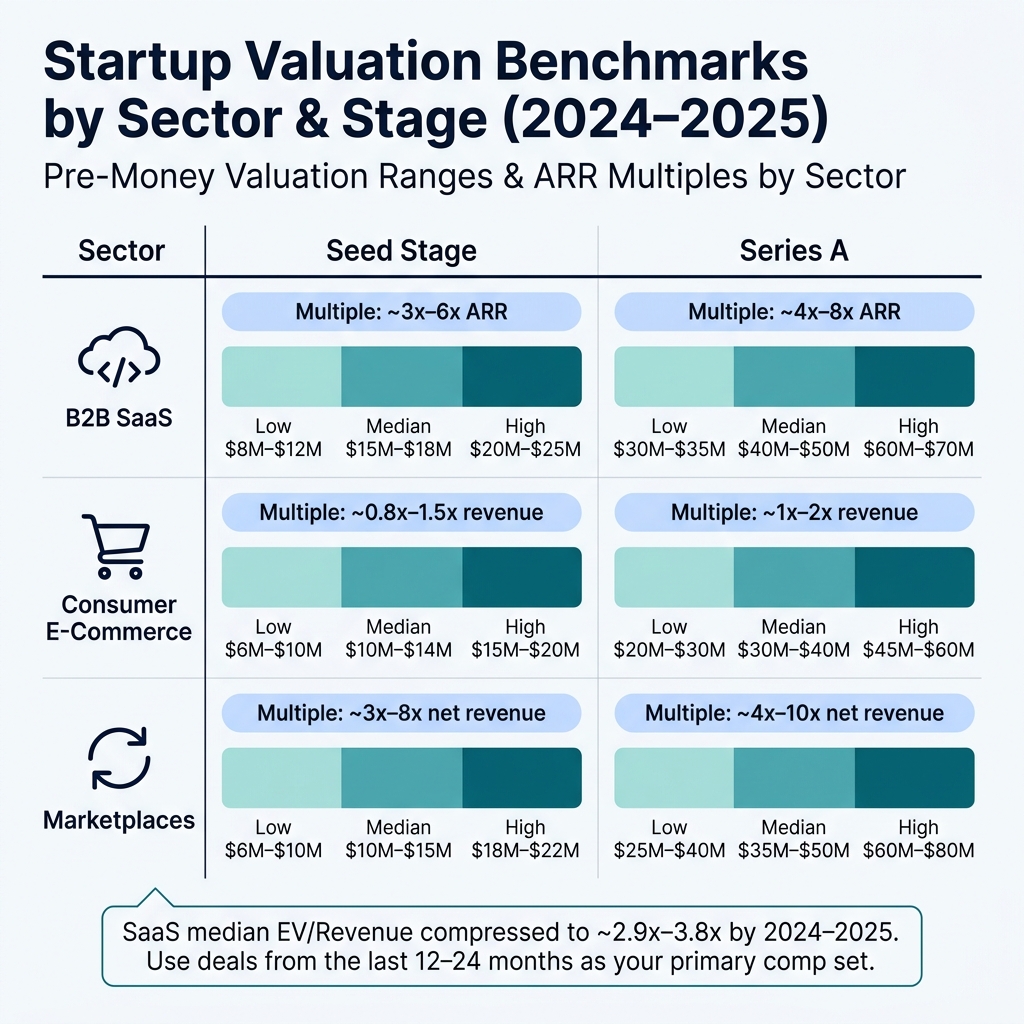
Startup Valuation Benchmarks by Sector & Stage (2024–2025)
The Ultimate Guide to Startup Valuations for Founders
sbb-itb-17e8ec9
1. Gather the financial and operating data investors will compare
Before you benchmark anything, pull together the numbers investors will stack side by side. If these inputs are clean and lined up, you can compare your company against the right industry and stage without mixing apples and oranges.
Collect the core metrics that drive valuation multiples
At a minimum, you should have:
- TTM revenue
- ARR or MRR
- gross margin
- monthly burn rate
- runway
- a next 12-month revenue projection tied to past performance
That’s the baseline. But investors usually go further. They also look hard at growth rate, churn, customer count, CAC, LTV, and net revenue retention (NRR). These numbers help them argue for a higher or lower multiple.
The key here is consistency. Use the same definitions and the same time periods for every metric. If one number is monthly, another is annualized, and a third is based on a different customer set, the comparison starts to fall apart.
Get investor-ready reporting in order before benchmarking
These metrics need to come from reconciled, accrual-basis books. Investors often ask for trial balances, general ledger detail, and bank statements during diligence. If the numbers in your deck don’t match the records underneath them, you can end up with a lower valuation or a delayed round.
Investor-ready reporting means closing the books every month on a fixed schedule, ideally by day 10–15 of the next month. It also means having a GAAP-compliant, accrual-basis P&L, balance sheet, and cash flow statement ready to go.
Just as important, write down how each KPI is defined. ARR, gross margin, churn, and CAC should be calculated the same way every month. That sounds basic, but this is where many teams get tripped up.
Lucid Financials can help keep books reconciled and KPI reporting investor-ready. Once your data is in order, you can move on to picking comparable companies and benchmark multiples.
2. Choose the right benchmarks and comparable companies
Once your financials are clean, the next move is picking benchmarks that fit your business. Not companies that just look close on the surface.
That distinction matters. Investors price businesses based on how the business makes money. So your benchmarks should reflect how they’d underwrite your revenue model, not some loosely related tech company. A benchmark only helps if it mirrors the way buyers and investors would look at your numbers.
Five things should shape your comp set: sector, funding stage, growth profile, geography, and revenue model.
A U.S. B2B SaaS company with recurring ARR is priced very differently from a consumer marketplace or a DTC e-commerce brand. SaaS investors tend to anchor on ARR multiples. Marketplace investors often look at net revenue, or take rate × GMV. E-commerce investors usually lean on plain revenue multiples, often around 1x–3x, because inventory risk, logistics costs, and thin margins squeeze valuations. Mix those models together and the result gets messy fast.
Use stage and industry benchmarks together
A good comp set turns raw metrics into a valuation range you can defend. Start with what investors are paying for rounds at your stage right now. Then add sector-based multiples on top.
Use the table below as a starting band. After that, tighten the range with recent comps.
The table below shows approximate benchmark ranges for U.S. startups by sector and stage, based on recent private market data.
| Sector / Stage | Low Pre-Money | Median Pre-Money | High Pre-Money | Typical Multiple Band |
|---|---|---|---|---|
| B2B SaaS – Seed | $8M–$12M | ~$15M–$18M | ~$20M–$25M | ~3x–6x ARR |
| B2B SaaS – Series A | $30M–$35M | ~$40M–$50M | ~$60M–$70M | ~4x–8x ARR |
| Consumer E-commerce – Seed | $6M–$10M | ~$10M–$14M | ~$15M–$20M | ~0.8x–1.5x revenue |
| Consumer E-commerce – Series A | $20M–$30M | ~$30M–$40M | ~$45M–$60M | ~1x–2x revenue |
| Marketplaces – Seed | $6M–$10M | ~$10M–$15M | ~$18M–$22M | ~3x–8x net revenue |
| Marketplaces – Series A | $25M–$40M | ~$35M–$50M | ~$60M–$80M | ~4x–10x net revenue |
A high-growth SaaS company with strong net revenue retention can land near the top of its range. A slower-growing company with churn moving up will usually sit near the bottom.
Build a focused comp set from similar companies
Keep your comp set tight: 5–10 companies is enough. A giant list doesn’t make the analysis better. It just makes it easier to hide weak matches.
Start with business model first:
- subscription ARR
- transactional revenue
- GMV
Then narrow by stage, scale, growth rate, and efficiency. The goal is to find peers growing 30%–60% year over year with burn multiples that look like yours, not headline-grabbing outliers.
Once the comp set lines up with your business model, you can apply those multiples to your own numbers with a lot more confidence.
SaaS multiples came down hard after the 2020–2021 boom. By 2024–2025, median EV/Revenue had slid to roughly 2.9x–3.8x for many private deals, down from double-digit peaks. At the same time, down rounds made up about 20% of all venture deals in 2024, around double the historical average.
That’s why recent comps matter so much. Use deals from the last 12–24 months as your main reference set. Older deals can still help, but treat them as ceiling cases, not the base case. This comp set is what you’ll use to choose the multiple in Step 3.
3. Apply benchmark multiples to calculate a valuation range
Once you have a multiple range from your comp set, apply it to ARR or TTM revenue and model a low, base, and high case. This gives you a practical range to test against your raise size and dilution target.
Calculate low, base, and high valuation scenarios
Take a B2B SaaS startup with ARR of $1,200,000. Based on the comp set from Step 2, the founder lands on a reasonable range of 6x–14x ARR for early-stage U.S. SaaS companies. That leads to three simple scenarios:
- Low (6x): $1,200,000 × 6 = $7,200,000
- Base (10x): $1,200,000 × 10 = $12,000,000
- High (14x): $1,200,000 × 14 = $16,800,000
The spread matters. Higher growth, stronger gross margin, and higher NDR can support a higher multiple. On the flip side, weaker retention, lower margins, or customer concentration can drag the number down. A startup with 70% YoY ARR growth, 72% gross margin, and 105% NDR fits around the middle of the range.
If the business doesn’t run on recurring revenue, swap ARR for TTM revenue and use the market multiple that fits that type of company.
Check the result against dilution and market reality
Next, check whether the valuation works with your raise size and target dilution. The point isn’t just to get a clean spreadsheet answer. It’s to land on a number investors can accept and fund.
Post-money valuation = Pre-money valuation + New capital raised. Dilution is roughly New capital ÷ Post-money valuation. So if you raise $3,000,000 on a $12,000,000 pre-money valuation, your post-money is $15,000,000 and dilution is 20%. That sits right in the usual range for a U.S. seed or Series A round, where 15%–25% dilution is typical.
Here’s how that same $3,000,000 raise looks across all three scenarios for the $1,200,000 ARR example:
| Scenario | ARR (USD) | Multiple | Pre-Money (USD) | New Capital (USD) | Post-Money (USD) | Approx. Dilution |
|---|---|---|---|---|---|---|
| Low | $1,200,000 | 6x | $7,200,000 | $3,000,000 | $10,200,000 | ~29–30% |
| Base | $1,200,000 | 10x | $12,000,000 | $3,000,000 | $15,000,000 | ~20% |
| High | $1,200,000 | 14x | $16,800,000 | $3,000,000 | $19,800,000 | ~15–16% |
The low case leads to ~30% dilution. That’s above the usual band, which can be a sign that the raise is too large for the current ARR or that you’ll need very strong metrics to justify a better valuation.
The high case lands at ~15% dilution. That’s appealing for founders, but it usually takes top-quartile metrics to survive investor pushback. This is where current market data and recent comparable rounds matter. A number may look fine on paper and still miss the market by a mile.
That range becomes the starting point for your investor story in Step 4. Lucid Financials can help keep ARR, margins, and retention current and investor-ready, so the inputs in this table match your latest numbers before a raise. Update those inputs often so the range still works when the next round comes around.
4. Use the benchmark range to support your investor narrative
Use the Step 3 range to explain your ask with numbers investors already use: ARR growth, NRR, gross margin, burn multiple, and CAC payback. Then turn that range into the story investors will hear.
Explain why your startup fits a specific point in the range
Tie your ask to measurable results, not hope.
Use the profile below to show where you belong in the range.
| Range Tier | Metrics Profile |
|---|---|
| Lower end (e.g., 4–5x ARR) | 20–40% YoY ARR growth, NRR near or below 100%, higher burn, and longer CAC payback |
| Mid-range (e.g., 6–7x ARR) | 40–70% YoY growth, NRR around 105%–115%, burn multiple 1.5x–2.5x, and CAC payback of 18–24 months |
| Upper end (e.g., 8–10x+ ARR) | 80%+ YoY growth, NRR of 120%+, burn multiple at or below 1x, and CAC payback under 18 months |
Use that comparison to support the multiple you're asking for.
In practice, NRR is one of the clearest ways to place your company inside the range. Median private B2B SaaS NRR sits around 101%, while top-quartile companies cluster around 110%–120%+. If your NRR is 125% and a peer is at 102%, that spread helps make the case for the upper half of the range.
A short peer comparison helps. Match your metrics against 3–5 companies at a similar ARR. Aggregated benchmark medians are enough. Show the gap in plain English: at $2,000,000 ARR, our 125% NRR and 1.3x burn multiple are ahead of the roughly 102% NRR and 2.2x burn multiple in the peer data, which is why we're targeting the upper half of the 6x–8x ARR range.
Keep valuation inputs current as the business changes
A benchmark-based valuation is only as good as the numbers behind it. ARR, burn, NRR, and gross margin can move fast. And if your deck still shows figures from three months ago, investors will spot the mismatch during diligence.
During an active raise, update your core valuation inputs at least once a month:
- Roll ARR forward
- Recalculate burn multiple and runway
- Check whether your benchmark multiple range still makes sense in the current market
If public SaaS multiples compress, private-stage expectations usually move with them, and your narrative should reflect that shift. Founders who adjust early and explain the change plainly tend to build more trust than those who keep pitching an old number.
Lucid Financials can keep ARR, burn multiple, and margin data current so your valuation narrative stays aligned with diligence.
Conclusion: Turn benchmarks into a clear valuation process
Benchmarking should happen before each raise. But it only helps if the inputs are up to date.
Start by defining the round. Then clean the books, pick relevant U.S. comps, apply the multiples, and pressure-test the range. In investor conversations, founders who get traction usually do two things well: they report their numbers accurately, and they explain clearly where the company sits within the range. Investors don't expect perfection - they expect discipline.
As the market shifts, the inputs need to shift too. Update valuation inputs as metrics and market conditions change. Lucid Financials can keep your books clean and your reporting investor-ready without extra headcount.
Used the right way, benchmarks make startup valuation a clear, defensible process investors can trust.
FAQs
How do I choose the right comps for my startup?
Choose comparable companies that match your startup’s business model, industry, and growth stage. Generic benchmarks often blur the picture and can hide the differences that matter in your operating metrics.
Focus on companies that line up with your main drivers. For SaaS, that usually means Annual Recurring Revenue. For fintech, look at Gross Transaction Volume. For e-commerce, zero in on transaction revenue.
Lucid Financials can help with real-time, objective benchmarking built into your financial workflows.
Which metrics matter most for benchmark-based valuation?
Investors zero in on metrics that show growth, financial health, and solid unit economics. The big ones are ARR, the LTV:CAC ratio, payback period, gross margin, and retention metrics like NDR and churn.
They also look at burn rate, cash runway, and revenue per employee to judge efficiency and scalability. Put together, these benchmarks help shape valuation and show that the business is run with discipline.
How often should I update my valuation benchmarks?
Update your valuation benchmarks when your financial performance changes in a meaningful way, when the market moves, or before a fundraising or strategy conversation. There’s no set timetable. The key is to treat benchmarks as something that should move with the business, not sit on a shelf and go stale.
Accurate, current financial reporting helps keep your valuation grounded, easier to defend, and ready for investor review.