Expanding into a new market is risky for startups. Scenario modeling helps manage this uncertainty by preparing for multiple possible outcomes instead of relying on a single forecast. This approach identifies risks tied to demand, pricing, regulations, and competition before committing resources.
Key Takeaways:
- Why it's critical: Startups operate with tight budgets, and errors in forecasting can derail growth. Scenario modeling reduces these risks by structuring uncertainty.
- How it works: Build "what if" scenarios using clean financial data to test different market conditions and outcomes.
- Core metrics to focus on: MRR growth, churn, CAC payback, gross margin, and cash flow.
- Actionable steps: Define clear goals, quantify constraints, and create separate financial models for the new market. Use sensitivity analysis to test key assumptions.
- Execution strategy: Use phased expansion (validation, scaling, broad rollout) and set triggers for quick decision-making based on performance.
Scenario modeling isn't about predicting the future - it's about being prepared for it. Startups that adopt this method make better decisions, avoid costly mistakes, and approach market expansion with confidence.
Setting Goals and Constraints for Market Expansion
Before diving into scenarios, you need two critical elements nailed down: what you're aiming to achieve and what could hold you back. Without these, your model risks becoming just a collection of random assumptions without direction.
Defining Measurable Expansion Goals
Vague goals like "increase revenue in a new market" won't cut it. Instead, set clear, measurable targets by focusing on three key breakeven thresholds:
- Unit Breakeven: Are individual accounts profitable?
- Operating Breakeven: Is the market's profit and loss statement in the black?
- Cash Breakeven: Has cumulative cash flow turned positive?
Each provides a unique perspective. For instance, a startup might achieve unit profitability within its first year but take 24–36 months to reach cash breakeven - especially if the new market operates with extended Net 90 payment terms instead of the domestic Net 30. Longer Days Sales Outstanding (DSO) can put a strain on liquidity, even when revenue looks solid.
"A geographic market entry business case is a decision instrument, not a finance artifact." - Umbrex
Another critical factor is ramp-up speed. Monitor how quickly you hit milestones like your first hire, first sale, or first renewal. Even if you meet your 18-month timeline, a slow ramp can drain cash reserves faster than anticipated.
With goals in place, the next step is identifying the constraints that could derail them.
Identifying Key Constraints
Expanding into new markets comes with its own set of limitations - usually tied to cash, personnel, or operational hurdles. Quantify these constraints upfront to make your model realistic.
- Cash Constraints: Calculate runway by dividing available cash by monthly burn.
- Hiring Constraints: Factor in fully burdened costs, which often add 30–40% to base salaries. For example, a senior engineer with a $150,000 salary may cost around $210,000 when you include taxes, benefits, and overhead.
- Regulatory and Legal Constraints: Setting up a legal entity in a new market can cost between $20,000 and $150,000. Ongoing compliance - like annual filings, audits, and local tax requirements - can add another $10,000 to $50,000 annually. These costs are fixed and often triggered by milestones, such as hiring your 10th employee or hitting revenue thresholds that require tax registration.
Turning Goals and Constraints Into Financial Metrics
Once you've defined your goals and constraints, it's time to translate them into actionable financial metrics. For SaaS startups, five key metrics typically drive the financial model:
| Metric | Strategic Objective | Input Owner |
|---|---|---|
| MRR Growth Rate | Tracks revenue trajectory and burn coverage | Head of Sales / CEO |
| Net Dollar Retention (NDR) | Measures revenue stability and growth | Head of Customer Success |
| CAC Payback Period | Evaluates sales efficiency and capital recovery | Head of Marketing |
| Gross Margin % | Indicates cash burn per revenue dollar | Head of Product / Ops |
| DSO | Manages working capital and liquidity | CFO / Finance Ops |
Keep in mind that new markets often come with challenges like lower conversion rates. For example, a CAC payback period that takes 10 months domestically might stretch to 13–15 months in a new market due to these inefficiencies.
sbb-itb-17e8ec9
Building a Financial Model That Supports Multiple Scenarios
Adjusting a Three-Statement Model for Expansion
Startups often mix new-market data with existing models, which can blur performance insights and make it hard to pinpoint what's truly happening in the new market. A better approach? Create a separate expansion module that integrates into the consolidated view. Picture this as four interconnected layers:
- Local P&L: Covers revenue and expenses tied to the new entity.
- Local balance sheet: Tracks receivables, payables, and local cash.
- Intercompany flows: Includes management fees, IP royalties, and cost recharges between the parent company and the new entity.
- Consolidated view: Offers a group-level P&L, balance sheet, and cash flow statement.
Keep the new market's P&L in its local currency, converting only during consolidation to avoid distortions from currency fluctuations. For the first 24 months, use monthly granularity instead of annual or quarterly buckets. This approach captures the critical entry dynamics that might otherwise get lost during the ramp-up phase.
These structural tweaks help align your model with the realities of geographic expansion.
Key Inputs for Entering a New Market
Centralize your assumptions and assign confidence ratings to critical drivers - this ensures scenario adjustments remain clean and easy to track.
Inputs naturally fall into a hierarchy. Tier 1 drivers - like net price after local discounts, adoption rates, and conversion rates - are the most critical. Small changes in these assumptions can ripple through the entire model. Below these are Tier 2 drivers, such as hiring pace and onboarding capacity, followed by less influential cost variables.
Headcount is especially vital when entering new markets. For example, a U.S. Sales Lead or Country Manager typically costs 1.25x–1.40x their base salary when fully loaded. Don’t forget to include expenses for office space, legal fees, and entity setup.
Also, account for Days Sales Outstanding (DSO). If your domestic model assumes Net 30 terms but the new market operates on Net 90, your working capital needs will increase, even if revenue appears strong.
Key Outputs to Monitor Across Scenarios
"Runway is the most important output of any scenario plan, but it is only as reliable as the input assumptions driving it." - Aleksandar Stojanovic, CEO & Founder at Fiscallion
A well-structured model delivers clear, actionable outputs. The table below shows how key metrics shift between base, bear, and bull scenarios, giving leadership a solid foundation for go/no-go decisions:
| Metric | Base Case | Bear Case Delta | Bull Case Delta |
|---|---|---|---|
| Net New ARR | $120K | -35% | +25% |
| Monthly Churn | 0.8% | +2.0pp | -0.2pp |
| Gross Margin | 72% | -5% | +3% |
| Monthly Burn | $680K | +8% | -5% |
Use breakeven milestones to assess each scenario's viability. These include:
- Unit breakeven: Are individual customers profitable?
- Operating breakeven: Is the new market's P&L positive?
- Cash breakeven: Has cumulative cash flow turned positive?
Identifying potential gaps early helps you avoid costly missteps before committing resources.
For teams seeking streamlined, consolidated financials across multiple entities without manual headaches, Lucid Financials provides CFO-level tools. Its built-in scenario modeling and real-time reporting keep your expansion model up to date as assumptions evolve.
With these outputs in hand, the next step is turning insights into practical strategies.
Designing and Comparing Expansion Scenarios
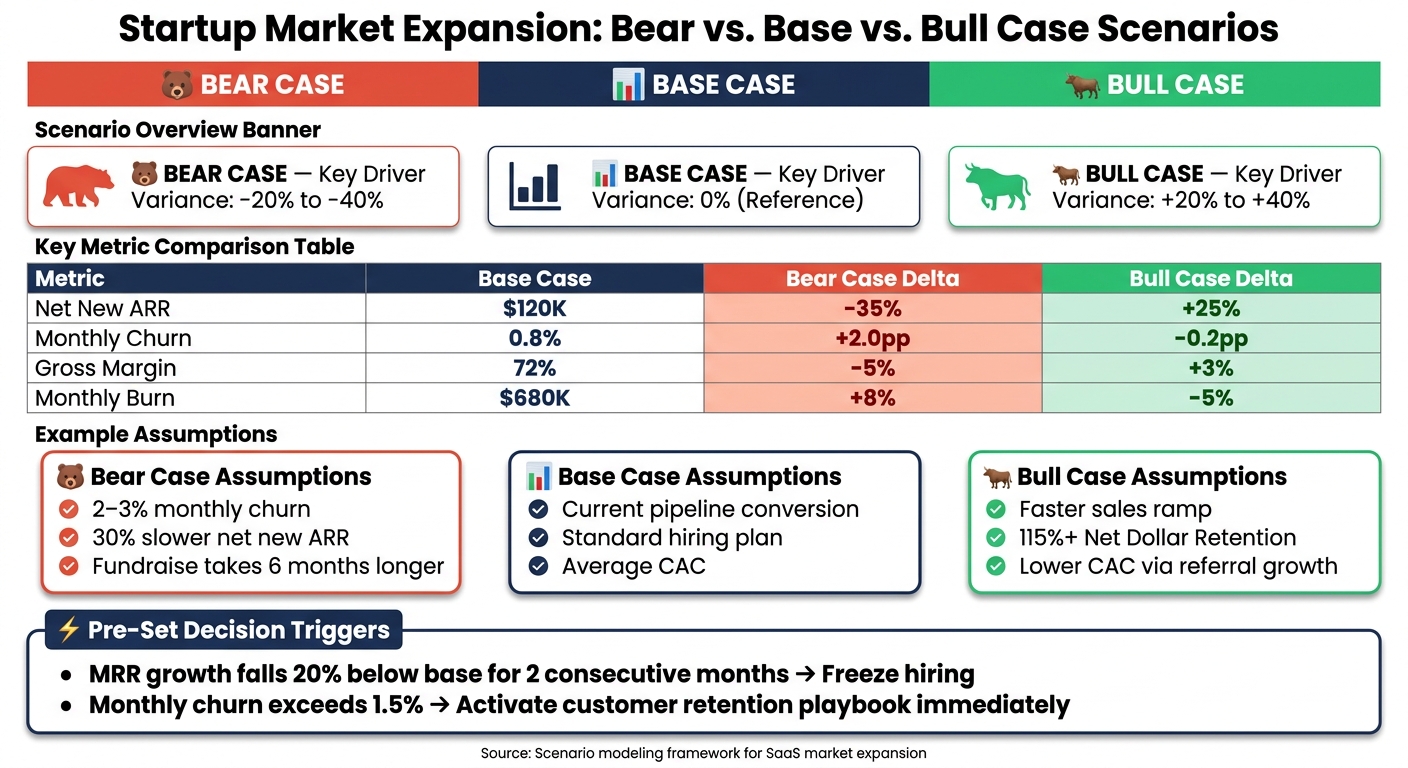
Startup Market Expansion: Bear vs. Base vs. Bull Case Scenarios
Defining Best, Base, and Worst-Case Scenarios
For startups stepping into new markets, defining and comparing different scenarios is a critical part of managing risks and making informed decisions. The goal here isn't to predict the future but to outline a range of possible outcomes so that leadership can act with clarity and confidence.
To build these scenarios, focus on Tier 1 drivers like net price, adoption rate, sales productivity, and regulatory timing. Keep the focus tight by limiting the analysis to five key drivers.
Here’s a breakdown of assumptions for each scenario, showing driver variances and examples:
| Scenario | Key Driver Variance | Example Assumptions |
|---|---|---|
| Base Case | 0% (Reference) | Current pipeline conversion, standard hiring plan, average CAC |
| Bull Case | +20% to +40% | Faster sales ramp, 115%+ Net Dollar Retention, lower CAC through referral growth |
| Bear Case | -20% to -40% | 2–3% monthly churn, 30% slower net new ARR, fundraise takes 6 months longer |
When modeling costs, treat them as fixed step functions. For instance, entering a new market often involves specific investments like hiring a compliance officer, adding a sales rep, or setting up a local office. These are discrete costs - not smooth, gradual increases. Using fixed percentages to model these expenses can lead to underestimating costs in the bear case and overestimating them in the bull case.
Using Sensitivity Analysis to Test Assumptions
Once your scenarios are mapped out, use sensitivity analysis to pinpoint which assumptions have the biggest impact on outcomes. Adjust one key input - say, by 10% - and see how that change affects runway and cash breakeven.
"Sensitivity analysis - testing which variables move runway most - is where scenario planning pays its biggest dividend. It tells you where to concentrate attention and where not to." - Fiscallion
For example, a 10% boost in MRR growth might extend your runway by four months, while a 10% increase in CAC could cut it by two months. This asymmetry is important. It shows where to focus efforts, like improving sales efficiency, and where you have more flexibility. Once you've ranked the impact of each driver, assign ownership to them. For instance, the Head of Sales might monitor pipeline conversion, while the Head of Customer Success tracks churn. This isn’t about assigning blame - it’s about ensuring someone is actively watching critical metrics in real time.
Armed with these insights, you’re ready to compare scenarios side by side.
Comparing Scenarios Side by Side
After validating assumptions through sensitivity analysis, lay out the scenarios for direct comparison. Track metrics across three key areas:
- Financial: ARR growth, CAC payback, cumulative cash burn, runway in months
- Operational: Sales productivity, conversion rates, headcount plans
- Market: Market share needed for breakeven, net price realized
Boards often focus on the cash breakeven line - it’s a clear indicator of funding needs and overall survival. If your bear case shows the business running out of cash before reaching breakeven, it’s a red flag. This could mean scaling back initial investments or securing additional funding before moving forward.
"If your bull case requires a market miracle and your bear case requires an extinction-level event, your scenarios are not useful." - Eagle Rock CFO
Beyond crunching numbers, establish a trigger-response protocol to guide decision-making. For example:
- If MRR growth falls 20% below the base case for two consecutive months, freeze hiring.
- If churn exceeds 1.5% monthly, activate a customer retention playbook immediately.
Having these pre-set triggers ensures quick, decisive action when market conditions shift. Tools like Lucid Financials can streamline this process by offering real-time insights and automating reporting, making it easier to execute your trigger-response plans with precision.
Moving From Scenario Analysis to Execution
Matching Scenario Outputs to Strategic Goals
Scenario planning only works if it aligns with what your startup can realistically handle. Before diving into any growth strategy, assess your scenario results against three key constraints: available runway, team capacity, and operational throughput. For example, revenue projections are meaningless if your sales team can’t manage the increased pipeline or if your support staff is already overwhelmed.
Use your base case as the foundation for your operating plan. Avoid making hiring or budgeting decisions based on overly optimistic scenarios. Here’s a practical approach: the base case becomes your operational blueprint, the bull case justifies additional hires (triggered only when net dollar retention surpasses 115% for two consecutive months), and the bear case outlines cost-cutting measures.
"The version of a founder who builds a scenario plan months in advance is always more rational than the version staring down an active crisis." - Aleksandar Stojanovic, CEO & Founder, Fiscallion
To stay adaptable, break your expansion costs into three categories:
- Committed: Essential expenses for compliance and baseline operations.
- Growth: Investments that kick in once unit economics are validated.
- Optional: Costs that can be deferred if needed.
This kind of categorization ensures you can pivot quickly if market conditions shift. Aligning scenario outputs with these strategic constraints creates a solid foundation for phased, lower-risk growth.
Building a Phased Expansion Plan
When entering new markets, it’s smart to roll out in stages, with clear conditions set for advancing to the next phase:
- Tranche 1 - Validation: Start small by launching a minimal operation in one city or segment. This allows you to test assumptions with real customers before scaling up.
- Tranche 2 - Beachhead Scaling: Once you’ve proven the unit economics, invest further to grow the team and expand your customer base.
- Tranche 3 - Broader Expansion: After refining your playbook, move into adjacent markets or segments.
A great example is Tesla. Before committing to local production in Europe, they exported U.S.-made vehicles to test international demand.
Assign ownership of key assumptions to specific team members. This ensures immediate action when predefined triggers are met. Tools like Lucid Financials can help by offering real-time financial tracking and investor-ready reporting. This makes it easier to monitor whether each phase is meeting its release conditions without waiting for a monthly review.
Comparing Expansion Strategies
Once you’ve outlined your phased plan, the next step is choosing the right expansion strategy. Your decision will depend on factors like available capital, the level of control you want, and the speed at which you need to act. Here’s a breakdown of the main strategies:
| Strategy | Pros | Cons | Best When |
|---|---|---|---|
| Aggressive (Acquisition, Greenfield) | Rapid entry; full control; immediate scale | High capital demands; significant integration risks | Speed is critical, and you have ample capital |
| Conservative (Licensing, Partnerships, JV) | Lower financial risk; benefits from local expertise; tests market demand | Limited control over brand and pricing; slower growth; shared rewards | Capital is tight, or regulations are complex |
| No-Expansion (Strategic Pause) | Conserves resources; avoids overextending; minimizes risky assumptions | May lose first-mover advantage; potential stagnation | Market share goals are unrealistic, or the business isn’t ready to scale operationally |
Interestingly, about 30% of market entry analyses result in a recommendation to hold off on expansion. Choosing not to expand isn’t a failure - it’s often the smartest financial move. As the Umbrex Geographic Market Entry Playbook puts it:
"If the plan requires a heroic ramp, say so and propose a smaller, staged commitment that earns the right to scale."
Ultimately, success comes from executing a scenario-backed strategy that fits your current resources and constraints.
Conclusion: Making Confident Market Expansion Decisions With Scenario Modeling
Expanding into a new market is no small feat. Scenario modeling takes the uncertainty out of the process by replacing guesswork with structured, data-driven insights. By creating bear, base, and bull case scenarios and analyzing key factors like MRR growth, churn, and CAC, your leadership team can approach market entry with a clear, logical framework for decision-making.
Pre-planned trigger actions, such as rolling out a retention playbook if churn surpasses 1.5%, help avoid last-minute, reactive decisions. This proactive strategy ties seamlessly into earlier efforts to define measurable goals and constraints for expansion, keeping your team focused and aligned as circumstances shift.
The foundation of these decisions lies in the quality of your financial data. Accurate, real-time insights are essential, and tools like Lucid Financials provide just that with real-time bookkeeping, AI-driven forecasts, and investor-ready reports. Monthly updates ensure your data reflects the latest business conditions, enabling smarter decision-making.
"Ownership isn't about accountability for the result. It's about accountability for the signal." - Aleksandar Stojanovic, CEO & Founder, Fiscallion
With scenario modeling, you can approach market expansion with confidence. This evidence-based approach not only strengthens investor trust but also safeguards your runway and ensures your team remains aligned, even as market conditions evolve.
FAQs
What should I model first for a new market?
To succeed in a new market, start by defining clear, measurable goals. These could include specific metrics like sales targets, customer acquisition numbers, or market share percentages. Pair these with realistic timelines and focus on identifying the target customer segments you want to reach.
Once your goals are set, collect essential market data to shape your strategy. Key areas to research include:
- Market size: Understand the potential scale of the opportunity.
- Customer behavior: Dive into preferences, buying habits, and decision-making processes.
- Competition: Study your competitors’ strengths, weaknesses, and market positions.
- Financial indicators: Look at revenue drivers and profitability metrics to gauge the financial viability of your plan.
This combination of clear objectives and informed research will lay a solid foundation for your market entry strategy.
How do I choose bear, base, and bull assumptions?
Start by pinpointing 3–5 critical factors that influence your startup's success. These could include metrics like customer acquisition cost, revenue growth, or churn rate. Use current data and available resources to establish your base case - essentially, the most likely scenario based on existing trends.
Next, develop your bear and bull cases by modeling realistic variations. Typically, this involves adjusting your key variables within a range of 15% to 40%. For example, in a bear case, you might project higher acquisition costs or slower revenue growth, while a bull case could assume the opposite.
These scenarios aren't just theoretical - they should inform specific, pre-determined actions or contingency plans. Whether it's preparing for risks or capitalizing on opportunities, having a clear roadmap for each scenario ensures you're ready to adapt.
What triggers should tell me to pause or scale expansion?
Monitoring key triggers can help you decide when to either pause or scale your expansion efforts.
- Pause if your financial health is at risk. This includes situations where your runway drops below 12 months, your cash reserves can no longer cover 9–12 months of operating costs, or if revenue growth slows significantly - such as less than 5% over a 3-month period.
- Scale when the numbers show clear signs of progress. For example, if inbound demand consistently accounts for more than 15% of your pipeline or if you’ve maintained 12 months of steady net profit, it may be time to expand.
Tools like Lucid Financials make it easier by tracking these metrics in real time, giving you the data you need to make informed decisions.