Yes - automated reporting can pay back fast for startups. From the data in this article, teams often cut reporting work by 40%–80%, shorten close time by 55%–80%, reduce errors by around 70%+, and see payback in about 3 to 6 months.
If I boil it down, the ROI usually comes from four places:
- Time back for founders and finance staff
- Lower labor cost and delayed finance hires
- Faster close and more current cash data
- Cleaner investor and board reporting
A simple way to think about it: if a startup spends about $17,400 per year on software and setup, but avoids over $100,000 in labor, cleanup, and hiring cost, the return can be very high.
Here’s the short version:
- Manual spreadsheets work at first, then start to slow the team down
- Automation cuts repetitive reporting work and manual fixes
- Early-stage startups get the most from saved founder time
- Growth-stage startups get the most from faster close and better forecasting
- Errors matter too: one bad board number or filing mistake can cost money and trust
This article shows where the return comes from, which metrics matter by stage, and how I’d think about a simple 12-month ROI model before making the switch.
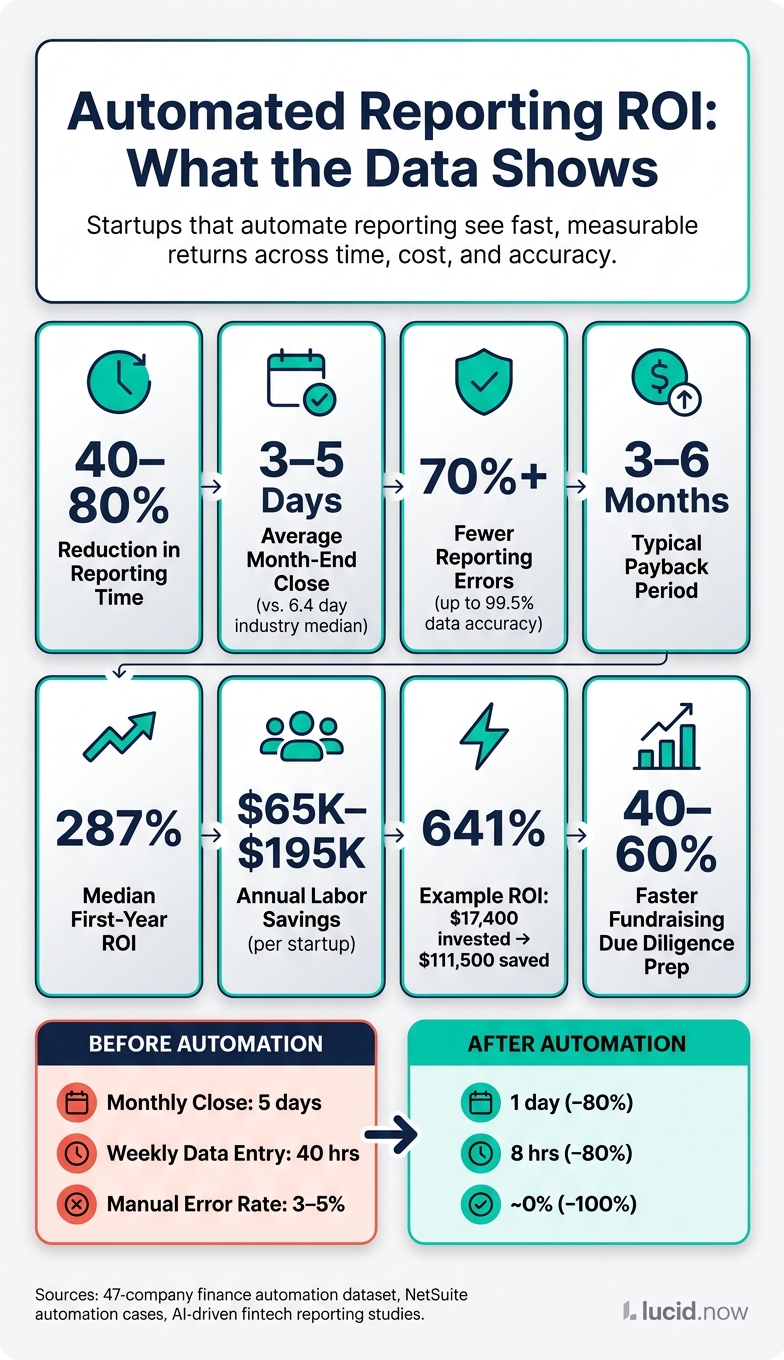
ROI of Automated Reporting for Startups: Key Metrics at a Glance
What the research shows on time savings, cost reduction, and close speed
Across studies and case summaries, the pattern is hard to miss: automated reporting saves time, cuts labor costs, and speeds up the close. When startups move away from manual spreadsheets, they get hours back, spend less, and finish the books faster.
Time saved on monthly reporting and finance operations
Study after study shows 40–80% cuts in time spent on core finance workflows after automation. Work that used to take about 20 hours a month for financial reporting drops to about 8 hours. That’s roughly 12 hours saved each month. Month-end close work that once took around 40 hours falls to about 18 hours, or a 55% drop in time.
Close speed shows the same pattern. Teams using automated and AI-enabled workflows often close in 3–5 days, while APQC’s cross-industry median sits at 6.4 days. One study found that finance teams using generative AI cut an average of 7.5 days from their monthly close. In NetSuite automation cases, financial reporting time fell from six days to one, and management reporting cycles dropped from 16 hours to 4 hours - a 75% reduction.
Lower reporting costs and fewer finance errors
Those time cuts turn into meaningful labor savings. Across a sample of 47 companies, a 62% average reduction in time across finance processes worked out to about $65,000–$195,000 in yearly savings for U.S. startups of similar size. A fintech reporting case focused on AI-driven workflows points to $45,000 in yearly savings from automating up to 80% of manual reporting work.
There’s another piece here that matters just as much: fewer errors. AI and RPA workflows reach about 99.5% data-entry accuracy. That’s a big jump from the slipups that tend to show up in manually managed spreadsheets. For a startup, one mistake in a board deck, tax filing, or investor data room can damage trust fast. Fewer manual handoffs mean less reporting risk.
ROI metrics summary table
The strongest reported metrics are below.
| Study or Case | Startup Stage | Reporting Time Savings | Close Cycle Improvement | Error Reduction | Annual Savings (USD) | Reported ROI | Payback Period |
|---|---|---|---|---|---|---|---|
| 47-company finance automation dataset | Early to growth stage | 60–69% time reduction | 55% month-end close time reduction | 73% fewer errors | $65,000–$195,000 | 5–10× | 6–12 months |
| AI-driven fintech reporting case | Growth stage | ~80% of manual work automated | Not reported | Not specified | ~$45,000 | - | - |
| NetSuite management reporting automation | Growth stage | 75% (16 hrs → 4 hrs/month) | Financial reporting: 6 days → 1 day | Not quantified | - | - | - |
| SaaS startup, spreadsheets → Odoo ERP | Early to growth stage | ~60% | 11 days → 4.4 days | Not quantified | - | - | - |
The next section breaks these results down by startup stage.
sbb-itb-17e8ec9
Case study patterns from early-stage and high-growth startups
These cases make the averages feel a lot more concrete. You can see where the time goes, what changes first, and why teams stop leaning so hard on spreadsheets.
Early-stage startups moving away from founder-led spreadsheet reporting
Early-stage startups often get the fastest wins by cutting spreadsheet work. That usually means less manual data entry, fewer reconciliations, and fewer founder hours spent stitching reports together.
The time savings can be stark. Weekly manual data entry dropped from 40 hours to 8 hours, which is an 80% reduction. Manual error rates also fell from 3–5% to near zero after automated checks and reconciliations. On top of that, automation saved about 200 hours per year on routine tasks.
For a small team, that kind of shift matters. It can mean fewer late-night reporting sessions and more time spent on sales, hiring, or product work.
Growth-stage teams cutting close cycles and improving board reporting
As startups grow, the payoff changes. The story stops being just about saved hours and starts being about faster closes, more current forecasts, and better visibility for leadership.
High-growth teams moved from quarterly spreadsheet forecasts to weekly forecasts with real-time cash-flow insight. In a 2026 case, fintech startup SpendWise Solutions connected its CRM, billing system, and bank feeds to an automated AI system. That setup saved 200 hours per year on manual forecast updates and gave the team instant scenario analysis for hiring and marketing.
The board reporting piece changed too. Decks that once took days to pull together were produced in minutes using updated projections. That’s a big shift, especially when leadership needs answers on the spot.
Before-and-after case metrics table
The clearest changes show up in the side-by-side metrics below.
| Metric | Before Automation | After Automation | Percent Change |
|---|---|---|---|
| Monthly close time | 5 days | 1 day | −80% |
| Weekly data entry hours | 40 hours | 8 hours | −80% |
| Annual routine task hours | 200 hours | 40 hours | −80% |
| Forecast frequency | Quarterly | Weekly | +300% |
| Manual error rate | 3–5% | Near 0% | ~−100% |
| Board report prep time | Hours to days | Minutes | Not quantified |
How startups can calculate ROI from automated reporting
You can turn the time savings, fewer errors, and faster close into a simple 12-month ROI model.
The core ROI formula and startup inputs to track
The formula is straightforward:
ROI (%) = (Net Benefit ÷ Total Investment) × 100
Net Benefit means 12-month savings plus avoided costs. Total Investment means setup costs and monthly or annual fees.
To make this useful, track four main inputs.
- Labor savings: Take the hours saved and convert them into dollars using fully loaded hourly rates.
- Cleanup and rework avoidance: Add year-end book fixes, pre-fundraise cleanups, and CPA rework. A single cleanup project can cost $8,000 to $15,000.
- Avoided hiring: If automated reporting helps you push back a controller hire with a $150,000 base salary and a 25% load by 12 months, the avoided fully loaded cost is about $187,500 over that period.
- Filing penalties and CPA rework: IRS and state penalties for late or inaccurate filings usually range from $500 to $2,500 per incident, and CPA rework often bills at $150 to $350 per hour. One example cuts annual rework, CPA time, and penalties from $9,200 to $1,800, or about $7,400 in avoided cost.
Put all of that together and the math can get pretty eye-opening. A startup spending $17,400 per year on an automated reporting platform - $1,200 per month plus a $3,000 setup fee - and saving $111,500 in labor, cleanup, and hiring deferral would see an ROI of about 641%, with a payback period of roughly 1.9 months.
Which ROI drivers matter most by company stage
The formula stays the same. What changes is where the value comes from.
For Pre-seed and Seed startups, founder time and investor readiness usually matter most. At this stage, the founder often acts as the de facto CFO. Every hour spent on reconciliations is an hour pulled away from sales or product work. If freeing up 20 hours per month helps a founder close one extra $25,000/year contract, that added revenue should go into the ROI model. Clean, GAAP-compliant books can also reduce friction in fundraising and help investors move through financial due diligence faster.
For Series A and Series B companies, the focus tends to shift to close speed, forecast accuracy, and board readiness. Here, the big gains usually come from shorter closes, fewer mistakes, and faster board-ready reporting. Getting reliable numbers sooner can shape hiring plans, marketing spend, and runway decisions while the company grows.
ROI driver reference table for founders
| ROI Driver | KPI to Measure | Financial Impact Type |
|---|---|---|
| Labor savings | Hours/month on close and reporting | Direct cost reduction |
| Faster close | Days to complete monthly close | Decision speed, investor readiness |
| Lower error rate | Material errors per quarter | Avoided rework, CPA fees, penalties |
| Audit/tax readiness | Cleanup project spend per year | Avoided external spend |
| Investor readiness | Time to complete financial due diligence | Faster fundraising, avoided bridge financing |
| Forecasting speed | Forecast update frequency | Better capital allocation decisions |
Once you know which drivers matter most, you can choose the automation model that gives you the biggest return.
How startups implement automated reporting
Knowing which ROI drivers matter most is only half the job. The other half is choosing the setup that helps you get those gains in practice. That choice usually comes down to where the biggest win is: saving founder time, speeding up the close, or cleaning up board reporting.
Software-first automation for close, dashboards, and recurring reports
A common setup starts with a cloud accounting system tied to bank accounts, payment processors, payroll, and expense tools. From there, a reporting or FP&A layer pulls live data and refreshes dashboards, board decks, and variance reports on a set schedule.
The upside is pretty clear: faster close, cleaner dashboards, and fewer spreadsheet mistakes.
But software, on its own, won't clean up messy inputs. If the chart of accounts is disorganized or reconciliations are uneven, automation just moves bad data through the system at higher speed. That's why the best setups include review checkpoints before anything lands in a board deck or investor update.
Outsourced and hybrid finance support for lean teams
When transaction volume is still low and the finance team is thin, software is only part of the picture. Process ownership matters just as much.
For startups without an in-house finance team, pairing automation with outsourced bookkeeping, tax, or CFO support can improve reporting quality and take work off the founder's plate. This setup helps keep overhead down while making sure reports stay accurate.
It's an approach you see a lot in early-stage and lean growth-stage companies. The reporting needs are there, but the headcount budget usually isn't.
Where Lucid Financials fits for startup reporting automation

Lucid Financials supports this hybrid model with AI-powered bookkeeping, tax, tax credits, and CFO support reviewed by finance professionals. It delivers clean books in seven days, board-ready reports and investor-grade forecasts on demand, and Slack access for questions on runway, burn, and spend.
For startups that want automated reporting without giving up human review, that setup makes a lot of sense.
Conclusion: What the evidence says about startup reporting automation
Applied to the ROI model above, the data shows a pretty clear pattern: automated reporting pays off through faster closes, less manual work, fewer errors, and stronger investor readiness. Studies often report 40–70% less manual reporting work, 5–7 day closes, and 70–85% fewer errors. One startup-focused ROI analysis found a median first-year ROI of 287% with a payback period of just 4.3 months, driven by labor savings, fewer errors, and delayed finance hiring.
The upside is biggest when reporting happens often, the finance team is stretched thin, and leaders rely on current numbers to make decisions. That payoff hits hardest in early-stage and high-growth startups, where every hour saved and every day shaved off the close can shape the next move right away.
Fundraising adds another layer. Automated financials can cut due-diligence prep time by 40–60% and help teams respond to investors faster. When a VC asks for updated financials or KPIs, a fast response sends a message: the company has its act together. At that point, the gain is no longer just about operations. It starts to affect how the business is seen.
If spreadsheets are slowing down close, reporting, or investor updates, automation is overdue.
FAQs
How do I estimate ROI for my startup?
Estimate ROI by weighing the value of time saved and mistakes avoided against the cost of automated financial reporting. Start by measuring how many hours your team spends on bookkeeping, reconciliations, and reports. Then put a dollar amount on that time so you can see what you get back.
It also helps to count the cost of fewer errors, missed tax credits, and duplicate payments. On top of that, faster, investor-ready reporting has its own payoff. Lucid Financials supports this by bringing together real-time bookkeeping, tax services, and CFO support in one platform.
When should a startup automate reporting?
A startup should automate financial reporting once manual work starts slowing the team down or creating risk.
That usually shows up in a few clear ways: reports get delayed, updates include errors, or pulling data takes more than two hours per cycle. At that point, the process isn’t just annoying. It’s eating time and making mistakes more likely.
It also makes sense to automate when the team is spending 40–80 hours per quarter on manual entry or reconciliation. That’s a big chunk of time to burn on work that software can handle with far less friction.
Automation also becomes the smart move when investor-ready financials need to be turned around within 5–7 days after month-end. If that deadline keeps looming and the process still depends on spreadsheets, copy-paste work, or last-minute cleanups, the cracks start to show fast.
What metrics should I track after automating?
To measure ROI, start by comparing current results with your pre-automation baseline. Look at costs, processing time, error rates, and revenue first. That gives you a clean before-and-after view instead of relying on guesswork.
Then track changes in the metrics that show whether automation is paying off:
- Manual labor hours
- Error rates
- Monthly close time
- Cash flow
- Burn rate
- Runway
- Sales growth
- Conversion rates
- Customer lifetime value
- Productivity per employee
- Investor confidence
- Staff satisfaction
If those numbers move in the right direction, you’re not just saving time. You’re seeing the business impact in day-to-day finance, growth, and team performance.