Want to know how your startup is performing right now? Real-time dashboards provide live insights into key metrics like cash position, burn rate, and runway - giving you the data you need to make fast, informed decisions. Forget outdated spreadsheets; these tools integrate with your systems to deliver accurate, up-to-the-minute financial updates.
Key Features to Look For:
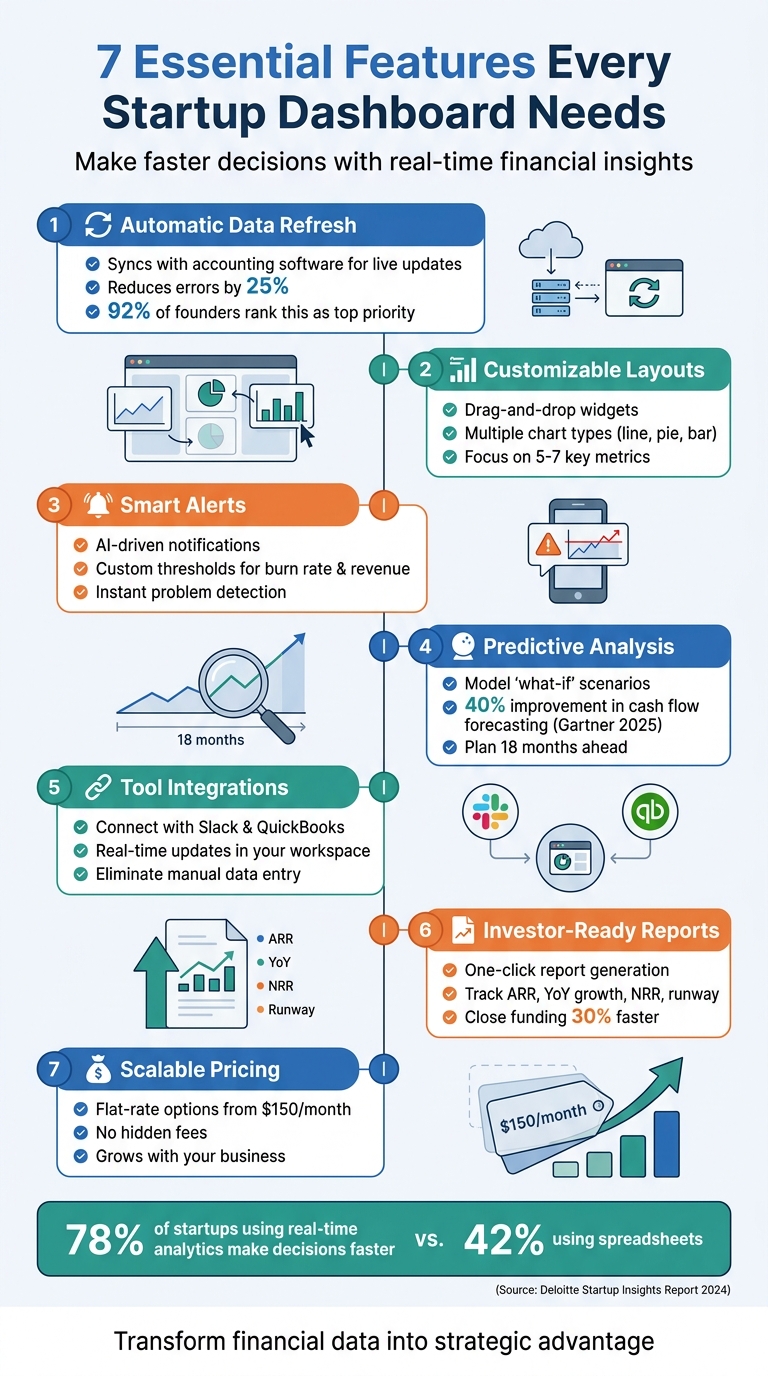
- Automatic Data Refresh: Syncs with accounting software for live updates, reducing errors by 25%.
- Customizable Layouts: Choose charts and widgets that match your needs.
- Smart Alerts: Get instant notifications for issues like rising burn rates or revenue dips.
- Predictive Analysis: Model scenarios like hiring or revenue slowdowns to plan months ahead.
- Tool Integrations: Connect with Slack and QuickBooks for seamless updates and collaboration.
- Investor-Ready Reports: Generate polished reports instantly for fundraising or board meetings.
- Scalable Pricing: Look for flat-rate options starting at $150/month with no hidden fees.
Startups using real-time dashboards make decisions faster and can secure funding more efficiently. The right dashboard not only tracks performance but also helps you anticipate challenges and opportunities as your business grows.
7 Essential Real-Time Dashboard Features for Startups
Core Features Every Startup Dashboard Needs
Automatic Data Refresh
When it comes to dashboards, automatic data refresh is a must-have. Your dashboard should sync seamlessly with accounting software and bank feeds, ensuring real-time updates. This means key metrics like cash position, monthly recurring revenue, and burn rate are refreshed frequently - no more waiting for manual updates at the end of the month. Why is this so important? Startups thrive on timely decisions, and up-to-date data is the backbone of that.
The 2025 Startup Genome Report found that manual updates lead to 25% higher error rates in financial reporting. In contrast, 92% of founders rank auto-refresh as a top priority. When your dashboard pulls data directly from your systems, you get a live feed of actual transactions. This allows you to catch red flags - like a sudden expense spike - before they snowball into bigger problems that could jeopardize your runway.
Flexible Layouts and Charts
A good dashboard isn’t just about data - it’s about how you see it. Flexibility is key. Whether you’re a founder prepping for a board meeting or an operations manager monitoring spending, your dashboard should adapt to your needs. Customizable layouts let you drag and drop widgets, choose between different chart types (like line graphs for trends or pie charts for breakdowns), and focus on the 5–7 metrics that matter most at your current stage.
Exportable visuals also make investor reporting a breeze. The goal? A dashboard that works for you, not one that forces you into a rigid template. Add timely alerts and forecasts, and you’ve got a tool that’s as strategic as it is functional.
Smart Alerts and Predictive Analysis
Imagine getting an instant alert when your burn rate spikes or revenue takes an unexpected dip. That’s the power of smart alerts. With AI-driven notifications, you can set custom thresholds tailored to your startup’s needs. For example, early-stage startups might want alerts when runway drops below six months, while growth-stage companies could monitor rising customer acquisition costs. These real-time updates mean problems don’t catch you off guard.
Predictive analysis takes things a step further. It allows you to model "what-if" scenarios. Want to know how hiring five new engineers impacts your runway? Or what happens if revenue slows next quarter? Predictive tools give you those answers. According to Gartner, AI-driven analytics improved cash flow forecasting accuracy by 40% for early-stage companies in 2025. This transforms your dashboard from a tool that reports the past into one that helps you plan for the future.
sbb-itb-17e8ec9
Construct a KPI Dashboard for Your Startup Business Online
Integration and Team Collaboration
Expanding on real-time analytics, integrating your dashboard with other tools and fostering team collaboration can amplify its usefulness across your organization.
Slack Integration for Instant Updates
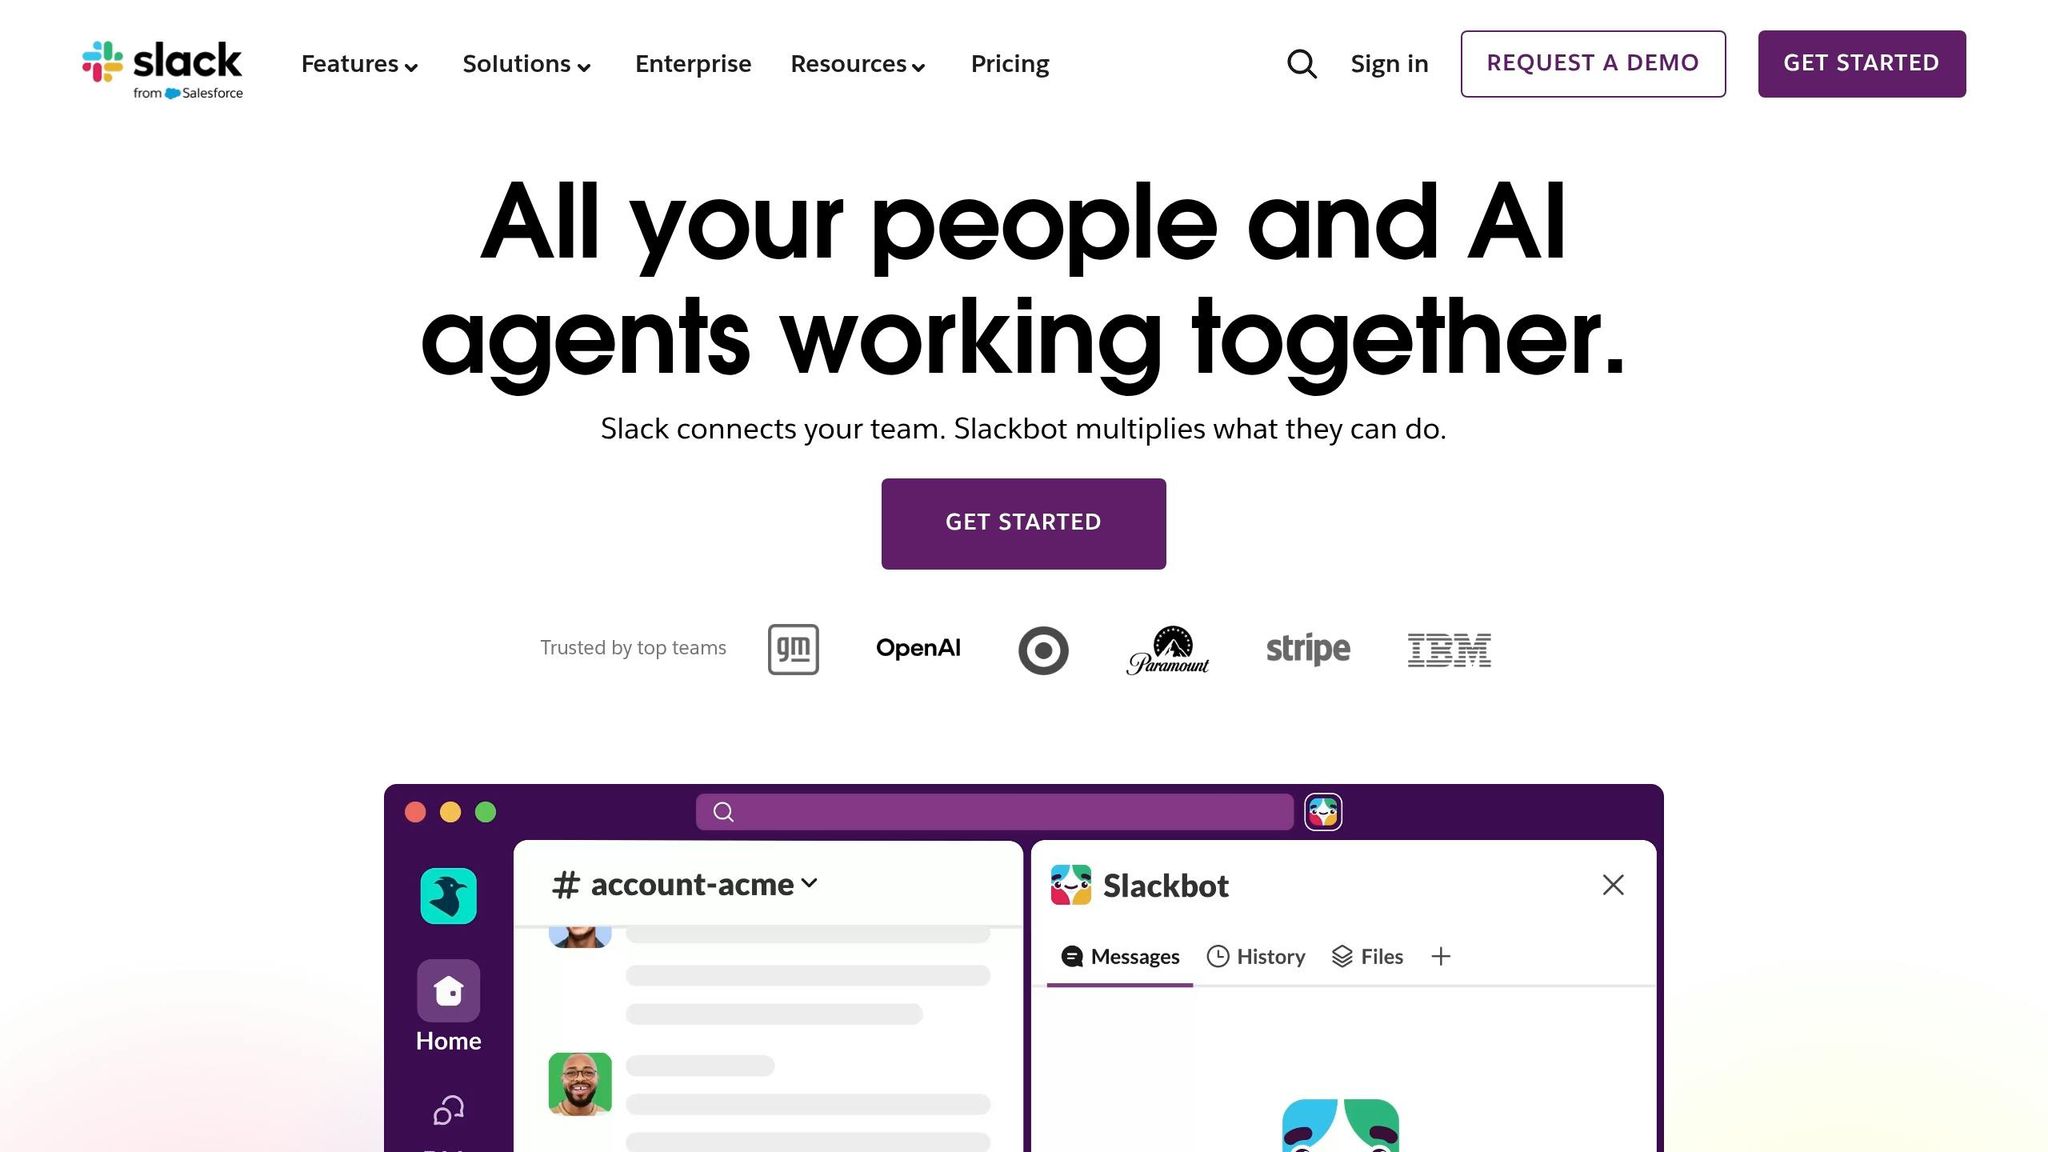
Imagine accessing financial insights right in your team’s workspace. With Slack integration, your financial data becomes part of your daily communication flow. You can ask questions like, "What's our current runway?" and get answers instantly - without switching tabs or applications.
This setup reduces friction and keeps everyone informed. Dashboards that connect with tools like Slack can automate alerts for key events. For instance, they might notify you when your burn rate crosses a certain threshold or when a significant payment clears. Take Lucid Financials as an example: it integrates with Slack to provide real-time updates on cash position, spending, and overall performance. Routine queries are handled by AI, while financial experts are available for more complex discussions.
This kind of integration ensures your team can respond quickly to financial updates and make informed decisions without delay.
Accounting Software Connections
Seamless integration with accounting platforms like QuickBooks is another game-changer. When your dashboard syncs automatically with your accounting software, it eliminates the need for manual data entry, reducing errors and saving time.
A streaming-first architecture ensures real-time transaction updates, giving you accurate insights into revenue, expenses, and cash flow. This also avoids common ETL (Extract, Transform, Load) delays, delivering cleaner data more efficiently. Tools that support standard SQL interfaces make it easier to connect with your existing SaaS tools, streamlining the process even further. These automatic updates build confidence in the accuracy and reliability of your data.
Fundraising Reports and Growth Capacity
Startups today need tools that not only provide real-time data but also grow alongside their expanding operations. A well-designed dashboard can streamline investor communications and provide insights that scale with your business.
Instant Investor Reports
When it’s time for board meetings or investor updates, having instant, polished reports is a must. Your dashboard should allow you to generate detailed, investor-ready reports with just a single click.
A unified data source is key here. By pulling together information from your CRM, billing systems, HRIS, and product analytics tools, the dashboard ensures consistency across departments, eliminating discrepancies that could raise red flags for investors.
"Transparency wins trust, and trust wins funding." – Johnnie Walker, Co-Founder of Rooled
Focus on the metrics that matter most. For board-level discussions, this typically includes ARR, YoY growth, cash position, net revenue retention (NRR), and runway. Using a simple color-coded system - green for on-target results, yellow for metrics that are within 10% of the goal, and red for major gaps - paired with 6–12 months of trailing data helps investors quickly grasp your company’s performance.
As investor expectations evolve, your reporting tools need to keep pace, offering dynamic insights that grow with your business.
Built to Scale with Your Business
As your startup expands, your dashboard should transition from focusing on daily operational data to delivering high-level strategic summaries. This means incorporating features like KPI cards, trend charts, and actionable insights, all organized within a structured hierarchy that allows for both overviews and deeper dives.
Predictive capabilities become increasingly important as you scale. AI-powered dashboards, for example, can forecast your runway up to 18 months ahead. These tools let you model scenarios like hiring pauses or targeted fundraising efforts, shifting the focus of investor conversations from past performance to future opportunities.
Platforms such as Lucid Financials are designed to grow with startups, offering AI-driven, investor-ready reporting that adapts to your needs from pre-seed funding all the way to Series C.
Finding the Right Dashboard Within Your Budget
Choosing a dashboard that fits your budget while meeting your needs is essential. For startups, affordability and clear pricing often matter just as much as advanced features.
Clear, Predictable Pricing
Look for platforms with flat-rate pricing starting at around $150 per month. This pricing model simplifies budgeting by eliminating unexpected charges. Be cautious of hidden costs, especially if the platform requires third-party tools like Zapier or Make to integrate with accounting software such as Xero, QuickBooks, or FreshBooks. These tools can add an extra $50 to $100 per month.
Also, pay attention to user-based pricing. Some platforms charge per user or role, which can lead to higher costs as your team expands.
For example, Lucid Financials offers flat-rate pricing starting at $150 per month, free of hidden fees. It integrates automatically with QuickBooks and provides real-time support through Slack, saving you from additional expenses on third-party tools.
Matching Features to Your Stage
Focus on the features you need right now, like monitoring your cash position, burn rate, and runway. Avoid paying for advanced tools that your startup may not require at this stage. Connor Jeffers, Founder and CEO of Hapily, highlights the importance of simplicity:
"The Pilot application makes it really easy to get to the information I care about, as opposed to taking screenshots of QuickBooks and then emailing people back and forth".
Take advantage of free trials to test how well the platform integrates with your existing tools and whether it fits seamlessly into your workflow .
Finally, weigh the decision between building a custom solution and buying an off-the-shelf platform. While no-code platforms allow for customization, they often demand significant setup time. For most startups, a ready-made solution with scalability is the smarter choice. It ensures your dashboard evolves with your business without the hassle of a complete system overhaul as you grow. This approach keeps costs manageable while providing the insights you need to succeed.
Conclusion
The right real-time dashboard can completely change how startups handle their finances. With live data updates, flexible infrastructure, and investor-ready reporting, startups can make decisions faster and more effectively. This level of real-time insight lays the groundwork for growth and smooth integration with other tools.
According to the Deloitte Startup Insights Report (2024), 78% of startups using real-time analytics make decisions faster compared to just 42% relying on static spreadsheets. This speed is critical for tasks like monitoring cash flow, keeping an eye on burn rate, or adjusting strategies based on current performance. Dashboards with automatic updates and smart alerts help catch issues like unexpected expense spikes or revenue dips early, reducing the risk of cash flow problems.
As your startup expands, your dashboard should grow with you - whether it’s moving from managing a small team to overseeing multi-entity reporting and forecasting. During fundraising, investor-ready reporting becomes a game-changer. Startups equipped with real-time dashboards can close funding rounds up to 30% faster because live metrics instantly build investor confidence.
Integrations with tools like accounting software and Slack ensure everyone on your team works from the same real-time data. For example, Lucid Financials offers real-time answers through Slack and provides investor-ready reporting, starting at $150 per month with no hidden fees.
FAQs
How real-time is 'real-time' for these dashboards?
Real-time dashboards are designed to provide updates as soon as new data is available. This means you can access insights almost instantly, with some dashboards reflecting changes in mere seconds or minutes. The purpose? To ensure you always have the latest information at your fingertips for making informed decisions.
Which metrics should I track at my startup stage?
At the startup stage, it's crucial to keep an eye on specific metrics that provide a clear picture of your financial health and operational efficiency. These include cash flow, burn rate, revenue growth, and unit economics. Together, they help you understand how well your business is managing its resources and scaling.
On the customer side, tracking metrics like customer acquisition cost (CAC), lifetime value (LTV), and churn rate is equally important. These numbers reveal how effectively you're attracting and retaining customers and offer insight into your growth potential.
To stay on top of these metrics, use a real-time dashboard. It should be straightforward yet detailed enough to spot trends and anomalies quickly. This kind of setup supports fast decision-making, aligns your team, and builds investor confidence.
What integrations do I need for accurate numbers?
To keep your financial records accurate and up-to-date, link essential data sources like accounting software, banking platforms, payroll systems, and communication tools such as Slack. These integrations ensure smooth updates and help maintain consistent, trustworthy financial records for your business.