Startups that track their key metrics using dashboards grow faster and make better decisions. Here's why: dashboards consolidate vital data like revenue, burn rate, and customer acquisition costs into one place, enabling quick, informed choices. Tools like Lucid Financials help founders monitor financial health, automate reporting, and improve investor confidence.
Key Takeaways:
- Faster Decisions: Startups using dashboards make decisions 5-10x faster than manual methods.
- Improved Financial Clarity: Dashboards track metrics like burn rate, runway, and MRR, reducing forecasting errors by 50%.
- Investor Confidence: Transparent reporting boosts investor trust by 28%.
- Cost Efficiency: Automates reports and integrates with tools like Slack to save time and resources.
Monitoring metrics like MRR, ARR, CAC, and churn rate ensures startups stay on track for growth. Dashboards simplify complex data, helping founders focus on scaling their business instead of firefighting financial issues.
How to Build Finance Dashboards With AI in Minutes
sbb-itb-17e8ec9
Key Metrics to Track for Startup Growth
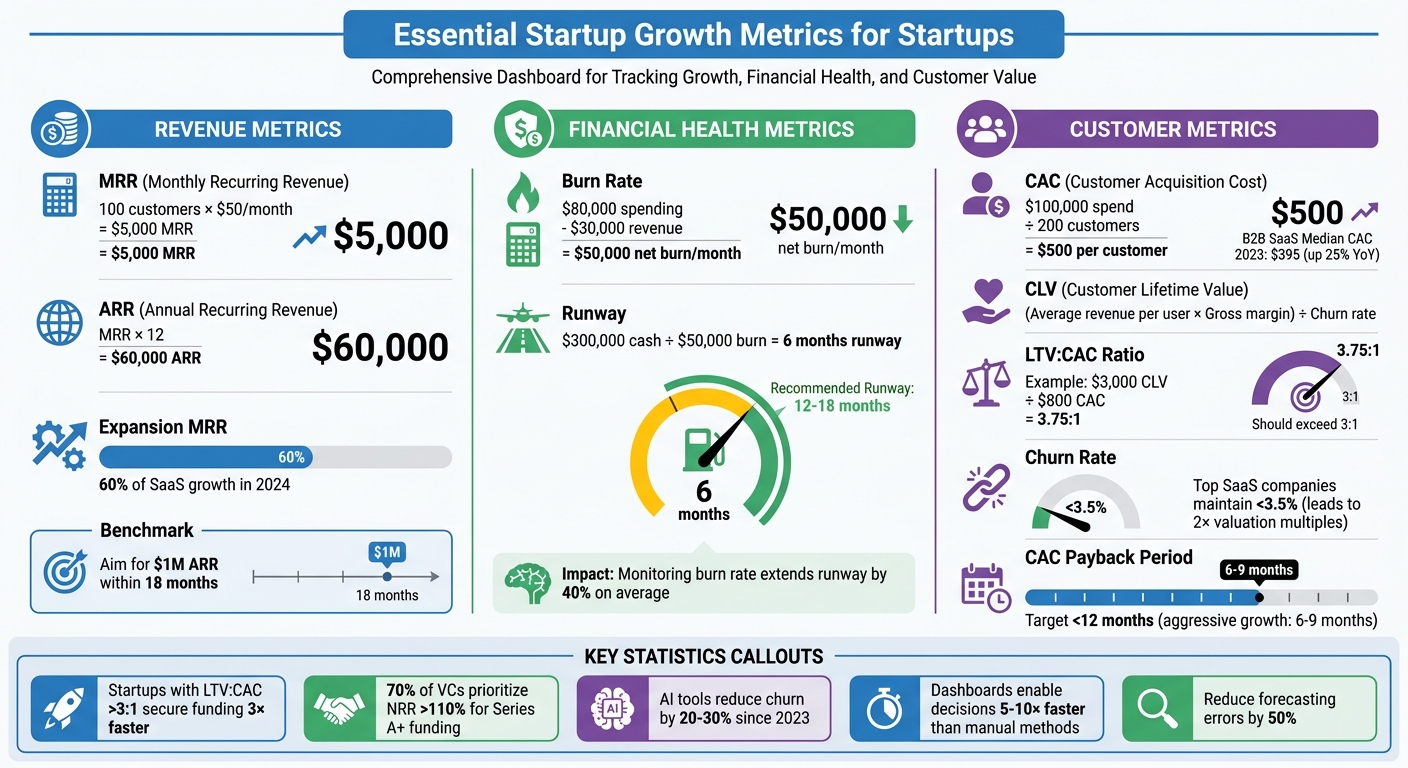
Essential Startup Growth Metrics and Benchmarks Dashboard
Startups often face challenges like scattered data or reactive decision-making. To stay on track, it’s crucial to focus on a handful of essential performance metrics. A well-organized dashboard with these key indicators can help you navigate growth effectively.
Monthly Recurring Revenue (MRR) and Annual Recurring Revenue (ARR) are must-haves for subscription-based startups. These metrics give you a clear picture of your revenue flow. For instance, if your startup has 100 customers paying $50 per month, your MRR is $5,000, and your ARR is $60,000. These numbers not only forecast growth but also highlight opportunities for scaling. Another critical metric, Customer Lifetime Value (CLV), reflects the total revenue a customer generates over their relationship with your business. You can calculate it using this formula: (Average revenue per user × Gross margin) ÷ Churn rate.
On the financial side, burn rate and runway are your survival tools. Burn rate measures how much cash you’re spending monthly. For example, a startup spending $80,000 while earning $30,000 has a net burn rate of $50,000 per month. Runway, on the other hand, tells you how long your funds will last. With $300,000 in the bank and a $50,000 burn rate, you’ve got six months of runway. Experts suggest keeping 12–18 months of runway to avoid raising funds under pressure.
On the customer side, metrics like Customer Acquisition Cost (CAC), churn rate, and retention rate reveal whether your growth is sustainable. CAC is calculated by dividing your total sales and marketing spend by the number of new customers. For instance, if you spend $100,000 to acquire 200 customers, your CAC is $500 per customer. A healthy LTV:CAC ratio should exceed 3:1. For example, if your CLV is $3,000 and your CAC is $800, your ratio is a strong 3.75:1, which supports scaling efforts.
In 2024, startups with LTV:CAC ratios above 3:1 secured funding three times faster than those with weaker unit economics, as per OpenView Partners' SaaS Metrics Report. Meanwhile, the median CAC for B2B SaaS climbed 25% year-over-year to $395 in 2023, highlighting the need to monitor these metrics weekly. Top SaaS companies achieve churn rates below 3.5%, which correlates with double the valuation multiples compared to those with higher churn rates.
Another key focus is expansion MRR, the revenue from upselling and cross-selling to existing customers. According to Bessemer Venture Partners' State of the Cloud report, expansion MRR now accounts for 60% of SaaS growth in 2024. Post-2022, 70% of VCs prioritize net revenue retention (NRR) above 110% over raw MRR growth when evaluating Series A and later funding rounds. A dashboard that tracks these metrics can help you spot trends early and adjust strategies before issues arise.
Revenue and Sales Metrics
MRR and ARR are the backbone of both investor discussions and internal planning. For example, if a fintech startup grows its MRR from $10,000 to $25,000 over six months, tracking this trend with line charts can reveal seasonality patterns. These insights can guide decisions like when to hire more salespeople or launch new features.
MRR includes all recurring monthly fees, while ARR is simply MRR multiplied by 12. Segmenting these metrics by customer type - such as enterprise vs. SMB - can help you identify which groups provide the most predictable revenue. Many successful startups aim to hit $1,000,000 in ARR within 18 months. Tracking your pace against this benchmark can reveal whether your strategy needs adjustment.
Expansion MRR is another critical metric to watch. If 60% of your revenue comes from upselling or cross-selling, it’s a strong sign of customer satisfaction and product-market fit. This metric can also guide resource allocation: should you focus more on customer success to drive expansion, or on sales to acquire new customers?
While revenue metrics are vital, managing expenses and cash flow is equally important for sustainable growth.
Burn Rate and Runway
Burn rate measures how much cash you’re spending each month, while runway calculates how long your funds will last. For example, if your gross burn rate is $60,000 per month and you have $400,000 in the bank, your runway is 6.7 months. Falling below the recommended 12-month runway should prompt immediate action.
A 2023 SaaS startup case study shows the impact of managing burn rate proactively. By freezing headcount and cutting non-essential tools, a startup reduced its monthly burn from $120,000 to $80,000, extending its runway to 15 months. This allowed them to secure $5,000,000 in funding from a position of strength rather than desperation.
The formula for runway is simple: Current Cash Balance ÷ Net Burn Rate. Automating alerts for when your runway drops below nine months can give you enough time to plan your next funding round. According to a 2023 Bench.co survey of 1,200 founders, startups that actively monitor and adjust their burn rate extend their runway by 40% on average.
Customer Acquisition and Retention Costs
CAC shows how much you’re spending to acquire each customer. The formula is straightforward: (Sales + Marketing Spend) ÷ New Customers. For B2B SaaS, a CAC below $400 is ideal, though the median climbed to $395 in 2023. More important than the CAC itself is the CAC payback period, or how long it takes to recover the acquisition cost. Healthy startups aim for a payback period under 12 months, while aggressive growth companies target 6–9 months.
Churn rate, the percentage of customers you lose over a period, is another critical metric. It’s calculated as (Lost Customers ÷ Total Customers at Start) × 100. For SaaS startups, a churn rate above 5–7% often signals product or customer fit issues. The best-performing companies keep churn below 3.5%, which leads to significant retention advantages over time. For instance, a 5% monthly churn rate means losing 60% of your customer base annually - making growth feel like an uphill battle.
Retention rate, the flip side of churn, is equally important. AI-driven tools have helped startups reduce churn by 20–30% since 2023 by identifying at-risk customers early. Dashboards that flag warning signs - like decreased usage, increased support tickets, or payment issues - allow teams to intervene before customers leave. Cohort analysis can also help by tracking retention across customer segments, acquisition channels, or product tiers. Automating these insights enables proactive decision-making and accelerates growth.
How to Build Dashboards in Lucid Financials

Creating a dashboard in Lucid Financials gives you real-time insights to make informed financial decisions. The platform combines AI-driven automation with customization, helping you track key metrics while cutting down on spreadsheet overload. Whether you're gearing up for a board meeting or keeping an eye on daily cash flow, these five steps will guide you in building dashboards that deliver actionable insights.
Step 1: Define Your Growth Goals and KPIs
Start by pinpointing what matters most to your team. Are you monitoring lead quality, pipeline value, or marketing performance? Your dashboard should align with current priorities, focusing only on the metrics that are relevant. Group metrics into categories for a clear, structured view.
A balanced approach works best. Include both results-based metrics (e.g., sales achieved) and activity-based metrics (e.g., calls made or proposals sent) to capture performance and effort.
As Lou Beirle, Head of Finance at LeafLink, notes:
"I used Lucidspark with my operations team in brainstorming sessions to identify pain points and inefficiencies in the financial servicing of one of our products".
Collaborating with your team during the setup process ensures you focus on what truly matters. It's also important to standardize your terminology early on - agree on definitions for terms like "monetary sales goals" or "qualified leads" and use them consistently across your dashboards and documents.
Lastly, tailor the dashboard to your audience. For instance, the sales team doesn't need website analytics, and your CFO doesn't need detailed marketing campaign data. Keep it relevant to the viewer.
With clear goals and KPIs, the next step is to bring your data into the dashboard.
Step 2: Connect Your Data Sources
Lucid Financials integrates seamlessly with your existing tools to pull in live data. You can import data from Google Sheets, Excel, or CSV files using the "Import Data" option in the File menu or the left-side formatting bar. For real-time updates, Google Sheets is a better choice than static CSV files since it refreshes data in your workspace every 30 seconds.
If you're using Salesforce, you can import data like accounts, opportunities, and contacts to create visual maps and assess deal health. Lucid also connects with Zapier, giving you access to over 8,000 apps for automatic updates and real-time monitoring across your tech stack. One organization even reduced costs by 32%, saving $758,000 over three years by streamlining its tools with Lucid.
For startups, Lucid's Slack integration is a game-changer. You can initiate boards, sync comments, and get AI-generated summaries of documents directly in Slack, keeping your team on the same page without switching platforms. Before going live, test your data mapping with a small sample to ensure accuracy - after all, poor-quality data can cost organizations an average of $12.9 million annually.
Step 3: Customize Dashboard Layouts and Charts
Once your data is connected, it's time to design your dashboard. Lucid offers a range of tools, including containers, dynamic tables, and Kanban-style layouts, to help you track goals and initiatives. Features like "Pages" or "Layers" allow you to create drill-down paths, starting with a high-level overview and diving into details during reviews.
Dynamic shapes and formulas (such as IF statements or ASPERCENT) are available to automate value adjustments, making your data easier to interpret. For grouped data, you can reference "parent" values across multiple elements by grouping shapes together. Simplify large numbers by rounding them (e.g., "$20 million" instead of "$20,748,345.23") for easier readability.
Step 4: Set Up Automated Alerts and Insights
Lucid's AI features can notify you of potential risks, performance milestones, and important updates before they escalate into problems. Use conditional formatting to establish rules that adjust shape colors, opacity, or borders based on performance. For example, a shape can turn green when a revenue goal is met or red when it falls short. You can also use visibility logic to show or hide specific indicators, like a "current month" marker, based on the data.
The platform's AI doesn't just stop at alerts - it also generates forecasts, financial reports, and insights in real time. And when you need a human touch, Lucid’s finance team is available via Slack to review AI-generated outputs for accuracy.
Step 5: Review, Share, and Update
After setting up visuals and automations, test your dashboard with a small group of stakeholders. Gather feedback on its clarity, relevance, and usability before rolling it out company-wide. Since Lucid Financials is cloud-based, your team can collaborate in real time, leaving feedback and tagging action items directly on the dashboard during planning sessions.
Use "Presentation Mode" and standardized templates to maintain consistency during reviews while still allowing for customization based on the audience. As your business priorities shift, update your dashboard to reflect those changes. Lucid’s AI evolves alongside your business, ensuring your dashboard stays relevant over time.
Benefits of Using Lucid Financials for Custom Dashboards
Real-Time Financial Insights
Lucid takes static spreadsheets and turns them into dynamic dashboards by connecting shapes and diagrams directly to live data from Excel or other sources. This means your dashboard updates automatically whenever the data changes, saving you from manual updates and ensuring your information is always current. For finance teams, this is a game-changer - no more wasting time compiling reports that are outdated by the time they’re ready.
With AI-driven insights, Lucid helps you stay ahead by identifying potential issues in real time. Its conditional formatting feature allows you to set specific rules to monitor financial health, automatically flagging critical data points that need attention. Instead of just reviewing past performance, you get alerts about what's happening right now. This level of real-time insight also supports creating polished, investor-ready reports and accurate forecasts.
Investor-Ready Reporting and Forecasting
Lucid simplifies the process of creating board-ready reports and investor-grade forecasts with just one click. This keeps you prepared for fundraising or due diligence whenever the need arises. Its drill-down features, like "Pages" or "Layers", allow you to start presentations with a high-level overview and then dive into detailed operational data when investors ask specific questions. This flexibility makes it easier to present data that supports strategic decisions, which is critical for scaling startups.
As Ria S, a Lucid user, explains:
"Lucid Financials is quite effective for building interactive dashboards that exceeds what traditional Excel layouts can offer".
Having all your key data in one place not only enhances presentations but also provides clear, visual evidence to support your points. Whether you're tracking immediate operational issues, long-term goals, or digging into the reasons behind revenue trends, Lucid delivers the tools startups need most for effective dashboards.
Easy Integration and Expert Support
Lucid integrates seamlessly with Slack, allowing you to ask questions about metrics like runway or performance and receive instant answers from the AI. Plus, human experts are available when you need additional support. The platform also connects with Zapier, making it easy to pull live data into your workflows and monitor metrics without switching between tools or disrupting your processes. Lucid adapts to how your team already works, reducing friction.
The cloud-based platform supports real-time collaboration, including co-editing, feedback loops, and action item tagging, which are especially useful for remote teams or collaborative investor presentations. Every AI-generated output is reviewed by Lucid's finance team, combining the speed of automation with the accuracy of human oversight. With pricing starting at $150/month, Lucid helps you achieve clean books in just seven days while scaling alongside your startup’s growth.
Conclusion: Using Custom Dashboards to Scale Your Startup
Custom dashboards are game-changers for startups aiming to grow efficiently while keeping costs under control and maintaining investor confidence. Startups that use real-time dashboards make decisions 2.5 times faster and can extend their runway by 20-30% through improved spending decisions. With real-time updates on metrics like burn rate, runway, and customer acquisition costs, you can steer your business with data-driven precision.
Lucid Financials offers an AI-powered platform with forecasting tools and Slack integration, providing the insights of a full finance team without the hefty price tag. Giorgio Riccio, founder of Lumino Technologies (handling over $200M in payments), shared his experience:
"We pulled up the Lucid platform in a meeting with a VC and they were extremely impressed. The VC was visibly impressed by how current the October data was".
To make the most of these benefits, start by defining your key performance indicators (KPIs) - like revenue growth and burn rate. Use Lucid Financials to connect your data sources, set automated alerts for critical thresholds, and review your dashboard weekly with your team. During fundraising, share polished, investor-ready views. This approach can cut financial admin time by 50-70%, giving you more time to focus on product development, sales, and customer success.
For just $150/month, Lucid Financials combines bookkeeping, tax services, and CFO-level insights in one scalable platform, supporting startups from pre-seed to Series C. Its AI processes data 100 times faster than traditional methods, with human experts ensuring accuracy. By using these dashboards, you’ll make smarter decisions, keep your financials up to date, and impress investors - all while staying focused on growing your business.
FAQs
Which KPIs should my startup track first?
Startups need to keep a close eye on three key metrics: cash flow, burn rate, and monthly recurring revenue (MRR) growth. These numbers are critical for understanding your company’s financial health and planning for sustainable growth. By focusing on these KPIs, you can make smarter decisions and keep your business moving in the right direction during its crucial growth phase.
How often should I review my dashboard metrics?
Regularly checking your dashboard metrics is a smart move. Many thriving startups take the time to reassess their budgets and performance metrics at least twice a year. This habit helps them stay in sync with market shifts and make well-informed decisions. By consistently reviewing these numbers, you can make sure your financial strategy stays aligned with your growth objectives.
How do I set alerts for burn rate and runway?
To keep a close eye on your startup’s financial health, use financial dashboards equipped with automatic monitoring and notification features. These tools allow you to connect your financial data and set up custom alerts for specific thresholds - like when your burn rate spikes or your runway drops too low. This way, you’ll get timely updates, helping you stay on top of any potential financial issues.