If I had to boil this down to one line, it’s this: I should never run my startup on one forecast. A small shift in MRR growth, churn, CAC payback, or hiring can move runway by months and change when I cut costs, hire, or start a fundraise.
Here’s the short version:
- I build three cases: Bear, Base, and Bull
- I run the company on the Base Case, not the Bull Case
- I track a short set of drivers: MRR growth, NDR, CAC, gross margin, headcount, burn, and runway
- I tie each case to clear triggers, like:
- pause hiring if growth misses plan by 20% for 2 months
- act on retention if churn goes above 1.5%
- start fundraising if runway drops below 9 months
- I update the model each month with a few input changes instead of rebuilding the file
A few numbers from the article show why this matters. In the sample model, cash required ranges from $1.5 million in the Bull Case to $4.2 million in the Bear Case. Months to profitability range from 16 to 36. That gap is big enough to change the whole plan.
Quick comparison
| Case | What it means | Example signals |
|---|---|---|
| Bear | Things slip, market gets tougher | slower growth, higher churn, longer fundraise |
| Base | Most likely path | current pipeline, past churn, approved hires |
| Bull | Key bets work out | lower CAC, earlier enterprise wins, faster growth |
I’d use scenario analysis to turn assumptions into decisions, not just spreadsheets. The point is simple: know what I’ll do before the numbers force my hand.
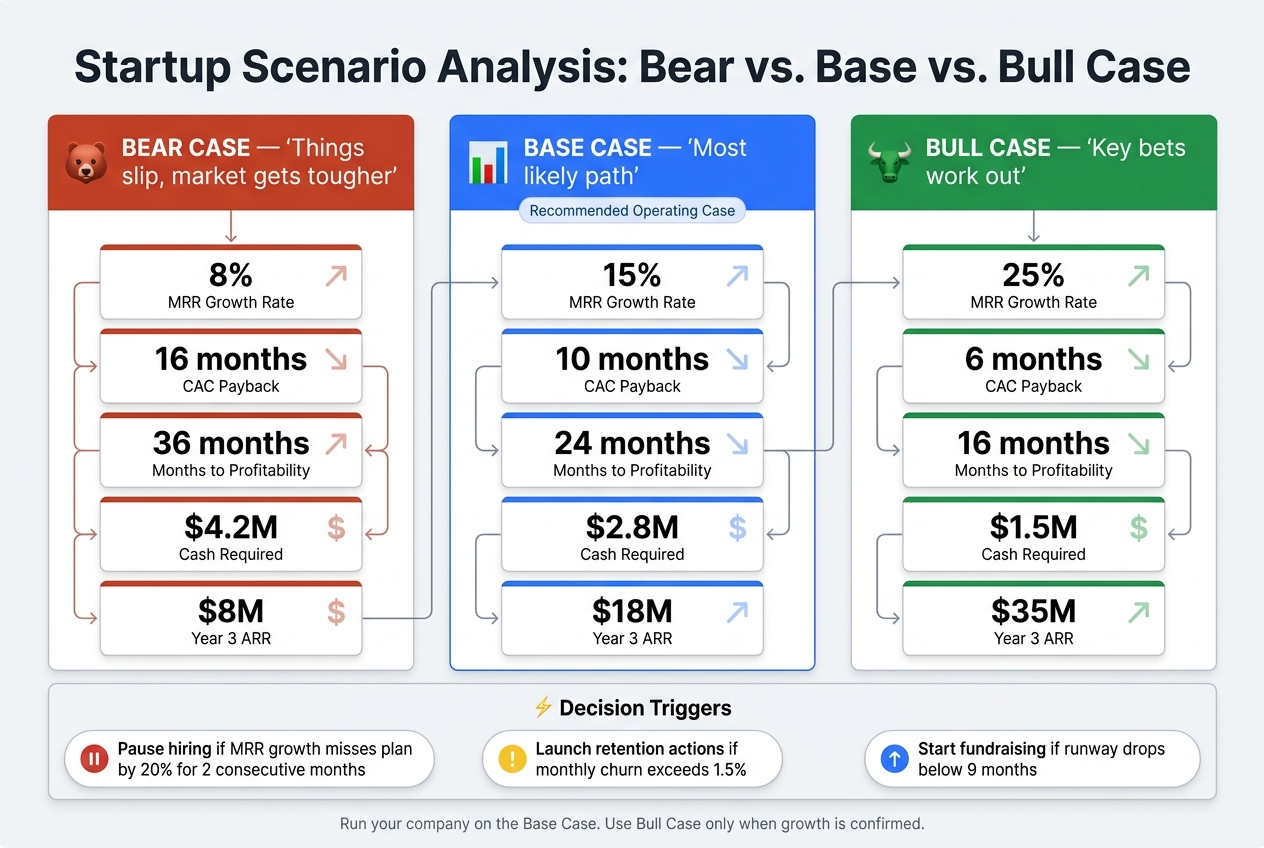
Startup Scenario Analysis: Bear vs. Base vs. Bull Case Key Metrics
A Startup Financial Model that Investors Love (use our template!)
sbb-itb-17e8ec9
Core Concepts Founders Need to Understand
Base, Upside, and Downside Cases in a Startup Model
Most scenario models begin with three versions of your financial future.
The base case is the outcome you expect most often. It should rest on your current pipeline, past churn, and approved hires. Think of it as the main version of the model - the one everything else gets compared against.
The upside (bull) case shows what happens if your key bets work out. Maybe a new acquisition channel hits target CAC, or an enterprise tier closes earlier than planned. This should be a stretch, but still believable. Not a fantasy.
The downside (bear) case is where you pressure-test execution risk and market pressure. It should assume things slip and the market gets a bit tougher, not that the company falls apart. In plain terms, that could mean monthly churn rising by 2–3 percentage points, or a fundraise taking six months longer than expected.
For most pre-seed through Series B startups, three scenarios is the practical minimum.
| Metric | Bear Case | Base Case | Bull Case |
|---|---|---|---|
| MRR Growth Rate | 8% | 15% | 25% |
| CAC Payback | 16 months | 10 months | 6 months |
| Months to Profitability | 36 | 24 | 16 |
| Cash Required | $4.2M | $2.8M | $1.5M |
| Year 3 ARR | $8M | $18M | $35M |
Source: Inflection CFO
Once those three cases are in place, the next job is figuring out how each one changes the rest of the model.
Scenario Analysis vs. Sensitivity Analysis vs. What-If Tests
These tools sound similar, but they answer different questions. If you mix them up, you can end up with the wrong level of detail for the decision in front of you.
| Method | Best Use | Main Limitation |
|---|---|---|
| Sensitivity Analysis | Identifying which single variable (e.g., churn vs. CAC) moves the needle most on runway | Ignores cross-variable dependencies and compounding effects |
| Scenario Analysis | Strategic planning for coherent futures and preparing for compound events | More complex to build because it requires three complete versions of the financial model |
| What-If Tests | Quick, ad hoc stress-testing of specific assumptions for immediate decisions | Often lacks the depth of a fully integrated financial model |
A simple way to think about it:
- Sensitivity analysis asks, “Which one input matters most?”
- Scenario analysis asks, “What does a full future look like if several things change at once?”
- What-if tests ask, “What happens if we tweak this one assumption right now?”
With that distinction in place, the next move is picking the inputs that actually drive the forecast.
The Financial Drivers Every Startup Should Model
On the revenue side, model MRR growth rate, Net Dollar Retention (NDR), pricing tiers, and conversion rates. These tell you how revenue grows and how steady that growth is.
For efficiency metrics, CAC and gross margin show what growth costs and how much of each dollar you keep. If those numbers move the wrong way, growth can look good on paper while cash disappears in the background.
On the expense side, headcount should be broken out by department. And don’t stop at base salaries - include payroll taxes and benefits too. Software subscriptions and infrastructure costs should sit in their own line items. Capital raise timing also belongs in the model, since a late round can change the whole cash picture.
All of these inputs should roll into a full P&L, balance sheet, and cash flow statement so you can see the actual effect on cash runway in months.
Once the drivers are mapped, the next step is turning them into a model and a set of visuals that leaders can read fast.
How to Build and Show Scenarios Clearly
A Simple Driver-Based Model Structure
Start with the same drivers from the prior section so the model stays tied to how the business actually runs. Put MRR growth, CAC, churn, headcount, and funding timing in one assumptions tab, and don’t hardcode those figures into formulas.
A clean setup usually has three layers: inputs, calculations, and outputs. That split makes the model easier to update and much easier to check. Then, each month, refresh only the key inputs instead of touching the whole file.
Add a scenario selector - a dropdown - so you can flip between Base, Bull, and Bear cases without rewriting formulas. Connect headcount to that scenario logic too, so a downside case can automatically delay or cut hires. Label monthly columns clearly, and color-code input cells so it’s obvious which numbers people can change and which ones come from formulas.
Once that structure is set, the next step is picking visuals that make each case easy to compare.
Charts That Make Scenario Differences Easy to Read
Not every chart works well for scenario planning. Some are good for trend lines. Others are better for side-by-side comparisons.
| Chart Type | Best For | Limits |
|---|---|---|
| Line Chart | Visualizing cash runway and revenue trajectory over time across scenarios | Clutters with more than three scenarios. |
| Clustered Bar Chart | Comparing metrics like months of runway or total ARR side-by-side for each case | Hides timing of cash lows. |
| Waterfall Chart | Showing the step-by-step bridge between Base and Bear case outcomes | Needs careful data setup. |
| Heatmap / Data Table | Stress-testing two changing drivers at once, such as CAC and churn | Can be hard to read fast. |
| Tornado Chart | Identifying which high-impact driver has the largest effect on runway | Shows one variable at a time only. |
For most board updates, one line chart showing months of runway under each case is often the clearest thing to put in front of investors.
How to Present Scenarios to Investors and Team Leads
For investors and boards, keep it tight: a runway chart, a short assumptions table, and a brief driver summary. Don’t stop at outcomes. Show what management should do in each case. Use the same names and colors across slides so people don’t have to re-learn the story each time.
For nonfinance team leads, narrow the focus to the runway chart and the trigger table. The main question is simple: Which scenario is the business tracking toward right now, and what response has already been agreed to? Assign one owner to each key assumption so everyone knows which signal to watch. For example, MRR growth can sit with the Head of Sales.
When Base, Bull, and Bear still don’t cover enough of the uncertainty, it’s time to move into probabilistic modeling.
Advanced Uses and Ongoing Monitoring
When Probabilistic Modeling Is Worth the Effort
Sometimes three scenarios just aren't enough.
If Bear, Base, and Bull still leave too much uncertainty, Monte Carlo can give you a deeper look. It makes sense when you're dealing with a complex pipeline or inputs that are hard to pin down, like close rates, churn, or fundraising timing.
Instead of working from just three fixed outcomes, Monte Carlo tests thousands of input combinations. That gives you a much better sense of the range of possible runway outcomes.
To make that output useful, pair it with sensitivity analysis and a tornado chart. That shows which drivers have the biggest effect on runway, so you know where to focus instead of trying to watch everything at once.
Using Dashboards to Track Actuals Against the Plan
Once the scenarios are built, the monthly job is simple: figure out which case reality is starting to match. In practice, that means comparing actuals with the base case every month.
It also helps to assign an owner to each key assumption. If one person is watching each signal, issues are less likely to slip through the cracks.
The core metrics to track are below:
| Dashboard Metric | Purpose |
|---|---|
| Cash & Runway | Tracks total survival time under current conditions |
| Burn Rate | Measures monthly net cash outflow |
| MRR / Growth | Tracks revenue trajectory against the base case |
| Gross Margin | Shows how much revenue remains after direct costs |
| CAC & Payback | Evaluates sales efficiency and marketing spend impact |
| Headcount | Tracks actual hiring against the planned expense model |
Clear trigger-based responses matter here too. For example:
- Pause hiring if MRR growth misses the base case by 20% for two months
- Launch retention actions if churn goes above 1.5%
- Start the raise if runway drops below nine months
The good news: refreshing the model shouldn't turn into a monthly slog. If the model is set up well, updating it each month should take about 20 minutes and touch only 5–8 input cells.
How Lucid Financials Can Support Scenario Planning

This monthly review is much easier when actuals, forecasts, and reporting all live in the same place. Lucid Financials keeps books, forecasts, and reporting in one system, so scenario updates stay tied to actuals.
That means founders can ask runway questions right in Slack and generate investor-ready reports, which helps keep board updates and scenario planning in sync.
Common Mistakes and Key Takeaways
Mistakes That Make Scenario Analysis Misleading
Once the model is built, the next danger is simple: using the wrong case to run the company.
The biggest mistake is operating off the Bull Case. That’s where teams get into trouble. Run the business on the Base Case. Save the Bull Case for upside moves only if growth shows up.
Two other mistakes can throw the model off fast. One is leaving out fully loaded headcount costs. Salary is only part of the bill. Payroll taxes, benefits, and equipment all add to the true cost, and without them, a new hire looks cheaper on paper than in practice. In a Bear Case, a single hire can cut runway by six weeks.
The other mistake is making the Bear Case feel like the end of the world. If it’s too extreme, it stops being useful. A Bear Case should be tough to accept, but still workable for day-to-day planning.
| Mistake | Why It Causes Problems | Better Approach |
|---|---|---|
| Using Bull Case for operations | Leads to over-hiring and aggressive spending | Use the Base Case for the operating plan |
| Ignoring loaded headcount costs | Understates the true cash impact of new hires | Use fully loaded costs - taxes, benefits, and equipment - to calculate runway compression |
| Ignoring correlated variables | Underestimates how fast cash burns during a downturn | Move correlated inputs together - if growth slows, model the hiring delay |
| Hardcoding scenario inputs | Makes the model rigid and difficult to update | Use an assumptions tab with scenario toggles |
| No trigger thresholds | Decisions get delayed until it's too late to act | Set clear thresholds tied to each scenario |
| Treating Bear Case as catastrophic | Creates a plan too extreme to be useful | Build a Bear Case that is hard to like but still workable |
Key Points Founders Should Remember
The fix is simple: tie each scenario to a decision, a trigger, and an owner.
Scenario analysis only matters if it changes what the company does next. That includes hiring plans, spending choices, and fundraising timing. In practice, that means using three clear cases - Bear, Base, and Bull - focusing on the drivers that have the biggest effect, and updating the model every month when the setup is done right.
For board reviews, use one runway chart. It keeps the conversation clear. And in most rooms, a realistic Bear Case builds more trust than an aggressive growth forecast.