If you want investor reports people can scan in under 2 minutes, track the same KPI set every month. I’d keep the report focused on three blocks: revenue efficiency, cash and capital efficiency, and productivity.
Here’s the short version: investors want to see growth, retention, cash left, burn rate, and team output in one fixed format. That usually means showing MRR/ARR, GRR/NRR, CAC and payback, cash balance and runway, burn multiple, Rule of 40, customer and usage data, ARR per FTE, and pipeline coverage. Use USD, mm/dd/yyyy, and the same formulas every time.
If I were building this report, I’d make sure it includes:
- Revenue movement: MRR, ARR, new MRR, expansion, contraction, and churn
- Retention: GRR, NRR, logo churn, revenue churn, and cohort data
- Unit economics: CAC, CAC payback, LTV, LTV:CAC, and gross margin
- Cash view: ending cash, average net burn, and runway
- Capital use: burn multiple and Rule of 40
- Output: paying customers, churned customers, usage, and health flags
- Team efficiency: headcount, net hires, and ARR per FTE
- Sales predictability: qualified pipeline, conversion rates, and sales cycle length
A few benchmark numbers stand out. Many investors want 12–18 months of runway. NRR above 110% is strong. CAC payback under 12 months is rare; 12–18 months is more common. Burn multiple under 1.5x is strong, while above 2.0x can be a problem.
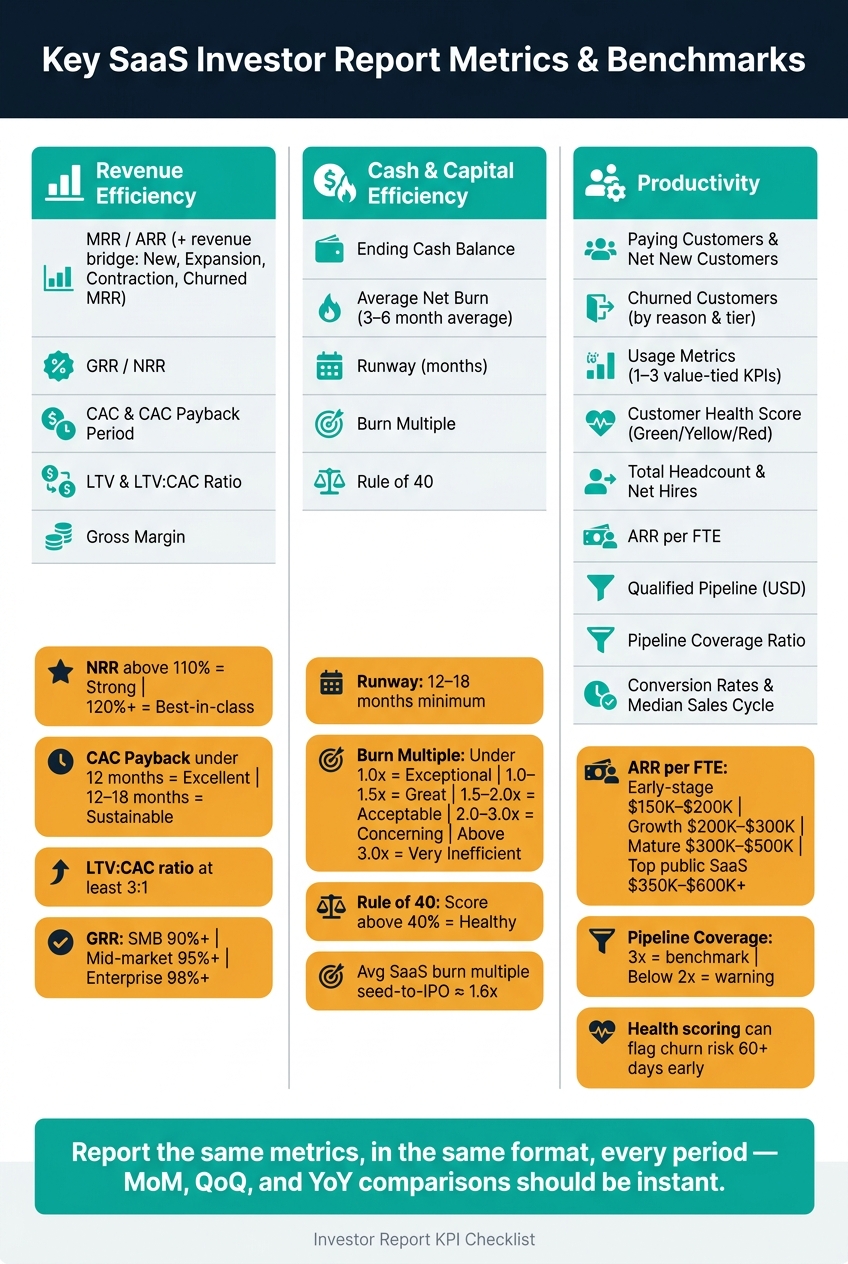
Key SaaS Investor Report Metrics & Benchmarks at a Glance
Your SaaS Metrics Playbook for 2025 | SaaS Metrics School | SaaS Playbook
sbb-itb-17e8ec9
Quick Comparison
| Metric Block | What to Show | What investors look for |
|---|---|---|
| Revenue efficiency | MRR, ARR, retention, churn, CAC, LTV | Is growth efficient and sticky? |
| Cash and capital efficiency | Cash, burn, runway, burn multiple, Rule of 40 | How long cash lasts and how spend turns into growth |
| Productivity | Customers, usage, headcount, ARR per FTE, pipeline | Whether the team is turning spend into output |
Bottom line: I’d keep the report short, numeric, and fixed from period to period so MoM, QoQ, and YoY changes are easy to read.
Revenue efficiency metrics to include
MRR, ARR, and net new revenue movement
Start with MRR and ARR, then show the bridge behind the change. Monthly Recurring Revenue (MRR) is recurring monthly subscription revenue. For subscription businesses, ARR is usually MRR × 12. Report both in USD.
Then break net new MRR into the same four parts each period:
- New MRR
- Expansion MRR
- Contraction MRR
- Churned MRR
This revenue bridge makes the story easy to read. You can see whether growth is coming from new logos, upsells, or both. And you can spot where revenue is slipping out.
| MRR Movement (July 2026) | Amount (USD) |
|---|---|
| Starting MRR (June 2026) | $120,000 |
| New MRR | +$18,000 |
| Expansion MRR | +$7,000 |
| Contraction MRR | −$4,000 |
| Churned MRR | −$6,000 |
| Net New MRR | $15,000 |
| Ending MRR (July 2026) | $135,000 |
| MoM MRR Growth | 12.5% |
Use the same breakdown every month so investors can compare changes cleanly. If one line swings hard because of a single customer or deal, add a short note.
GRR, NRR, churn, and expansion
Gross Revenue Retention (GRR) shows how much recurring revenue you kept from existing customers before expansion. Net Revenue Retention (NRR) adds expansion back in. GRR tops out at 100%. NRR can go above 100% when upsells beat churn.
For SMB-focused SaaS, a GRR above 90% is healthy. Mid-market companies often aim for 95%+, and enterprise companies can be 98%+. For NRR, 100% is acceptable, 110–120% is strong, and 120%+ is best-in-class.
Don’t show GRR and NRR by themselves. Pair them with logo churn and a simple cohort table. Logo churn measures the share of customers lost. Revenue churn is revenue lost to contraction and churn divided by starting MRR.
Cohorts help prove whether retention holds up over time. Group customers by the quarter they started, then show their MRR remaining at 6, 12, and 18 months. A cohort table tells you much more than one retention percentage ever could.
CAC, payback period, LTV, and gross margin
Once retention is clear, show whether growth is efficient. Put these metrics into one unit economics block. Investors read them together to answer one thing: is growth capital-efficient?
Customer Acquisition Cost (CAC) is total sales and marketing expense for a period divided by new customers acquired in that same period. Use GAAP-based sales and marketing expenses from your income statement. CAC payback, in months, is CAC divided by average monthly gross profit per customer. A payback under 12 months is excellent. 12–18 months is sustainable. Beyond 18 months can trigger concern, especially in a tighter capital market where median CAC payback across $5 million–$50 million ARR companies has stretched to about 17–18 months. Report gross margin next to CAC and payback, since both depend on gross profit.
LTV is calculated as average MRR per customer × gross margin % ÷ monthly churn rate. If average MRR per customer is $500, gross margin is 80%, and monthly churn is 2%, then LTV = $20,000. The LTV:CAC ratio should be at least 3:1 to show healthy unit economics. Use gross profit, not revenue, in both LTV and payback formulas.
Present CAC, payback, LTV:CAC, and gross margin in one quarterly table so investors can scan the unit economics picture in seconds. Keep these numbers reconciled across billing, CRM, and the general ledger.
Cash and capital efficiency metrics to include
Cash balance, net burn, and runway
After unit economics, investors usually go straight to liquidity. They want to know one thing: can this company stay alive long enough to reach the next milestone? That’s why these three numbers should show up at the top of every update.
Present them in a simple table each period:
| Cash Metric | Value |
|---|---|
| Ending cash balance (09/30/2026) | $2,450,000 |
| Average net burn (Jul–Sep 2026) | $185,000/month |
| Runway | 13.2 months |
If you track gross burn, put it in the same table.
Net burn is operating cash outflows minus operating cash inflows, excluding financing. Use a 3–6 month average, because one big annual collection can throw off a single month. Always spell out the formula and time period you used. For example: Net burn = operating cash outflows − operating cash inflows; 3-month average for Jul–Sep 2026.
Runway is ending cash divided by average monthly net burn. Using the example above: $2,450,000 ÷ $185,000 ≈ 13.2 months. Many U.S. seed and Series A investors want to see at least 12–18 months of runway. If runway is below 12 months, say what you plan to do about it.
It also helps to add a short note on anything likely to move these numbers in a big way. For example: With 5 planned AE hires and 3 engineers starting in November, net burn is expected to rise to around $215,000/month, reducing runway to about 11 months - partially offset by $400,000 in annual renewals scheduled for December. That kind of note tells investors you’re watching cash ahead of time, not scrambling after the fact.
Burn multiple and Rule of 40
Once ARR has settled into a steady pattern, add burn multiple and Rule of 40. These metrics show capital efficiency in plain terms.
Burn multiple = net burn ÷ net new ARR over the same period. If you burned $600,000 in a quarter and added $400,000 in net new ARR, your burn multiple is 1.5x. Lower is better. Common benchmark ranges look roughly like this:
| Burn Multiple | Efficiency Signal |
|---|---|
| Under 1.0x | Exceptional |
| 1.0x–1.5x | Great |
| 1.5x–2.0x | Acceptable |
| 2.0x–3.0x | Concerning |
| Above 3.0x | Very inefficient |
According to ScaleVP analysis, the average burn multiple across SaaS companies from seed to IPO is about 1.6x, with top-quartile companies at $25M+ ARR often hitting under 1.0x. In tighter funding markets, burn multiples above 2–2.5x at Series A or B are getting hit harder by investors.
Rule of 40 = year-over-year revenue growth rate (%) + operating margin (%). So if a company is growing at 35% YoY with a −15% operating margin, it scores 20%. If it’s growing at 25% with a +20% margin, it scores 45%. Scores above 40% are generally seen as healthy across public and private SaaS benchmarks.
Only report Rule of 40 after you have several quarters of steady revenue, and show the last four quarters in a small table. Also, always say which margin definition you used - operating, EBITDA, or free cash flow - and call out any one-time adjustments.
These metrics show how well capital turns into growth. Next, show how well the team turns spend into output.
Productivity metrics to include
Once investors see that cash is covered, they usually shift to a different question: Is the operating engine getting more efficient? That’s where productivity metrics come in. They help show whether the business is scaling in a healthy way.
A simple way to frame this section is to start with customer output, then move into team efficiency and funnel performance.
Customers, usage, and customer health
Show the customer metrics that explain retention and expansion. Every investor update should include paying customers or active accounts, net new customers added, and churned customers for the period, with simple deltas. Break churned customers out by reason and customer tier so investors can spot risk patterns early. Also separate new logos from reactivations.
For usage, choose one to three metrics that tie straight to delivered value. Good examples include transactions processed, models run, projects completed, or workflows automated per account. Skip vanity metrics like total logins. And once you define active accounts, stick with that same rule in every report. For example: accounts with at least one tracked event in the last 30 days, excluding test or internal accounts.
Customer health scores start to help once you can calculate them the same way every time. If the score combines usage depth, support volume, and engagement signals, automated health scoring can flag churn risk 60+ days before cancellation. A simple green/yellow/red table works well here. Include columns for ARR, health tier, last usage spike or drop, and upcoming renewal date. That gives investors a quick read on which revenue looks steady and which revenue may be at risk.
Headcount, ARR per FTE, and hiring pace
Report total headcount, net hires for the period, and a functional breakdown across GTM, Product & Engineering, and G&A. Then add ARR per FTE - total ARR divided by total full-time equivalents, including long-term contractors counted as FTEs.
Here’s why this matters. If ARR grows from $2 million to $4 million while headcount grows from 20 to 30, ARR per FTE moves from $100,000 to about $133,000. That’s a clear gain in efficiency. Track this number over time so the trend is easy to see.
Benchmark ARR per FTE by stage:
| Stage | ARR per Employee |
|---|---|
| Early-stage (<$10M ARR) | $150K–$200K |
| Growth-stage ($10M–$50M ARR) | $200K–$300K |
| Mature (>$50M ARR) | $300K–$500K |
| Top-quartile public SaaS | $350K–$600K+ |
AI-native platforms can exceed $800K per employee.
If headcount is growing faster than ARR, say why. A short note on large hiring waves and the expected revenue impact over the next 12–18 months answers the obvious follow-up before investors have to ask.
From there, most investors want to know whether sales output is keeping pace too.
Pipeline, conversion rates, and sales cycle length
These metrics show whether revenue growth looks predictable. Report pipeline, conversion, and sales cycle together so the picture is easy to follow.
Qualified pipeline in USD should include only opportunities that meet your qualification threshold: budget, authority, need, and timeline. Pipeline coverage is that number divided by the next period's revenue target. A 3x coverage ratio is a common benchmark for SMB SaaS, with a typical range of 2.5x–4.0x and a warning level below 2.0x. If you sell across SMB, mid-market, and enterprise, show coverage by segment. Otherwise, heavy concentration in one tier can make the top-line number look better than it is.
For conversion rates, report the main funnel stages and explain any material change by segment or channel.
Report median sales cycle by deal size. Shorter cycles usually improve forecast reliability. Longer cycles often point to friction in the process.
How to package these metrics in investor reports
Once you've defined the metrics, the next job is simple: package them the same way every time so investors can scan them fast.
Use the same fixed reporting template every period
Use one fixed reporting template every period. Build each monthly or quarterly update around the same three sections: revenue efficiency, cash and capital efficiency, and productivity. Keep that order locked so investors can compare one report to the next without having to relearn the layout each time.
Keep KPI definitions fixed too. If you change the way you calculate NRR or redefine "active customer", call it out clearly.
That makes month-to-month and quarter-to-quarter comparison immediate.
Present metrics in compact tables
For each block, use a compact table with four columns: Current Period, Previous Period, Change, and % Change. Keep each table to 5–10 metrics.
Here’s what that looks like in practice:
Revenue Efficiency
| Metric | Aug 2026 | Jul 2026 | Change | % Change |
|---|---|---|---|---|
| ARR | $1,200,000 | $1,050,000 | +$150,000 | +14.3% |
| NRR | 118% | 115% | +3 pts | +2.6% |
| Gross Margin | 72% | 68% | +4 pts | +5.9% |
Add one short note on the main driver behind the change. Investors shouldn’t have to guess whether the NRR lift came from upsells, lower churn, or something else.
Conclusion: The core metrics investors expect every time
The point is consistency, not volume. Investors want the same core metrics, in the same format, every period.
FAQs
Which investor report metrics matter most at my stage?
The metrics you track should shift as your company grows. What mattered on day one won't always be the thing that matters a year later.
In the early stage, the focus is simple: burn rate, cash runway, and customer acquisition cost. At this point, you're trying to stay alive, learn fast, and avoid spending $10 to make $1.
In the growth stage, the picture changes. Now it's about revenue growth, LTV:CAC ratio, and cohort retention. You're no longer just asking, "Can we get customers?" You're asking, "Can we keep them, and does the math work?"
Later on, attention moves to gross margins, operating leverage, and cash flow generation. That's when the business needs to show it can turn growth into a durable company, not just a fast-moving one.
How often should I update investor KPIs?
It depends on your company stage, but consistency matters most when you're building investor trust. Early-stage startups should usually send monthly updates. Growth-stage companies, on the other hand, tend to report quarterly.
That said, not every metric runs on the same clock.
Some operating numbers, like cash position, burn rate, and runway, should be watched daily. Growth metrics such as revenue and acquisition costs are often tracked weekly.
What formulas should stay consistent across reports?
Keep metric definitions and calculation formulas the same across every report. Each KPI needs a clear definition. For example, define MRR as successful, non-refunded charges. And if you ever change a metric definition, explain it plainly instead of shifting the meaning over time.
Use the same terms and scaling in every report. Your charts and metrics should line up with your general ledger and source data. Just as important, document how each number is calculated. That paper trail helps with transparency, audits, and investor trust.