Board reporting and investor reporting serve different purposes and require tailored approaches.
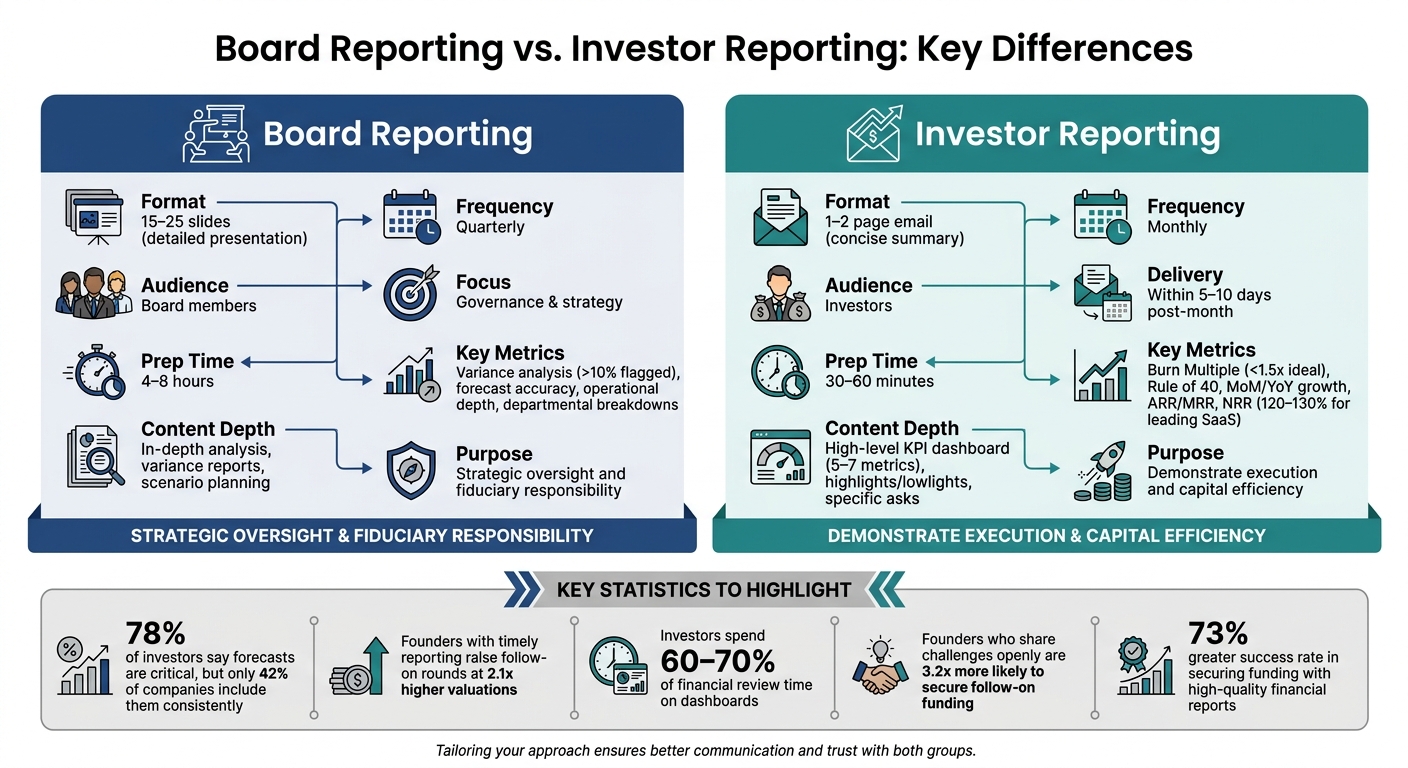
- Board reporting focuses on governance and oversight, providing detailed quarterly updates (15–25 slides) with essential financial metrics, operational metrics, and strategic challenges. It helps the board guide long-term decisions.
- Investor reporting delivers concise monthly updates (1–2 pages) highlighting key metrics, progress, and specific requests. It builds trust and demonstrates execution to investors.
Key differences:
- Audience: Board members need in-depth analysis; investors prefer quick summaries.
- Frequency: Board reports are quarterly; investor updates are monthly.
- Format: Board reports are detailed presentations; investor updates are brief emails.
- Focus: Board reports emphasize strategy and governance; investor updates center on performance and capital efficiency.
Quick Comparison:
| Feature | Board Reporting | Investor Reporting |
|---|---|---|
| Format | 15–25 slides | 1–2-page email |
| Frequency | Quarterly | Monthly |
| Audience | Board members | Investors |
| Focus | Governance, strategy | Performance, trust |
| Prep Time | 4–8 hours | 30–60 minutes |
| Delivery | 48–72 hours before the meeting | Within 5–10 days post-month |
Tailoring your approach ensures better communication and trust with both groups.
Board Reporting vs Investor Reporting: Key Differences Comparison Chart
Board Reporting for Investor Engagement Explainer
sbb-itb-17e8ec9
Focus Areas: Board vs. Investor Reporting
When it comes to board and investor reporting, the differences go beyond their core purposes. Each serves a unique role in guiding a company’s progress, and their execution reflects this divergence. Board reporting is all about internal discipline, early issue detection, and setting clear priorities for leadership. On the other hand, investor reporting demonstrates how capital is being managed and builds a case for future funding.
Board Reporting Focus Areas
Board reporting is primarily about governance, managing risks, and planning for the long term. Since board members have fiduciary responsibilities - and can even be held personally liable for company decisions - they need detailed information to oversee the business effectively. This includes tackling big-picture questions like whether to expand into new markets, pursue mergers or acquisitions, or adjust budget allocations across departments.
But it’s not just about the numbers. Board reports also cover organizational health metrics, such as headcount trends and attrition rates, which are just as vital as revenue figures. The goal is to make board meetings more than just status updates - they should be strategic discussions where directors can provide actionable insights. For example, updated forecasts are a key element here. Interestingly, while 78% of investors say forecasts are "critical" or "very important" in board materials, only 42% of companies consistently include them.
Investor Reporting Focus Areas
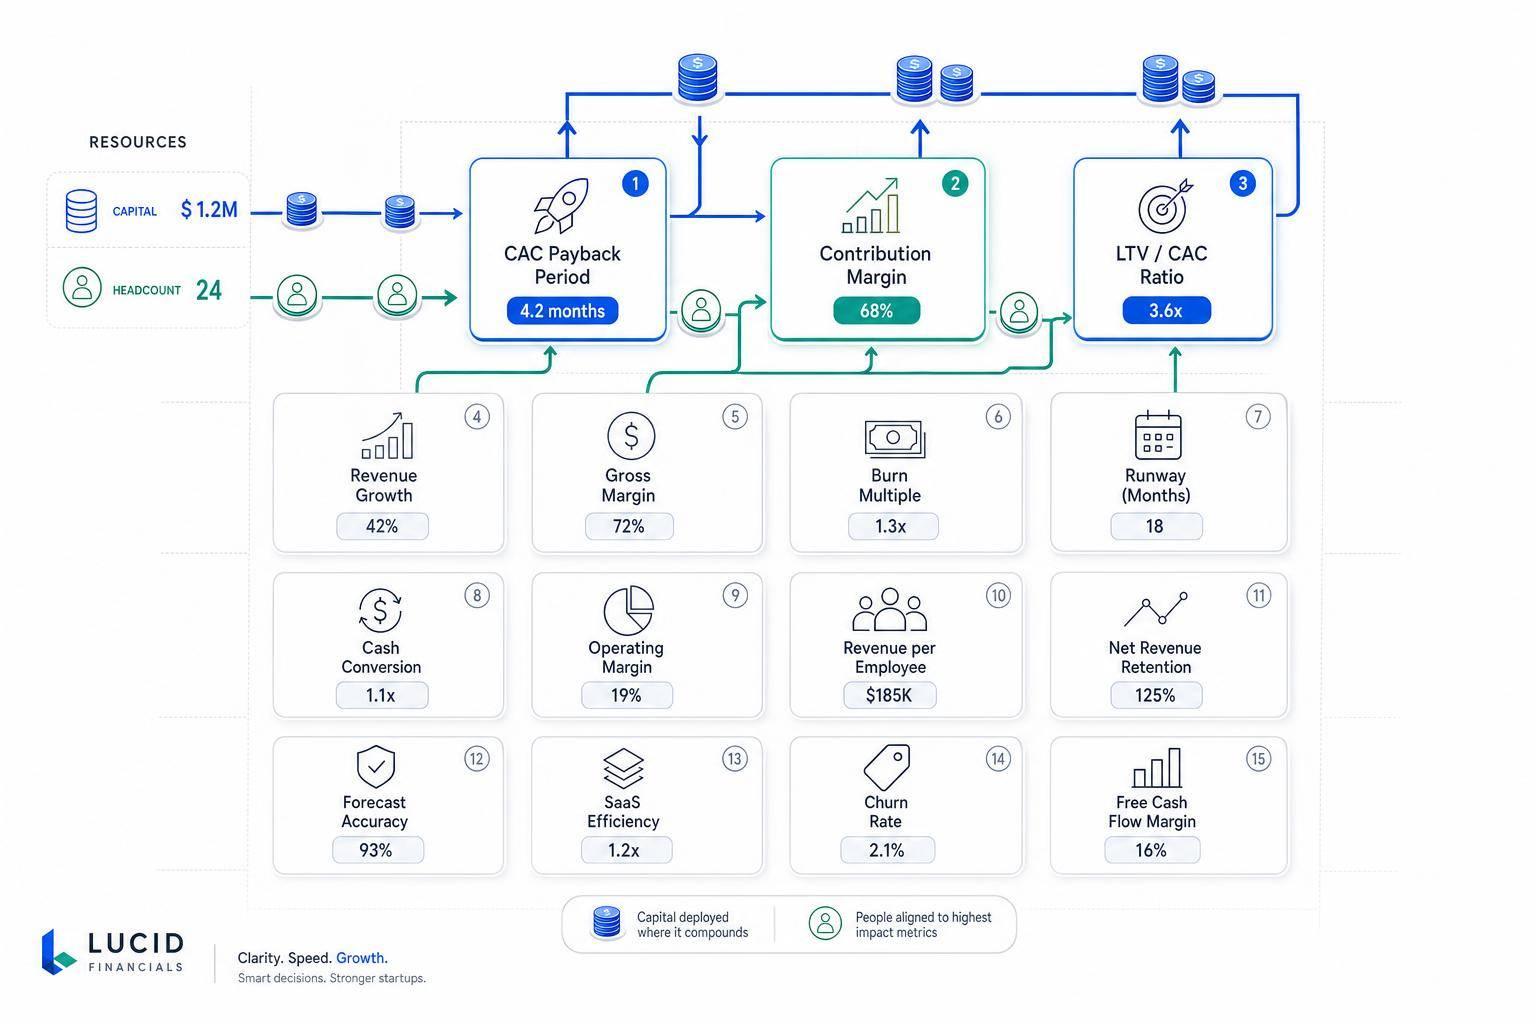
Investor reporting, in contrast, focuses on financial performance and demonstrating capital efficiency. Investors look for growth indicators like Monthly Recurring Revenue (MRR), Annual Recurring Revenue (ARR), and Net Revenue Retention (NRR). However, since the market correction in 2022, the emphasis has shifted away from "growth-at-all-costs" to metrics that show efficiency, such as Burn Multiple, CAC Payback, and LTV:CAC ratios.
Given that investors spend 60–70% of their financial review time analyzing dashboards, reports should start with a clear, high-level summary and maintain a consistent format month after month. Scenario analysis is also essential - investors want to see base, upside, and downside cases to understand potential risks and opportunities. Additionally, the "Rule of 40" (the combined growth rate and profit margin exceeding 40%) remains a key benchmark for balancing growth with profitability.
How Objectives Differ
The objectives of these reports further highlight their differences. Board reporting supports oversight and strategic planning, while investor reporting focuses on fostering transparency and trust. For instance, investors usually skim reports for quick insights, while board members need detailed materials to engage in deeper discussions.
The focus of reporting also evolves as a company grows. At the Seed stage, board reports emphasize learning speed and signs of product-market fit. By Series A, the spotlight shifts to repeatable processes and unit economics. At Series B and beyond, the focus turns to operational maturity, forecast accuracy, and the path to profitability. Tailoring reports to these stages ensures that both groups - investors and the board - get the information they need without creating confusion or leaving gaps in understanding.
Key Metrics: Side-by-Side Comparison
Board and investor reports rely on a shared set of metrics, but they interpret and prioritize them based on their distinct objectives. Both audiences are focused on assessing the health of the business, yet their approaches differ. Building on the earlier focus areas, this section breaks down how these common metrics are utilized differently.
Metrics Used in Both Reports
Certain metrics act as the backbone of both types of reports: revenue, cash balance, and burn rate. Metrics like Monthly Recurring Revenue (MRR) and Annual Recurring Revenue (ARR) highlight top-line growth and market traction. Meanwhile, cash balance and net burn offer insights into how long the company can sustain operations without needing more funding. Another critical metric, Net Revenue Retention (NRR), measures the growth in value from existing customers. For context, leading SaaS companies often achieve NRR rates of 120–130%.
The way these metrics are presented, however, varies. Investors typically focus on a high-level metrics dashboard, which provides a quick overview of the company’s momentum. On the other hand, board members take a more detailed approach, analyzing these numbers alongside variance explanations and departmental breakdowns. Both groups also keep a close eye on capital efficiency metrics like CAC Payback and LTV:CAC ratios. This focus has intensified since the 2022 market shift, which emphasized sustainable growth over aggressive scaling.
Board-Specific Metrics
For board members, the emphasis is on operational depth and governance. Variance analysis plays a key role here - any deviations over 10% between actuals and budgets are flagged as indicators of financial discipline. Boards also track forecast accuracy over time, as repeated misses (even overly optimistic ones) can indicate a lack of understanding of the business. Interestingly, while 78% of investors consider updated forecasts essential in board packages, only 42% of companies consistently provide them.
Scenario analysis is another critical component of board reporting. Presenting base, upside, and downside cases for runway and revenue demonstrates preparedness and operational insight. This helps boards decide when to implement cost-cutting measures or ramp up hiring. Additionally, boards require granular details like sales quota attainment, hiring progress against plans, and specific risk mitigation strategies - details that would overwhelm most investor updates.
Investor-Specific Metrics
Investors, in contrast, focus on metrics that quickly reveal growth trajectory and capital efficiency. One standout metric is the Burn Multiple, calculated by dividing net burn by net new ARR. A Burn Multiple under 1.5x signals efficient growth, while anything above 2x raises red flags. Another key benchmark is the Rule of 40, which combines growth rate and profit margin to assess whether the total exceeds 40%, balancing growth with profitability.
To gauge momentum, investors rely on metrics like month-over-month (MoM) and year-over-year (YoY) growth rates, sales pipeline volume, and customer acquisition velocity. Their primary concerns are answering two questions: "Are you on track?" and "Are you running out of money?". This is why investor reports prioritize high-level summaries and maintain consistent formatting, rather than the detailed variance breakdowns boards prefer. These differences in focus and presentation highlight the distinct needs of each audience and the rationale behind their respective reporting formats.
Format and Frequency Differences
The structure and timing of board and investor reports vary greatly, reflecting the unique needs and roles of each audience. These differences influence both the level of detail and the frequency of updates.
Board Reporting Format and Schedule
Board reports are detailed, quarterly presentations, typically spanning 10 to 25 slides. They’re designed to provide a deep dive into strategic and operational performance. These reports include comprehensive financial statements - Profit & Loss, Balance Sheet, Cash Flow - along with variance analyses (budget vs. actual) and discussions on key challenges. Founders often dedicate 4 to 8 hours to preparing these board packs, compared to just 30 to 60 minutes for a monthly investor update.
Timing is crucial. Board materials should be sent out 48 to 72 hours before the meeting, giving directors ample time to review the content. This allows meetings to focus on discussion rather than presentations. As Brad Feld, Managing Director at Foundry Group, puts it:
"The financials are decoupled from the board meeting. There is a quarterly financial and metric review in the board meeting, but it's not the meat of the meeting".
Investor Reporting Format and Schedule
Investor reports, on the other hand, are much shorter and follow a monthly schedule. These updates are typically 1–2-page emails that highlight the company’s key metrics and developments. Designed for quick consumption (3 to 5 minutes), they usually include:
- A TL;DR summary
- A KPI dashboard with 5 to 7 metrics
- Highlights and lowlights
- Specific "asks" for investor support
Punctuality is essential here as well. Monthly updates should be sent within 5 to 10 days of the month’s end. Consistently delivering high-quality financials within this timeframe not only reinforces trust but also correlates with higher valuations. Founders who meet this standard raise follow-on rounds at 2.1x higher valuations than those who don’t. As Philipp Siegert, Fractional CFO & Strategy Advisor, notes, timeliness and consistency are critical trust indicators for investors.
| Feature | Monthly Investor Update | Quarterly Board Pack |
|---|---|---|
| Format | Email or short document (1–2 pages) | Presentation/Slides (10–25 pages) |
| Audience | All investors and advisors | Board members and lead investors |
| Focus | Highlights, KPIs, and specific asks | Strategic analysis, financials, and decisions |
| Prep Time | 30–60 minutes | 4–8 hours |
| Delivery | Within the first 10 days of the month | 48–72 hours before the meeting |
These strict guidelines for format and timing emphasize the importance of efficient reporting processes.
How Automation Improves Reporting
Given the distinct requirements of board and investor updates, automation can significantly reduce preparation time while ensuring accuracy and consistency. Automation tools streamline data collection, keep formatting uniform, and minimize errors - key benefits when investors spend 60 to 70% of their financial review time analyzing metrics dashboards.
Lucid Financials offers a solution by automating the creation of both board-ready reports and investor-grade forecasts. The platform keeps financial data updated in real time, refreshes KPI dashboards automatically, and ensures reports are always ready for review. With reports delivered in just 7 days and AI-driven tools supported by financial experts, founders can meet tight deadlines without sacrificing quality. This combination of speed and precision fosters operational discipline, which investors highly value. In fact, delivering high-caliber financial reports consistently is linked to a 73% greater success rate in securing follow-on funding.
How Lucid Financials Simplifies Reporting

Preparing separate reports for boards and investors can eat up a lot of time. Lucid Financials takes this hassle off your plate by automating the creation of reports tailored to each audience's unique needs. The platform pulls operational data in real time, ensuring seamless, error-free integration. This means boards get the in-depth analysis they need, while investors receive the concise updates they expect. With these streamlined processes, Lucid makes targeted reporting for both groups simple and effective.
One-Click Investor-Ready Reports
Lucid creates investor-grade financial reports with just a click, using live data to deliver the focused metrics investors care about. Plus, it integrates directly with Slack, so founders can quickly access financial snapshots and respond to investor questions without juggling multiple tools. Whether it's for a routine update or an unplanned due diligence request, Lucid ensures you're ready in just seven days with accurate, up-to-date financial snapshots.
Board-Ready Dashboards and Insights
Board meetings require more than quick updates - they demand deep, strategic insights. Lucid provides detailed dashboards that go beyond basic metrics, offering variance analyses, cash flow projections, and actionable insights to guide governance discussions. Forget about manually assembling slides; Lucid lets you spend more time interpreting data and preparing for meaningful conversations. With AI-driven forecasts and scenario modeling, you're equipped to explore strategic options, not just share numbers.
Efficiency and Accuracy Through Automation
Lucid’s automated financial reporting eliminates manual errors and shifts your team’s focus from data entry to strategy. Its AI continuously updates financials and refreshes KPI dashboards, ensuring that both board packs and investor updates are built on the same accurate, real-time data source. To top it off, every AI-generated output is reviewed by experts, guaranteeing both speed and precision.
Conclusion: Matching Reports to Stakeholder Needs
Board reports and investor updates serve different purposes, tailored to meet distinct strategic and operational goals. Boards require detailed financial analysis, explanations for variances, and actionable insights to support their fiduciary responsibilities. Investors, on the other hand, value transparency and concise updates - monthly summaries that spotlight progress, challenges, and specific requests. The format, frequency, and focus for each audience should align with these differing priorities. Understanding this distinction is key to crafting effective updates.
Consistent, timely reporting builds trust. Founders who openly share challenges are 3.2x more likely to secure follow-on funding. As Philipp Siegert, Fractional CFO & Strategy Advisor, emphasizes, punctual reporting strengthens long-term credibility.
Key Takeaways for Founders
To strengthen governance and investor confidence, tailor your reporting to meet stakeholder needs. A quarterly board deck should include 15–25 slides with strategic insights, financial analysis, and scenario planning, requiring 4–8 hours to prepare. Monthly investor updates should be concise - just 1–2 pages highlighting key metrics, progress, and specific asks, taking 30–60 minutes. Use consistent metric definitions and address challenges head-on.
Structured reporting also supports internal decision-making. Jumpstart Partners highlights this distinction:
"The gap between 'we closed the month' and 'here's what the numbers mean and what we're doing about it' is the difference between bookkeeping and financial leadership".
Tools like Lucid Financials simplify the process, automating both board and investor reports from a single, reliable data source. This eliminates manual effort while delivering board-ready dashboards and easy investor updates.
Next Steps for Better Reporting
To improve your reporting process, consider these actionable steps: Use a fixed template and stick to it. Send monthly updates within the first 10 days of the month and deliver quarterly board decks 48–72 hours before meetings. Focus on 5–7 key metrics (such as ARR, burn rate, runway, and operational KPIs) to avoid overwhelming your audience. If reporting takes more time than analysis, explore automated solutions like Lucid Financials to streamline your workflow while ensuring accuracy and depth for every stakeholder group.
FAQs
What should I do if my board members and investors are the same people?
If your board members also serve as investors, it's essential to craft reports that cater to both perspectives. Reports for investors typically highlight trust-building, progress updates, and key metrics. On the other hand, board reports focus more on strategy, financial performance, and decision-making. To keep everyone informed and aligned, aim for comprehensive reports that address both sets of priorities. Tools like Lucid Financials can simplify this process by offering real-time, investor-ready reporting that meets the expectations of both groups.
Which 5–7 KPIs should always go in a monthly investor update?
When preparing a monthly investor update, it’s crucial to include 5–7 key performance indicators (KPIs) that give a clear snapshot of your company’s financial health and growth trajectory. These KPIs should cover:
- Revenue (MRR/ARR): Monthly Recurring Revenue (MRR) or Annual Recurring Revenue (ARR) showcase your company’s income consistency and growth over time.
- Cash Balance: This indicates how much cash your business has on hand to fund operations and growth.
- Burn Rate: A measure of how quickly your company is spending cash, helping investors understand your runway.
- Customer Acquisition Cost (CAC): This shows how much it costs to acquire a new customer, shedding light on your efficiency in scaling.
- Customer Lifetime Value (CLV): A key metric for understanding the long-term value each customer brings to the business.
- Gross Margin: Reflects profitability by showing how much revenue is left after covering the cost of goods sold.
- Operating Expenses: Tracks your spending to ensure it aligns with your growth strategy.
These metrics work together to provide investors with a comprehensive view of your business’s performance and potential.
How can I keep metric definitions consistent across board packs and investor updates?
To keep things consistent, create a standardized glossary for all metrics. This should include clear definitions, how each metric is calculated, and the data sources used. Make it a habit to review and update this glossary regularly to ensure everything stays aligned.
Using structured templates with built-in definitions can make reporting much easier. Tools like Lucid Financials can also help automate processes, cutting down on errors and saving time. Lastly, keep stakeholders in the loop - communicate any changes so everyone is on the same page and fully understands the metrics in both board and investor reports.