Most startup finance teams don’t need more spreadsheets. They need forecasts inside the tools they already use.
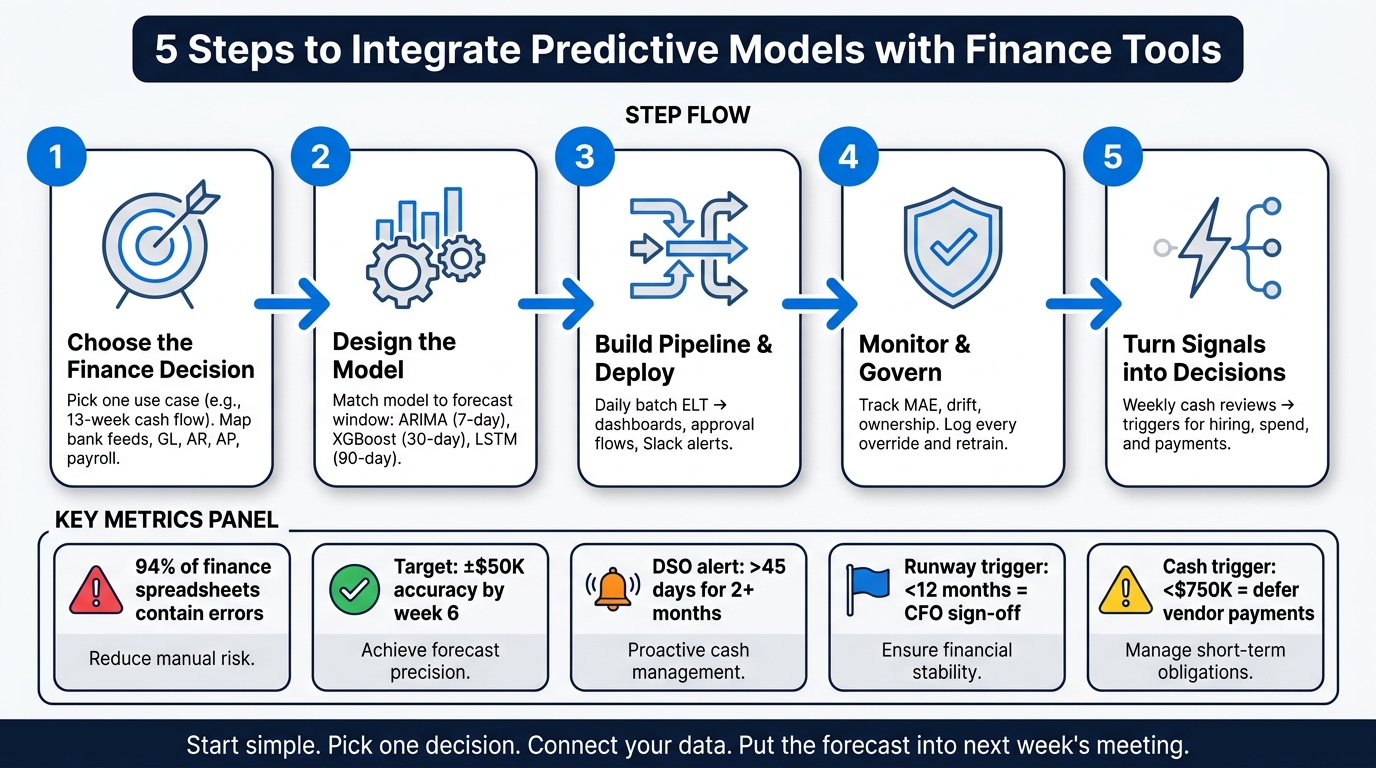
I’d sum up the article like this: pick one finance decision, connect the right data, use a model that fits the time frame, send the output into daily finance workflows, and tie it to clear approval rules. That matters because spreadsheet-only forecasting often fails from stale data, mismatched assumptions, and plain errors. The article points to a striking stat: 94% of finance spreadsheets contain mistakes.
If you want the short version, here it is:
- Start with one use case like weekly cash or a 13-week cash flow forecast
- Map core sources: bank feeds, GL, AR, AP, payroll, and recurring bills
- Use the simplest model that fits the forecast window
- Push forecasts into dashboards and approval flows
- Track error, drift, and ownership
- Turn forecast signals into actions for hiring, spend, and payments
A few numbers stand out right away:
- Aim for weekly cash forecasts within ±$50,000 of actuals 80% of the time by week six
- Use daily batch jobs first unless same-day timing changes the decision
- Watch for drift when DSO goes above 45 days for two months
- Set action triggers like base runway below 12 months or weekly cash below $750,000.00
| Step | What I’d focus on | Main outcome |
|---|---|---|
| 1 | Pick one decision and map data | One clear forecast use case |
| 2 | Match the model to cash drivers | Better fit for 7-, 30-, or 90-day views |
| 3 | Build the pipeline and ship outputs | Forecasts show up where finance works |
| 4 | Track error and set controls | Fewer surprises and clearer ownership |
| 5 | Link signals to decisions | Repeatable calls on hiring, spend, and cash |
The core idea is simple: don’t keep predictions trapped in a model file. Put them where your team reviews cash, approvals, and runway every week.
5 Steps to Integrate Predictive Models with Finance Tools
Foundations of AI in Financial Forecasting | Building Smarter Predictions with AI | Uplatz
sbb-itb-17e8ec9
Step 1: Choose the Finance Decision and Map Your Data Sources
Before you touch a model or dataset, get clear on which finance decision you want to improve. That decision should guide the data you pull, how current it needs to be, and how you'll measure success. The point isn't just to predict cash. It's to push better forecasts into day-to-day finance work. That choice tells you which inputs matter most and how the model should support finance decisions.
Start With One Forecast Use Case
Don't try to forecast everything at once. Start with one use case, ideally weekly cash balance or a 13-week cash flow forecast. Both are good starting points because they have clear success metrics, frequent feedback, and depend on data you likely already have in bank feeds and the general ledger. Aim for weekly cash forecasts within ±$50,000 of actual balances 80% of the time by week six.
A single use case makes validation faster and easier to read. Once the model is stable and people trust it, moving into runway or collections is a lot less risky.
Map Bank, Ledger, AR, AP, and External Inputs
Once you've picked the use case, map every system that affects the cash flows you're forecasting. For a weekly cash or 13-week forecast, the core sources are:
- Bank feeds - transaction-level data from checking, savings, and any credit or loan accounts
- General ledger - reconciled entries, journal detail, and account-level history
- AR module - open invoices, customer payment terms such as net 30, and past collection behavior
- AP module - approved vendor bills, due dates, and planned payment batches
- Payroll schedules - pay dates, gross pay, taxes, and benefits for each pay cycle
- Recurring obligations - rent, SaaS subscriptions, debt service, and quarterly estimated tax payments
Keep every source on the same weekly cadence.
Add external inputs only when they make a clear difference in forecast accuracy. A good rule: add an external indicator only if it cuts backtest error by at least 5% to 10%.
Data Source Priority Table
Not all data sources pull the same weight. Rank them by how fast they update, how much detail they give you, and how closely they tie to the cash flows you're modeling.
| Data Source | Typical Latency | Granularity | Primary Owner | Inflow Usefulness | Outflow Usefulness |
|---|---|---|---|---|---|
| Bank APIs (checking, savings) | Near real-time / same-day | Transaction-level (date, amount, description) | Finance / Accounting | High - customer payments, funding, refunds | High - payroll, vendor payments, card charges |
| ERP / Accounting Ledger | Daily to month-end | Account-level, journal entries, periods | Accounting / CFO | Medium - aggregates revenue and AR impact | High - structured view of expenses, AP, accruals |
| AR Module (invoices) | Daily to weekly | Invoice-level (customer, due date, status) | Finance / RevOps | High - collections timing and cash conversion | Low - mainly indirect via bad debt |
| AP Module (bills) | Daily to weekly | Bill-level (vendor, due date, amount) | Finance / AP Team | Low | High - planned vendor payments and scheduling |
| Payroll System | Per pay run | Employee-level, gross/net, taxes | HR / Finance | None | High - recurring, predictable outflows |
| External Indicators (macro, CRM) | Weekly to monthly | Aggregated / index-level | Various | Low to medium - scenario overlays only | Low - limited direct cash linkage |
Bank APIs and your reconciled ledger are the base layer. AR and AP modules add the timing detail that turns a rough estimate into something finance can use. Clean, reconciled data is the best place to start for model inputs.
With the decision and data map set, Step 2 can match the model to the cash-flow drivers that matter most.
Step 2: Design the Model Around Real Cash Flow Drivers
Pick the simplest model that matches your forecast window, the data you have, and how much explanation people will need.
Pick a Model That Fits Your Forecast Horizon
Start with the top inputs from Step 1. Then use them to shape both the model features and the forecast window.
- Use ARIMA/SARIMA for 7-day forecasts when cash patterns stay fairly steady. It works well with smaller datasets and gives outputs that are easier to explain to founders and investors.
- Use XGBoost or LightGBM for 30-day forecasts when you have structured business drivers. Feature importance scores help show which inputs are pushing the forecast.
- Use LSTM only for 90-day forecasts when you have a long, clean time-series history. It can pick up nonlinear patterns, but it’s harder to explain and often overkill for early-stage teams.
Build Features From Payment Timing and Operating Patterns
Base the model on signals tied to actual cash movement: lagged inflows and outflows, payroll dates, rent, tax deadlines, AR timing, AP timing, customer payment behavior, seasonality, U.S. holidays, and close timing. Add invoice age buckets and historical days-to-pay by customer segment so the model mirrors how collections tend to happen in practice.
This part matters more than it may seem. A cash forecast can look solid on paper and still fall apart if the inputs ignore how money moves in and out of the business day to day.
These features only help if you test the model in time order instead of using random splits. Use a time-based split: train on the earliest period, validate on the next period, and test on the most recent period.
Model Comparison Table
| Model | Interpretability | Best Fit | Seasonality Handling | External Drivers | 7-Day Forecast | 30-Day Forecast | 90-Day Forecast |
|---|---|---|---|---|---|---|---|
| ARIMA / SARIMA | High - easy to explain to finance and investors | Stable cash patterns and shorter horizons | Built-in with SARIMA | Limited | Often strong | Moderate | Weaker |
| Gradient Boosting (XGBoost, LightGBM) | Medium - feature importance scores help explain outputs | Driver-heavy forecasts with structured inputs | Requires feature engineering | Strong | Strong | Strong | Moderate |
| LSTM | Lower - harder to interpret without documentation | Large, sequential datasets with nonlinear patterns | Learns from sequences | Strong | Can work | Strong | Strong with enough data |
Once the model is validated, connect its outputs to finance dashboards, approvals, and planning tools.
Step 3: Build a Data Pipeline and Deploy Outputs Into Finance Workflows
A validated model doesn't do much on its own. It needs clean, current data, and its outputs need to land in places finance teams already use. So the job here is simple: build the pipeline, then send forecasts into the workflow. Pick batch or real-time based on how fast the decision has to happen.
Set Up Batch or Real-Time Data Flows
For most startups, ELT makes more sense than ETL. Load raw data into a warehouse or lake, then organize it by source, date, and entity. Standardize dates, currency, and source labels. Keep a data dictionary that maps raw labels to standard categories so your model features don't drift over time.
For most startups, daily batch jobs are the right starting point. A nightly run that refreshes bank balances, open invoices, approved bills, and expense accruals gives you a solid operating base without a lot of extra moving parts. Near-real-time or streaming feeds make sense only when intraday decisions are actually on the line, like automated payment throttling or dynamic credit limits. If latency doesn't change the decision, the extra infrastructure usually isn't worth it.
Push Predictions Into Dashboards, Approvals, and Planning
Store forecast outputs in a forecasting table or schema in your warehouse with a consistent structure: entity_id, scenario_name, week_ending_date, metric, value, model_version, and run_timestamp. That way, dashboards, planning tools, and analysts all pull from the same source instead of working from duplicate data that slowly drifts apart.
For delivery, use scheduled jobs and API calls together. Scheduled jobs can refresh core metrics like projected cash balance, burn rate, and runway, then write them into tables that dashboards or approval systems read on their own. For one-off approval decisions, an API endpoint can run at decision time and return the forecast impact of that specific action. That's useful when finance needs to decide whether to approve a new hire now or delay a vendor payment by a week or two.
The dashboard should make the output easy to act on. Show weekly ending cash for the next 13–26 weeks. Add color-coded bands, such as a caution threshold below $1,000,000 and a critical threshold below $500,000. Show runway in two ways: months and a calendar date. For example: Runway: 9.2 months (expected cash-out date: 05/15/2027). Scenario toggles like Base, High Hire, and Reduced Marketing let the team see how planned moves affect the forecast before anyone commits. Lucid Financials surfaces forecast insights in Slack, so founders can check runway without leaving their workflow.
Pipeline and Deployment Comparison Table
| Approach | Latency | Complexity | Governance | Best Fit |
|---|---|---|---|---|
| Batch pipeline (nightly ELT) | Hours | Low | Easier - reproducible runs, simple audit logs | Daily cash forecasting, runway analysis, monthly close |
| Real-time / streaming pipeline | Milliseconds to seconds | High | Harder - requires stream versioning and error handling | Intraday liquidity monitoring, payment throttling, fraud detection |
| Embedded dashboard | Refresh-based | Low | Centralized - access and changes managed in one place | Weekly cash reviews, board reporting, investor updates |
| API-driven deployment | On-demand | Medium–High | Requires endpoint logging and access controls | Per-event approvals: vendor payments, hiring decisions, credit limits |
Use batch for routine forecasts. Save real-time feeds for cases where speed changes the outcome. Once the pipeline is running, move on to tracking error, drift, and ownership in Step 4.
Step 4: Monitor Accuracy, Set Governance Rules, and Improve the System
Once forecasts are live, you need to keep an eye on accuracy and drift. In practice, that means making forecast quality part of the weekly finance rhythm. Review bank balance forecasts, runway, and approval signals against what actually happened.
Track Forecast Error and Drift Against Actual Cash Results
Compare forecasted and actual bank balances at 7, 30, and 90 days. Track MAE and bias for each time frame. MAE shows how far off the forecast is. Bias shows whether the forecast tends to run high or low.
For lean teams, simple thresholds make this easier to manage. A 7-day MAE under 3% to 5% of average weekly cash inflows is usually acceptable. At 30 days, keep MAE under 5% to 8% of total monthly outflows. If your 90-day runway forecast misses by one month or more, that's a sign to retrain the model, not just leave a note.
Drift often shows up after pricing changes, hiring, funding, or shifts in customer mix. Those changes can move your Days Sales Outstanding (DSO) or Days Payable Outstanding (DPO) enough that past model behavior stops being reliable. A simple rules-based alert can catch problems early without a data science team. For example:
- Flag DSO if it rises above 45 days for two straight months
- Flag payroll if monthly payroll rises more than 15% above the prior-quarter average
When drift shows up, governance rules should make it clear who can retrain the model, override the forecast, or approve it.
Define Approvals, Controls, and Reporting Ownership
Give each forecast one owner and tie it to the decision it supports.
The finance lead, or fractional CFO, owns data accuracy and weekly forecast checks. The CEO owns risk appetite: what level of error is okay, and what runway floor should trigger action. Department heads own variance explanations inside their cost centers. No forecast should go into a board deck, tax plan, or major spend approval until it has passed the weekly or monthly review for reasonableness.
For audit readiness, log every material change. That includes updated payment-term assumptions, model retrains, and manual overrides to forecast outputs. Each log entry should record:
- Who made the change
- What changed
- When it changed
- Why it changed
Use one workflow for accounting, forecasting, and approvals so every material change can be traced.
Access control should follow the same idea. Separate the people who can view raw bank and ledger data, the people who can change model assumptions, and the people who can approve forecast-driven actions. Engineers can set up pipelines, but they shouldn't be able to edit approval policies. Department heads can review forecasts and suggest actions, but they shouldn't be able to change core parameters such as DSO assumptions or runway thresholds. Document role-based access to support audit readiness.
Governance and Monitoring Table
| Control | Owner | Trigger / Threshold | Review Frequency |
|---|---|---|---|
| Forecast error check (MAE vs. actuals) | Finance lead | 7-day MAE >5% of weekly inflows; 30-day MAE >8% of monthly outflows | Weekly |
| Drift alert (DSO, DPO, payroll trends) | Finance lead | DSO >45 days for 2+ months; payroll up >15% vs. prior quarter average | Monthly |
| Model retrain decision | Finance lead + CEO | 30-day error >10–15% of monthly outflows for 2+ months; 90-day runway off by 1+ month | Quarterly or event-driven |
| Forecast approval for board or investor use | CEO + finance lead | Any forecast used in board packs or investor updates | Before each board meeting |
| Spend / hiring approval | CEO (threshold >$50,000 incremental) | Forecast must show runway above minimum reserve (3–6 months) | Per decision |
| Audit log review | Finance lead | Any model parameter change, override, or retrain | Monthly |
| Access control review | Finance lead | Role changes, new hires, departures | Quarterly |
A 60–90 minute monthly meeting with the finance lead, CEO, and department heads is usually enough to review error metrics, drift signals, and any pending calls on retraining or feature updates. Keep the outcome in a simple log. Use that monthly review to adjust thresholds, retraining plans, and approval rules.
Once monitoring and governance are in place, forecasts can start supporting repeat finance decisions.
Step 5: Turn Forecasts Into Recurring Finance Decisions
Once monitoring and governance are in place, the next job is simple: make sure forecasts lead to repeatable decisions. The owners and thresholds from Step 4 give you the setup. Now you turn each signal into a clear finance move.
Use Forecasts in Weekly Cash and Runway Reviews
Run a weekly 13-week cash review with the finance lead and CEO. The point isn't just to look at the model. It's to turn that output into cash decisions.
In each review, look at forecasted opening cash, expected inflows and outflows, and ending cash balances for every week in the period ahead. Start from Friday's actual bank balance in USD, then roll the forecast forward by one week.
Variance gaps should feed straight back into the model. If the same gap keeps showing up, update assumptions and take action. That might mean changing payment timing, slowing hiring, or cutting spend. Before the meeting wraps up, convert net burn into months of runway across base, upside, and downside cases. Then decide if you need to defer payments, pause purchases, or reset assumptions.
After each close, use the updated 3–6 month forecast to set spending envelopes by department. If runway gets close to a trigger, start fundraising prep right away by pulling together scenario models, cohort analyses, and board materials.
When the same variance shows up twice, treat it as a standing trigger.
Set Action Thresholds for Spend, Hiring, and Payments
Write down triggers for spend, hiring, and payments. If they're not written down, people will improvise. That's when decisions drift.
A practical starting point for a U.S.-based startup looks like this:
- If base runway drops below 12 months, every new hire needs CEO and CFO sign-off.
- If base runway drops below 9 months, freeze non-critical roles until runway recovers.
- If forecasted cash in any week across the next 12 weeks falls below $750,000.00, the CFO reviews discretionary spend and proposes cuts within 5 business days.
- If projected weekly cash drops below the trigger, defer non-essential vendor payments from Net-30 to Net-45 or Net-60 where contracts allow, and schedule those payments just after major inflows.
Log the forecast used, the trigger hit, and the decision made.
Keep all of these triggers in one shared decision log.
Decision Workflow Table
| Forecast Signal | Finance Action | Owner | Timing | Escalation Path |
|---|---|---|---|---|
| Base runway < 12 months | Require CFO + CEO sign-off on all new hires | CFO, CEO | Within 5 business days | Inform board at next quarterly meeting |
| Base runway < 9 months | Freeze non-critical hires; begin fundraising prep | CEO, CFO | Within 10 business days | Send special investor update |
| Forecasted weekly cash < $750,000.00 | Defer discretionary vendor payments; cut non-essential spend | CFO, department leads | Before affected week starts | Escalate to CEO if balance < $500,000.00 |
| DSO forecast > 55 days | Launch collections outreach; review credit terms | Finance, Sales Ops | Within 7 calendar days | Report in monthly financial review |
| Expense spike > 20% above planned monthly spend | Approve only mission-critical expenses; re-forecast cash | CFO | Within 3 business days | Include in next board package |
Conclusion: The 5-Step Path to Better Financial Decisions
Taken together, these five steps create a closed loop from forecast to decision. This is a repeatable process, not a one-off project: pick a decision, connect the data, model the drivers, deploy the forecast, and turn signals into action.
The payoff is simple: faster, clearer decisions. You get tighter runway visibility, a faster response to cash risk, and investor-ready answers in minutes. More importantly, this loop helps teams act on forecasts before cash pressure turns urgent.
It also scales with company stage. A small startup might begin with basic bank and ledger data. A larger company might run multi-entity scenario models and board reporting. Same loop, different level of detail.
Start simple. Pick one decision, connect your core data, and bring a basic forecast into your next weekly cash meeting. Then add variance tracking and one or two governance rules over the next 30 days. With each weekly cycle, the model gets better and the decision gets sharper. Lucid Financials can help keep books clean and reporting current as you build the workflow.
Pick one decision. Connect the data. Put the forecast into next week's meeting.
FAQs
How do I choose the best first forecasting use case?
Start with one high-stakes financial decision that affects survival or growth, like a cash flow gap or runway pressure.
Then pick a manageable project with data you already have access to, such as accounts receivable, revenue, or payroll. The goal is simple: build a forecast that leads to a clear action, not just another report sitting in a dashboard.
That might mean deciding when to cut spending, when to speed up collections, or when to hire. Lucid Financials can help by giving you the real-time data integration needed to make that forecast usable.
What data do I need before building a cash forecast model?
Before building a reliable cash forecast model, pull together 12 to 24 months of clean historical transaction data. That time range helps you spot seasonal patterns, payroll timing, and recurring expenses that can quietly shape cash flow month after month.
Use data from your accounting software, banking systems, payroll platforms, accounts receivable and payable tools, and expense systems. Bring in relevant market data too. Then make sure everything is standardized, reconciled on a regular basis, and cleaned up so you’re not dealing with issues like duplicate vendor names or split-up categories that refer to the same thing.
When should finance teams retrain or override a forecast?
Finance teams should retrain a predictive model when its performance starts to slip over time. That usually happens because the underlying data changes, the relationship between inputs and outcomes shifts, or the labels no longer match current conditions. In plain English: the model was trained on one version of reality, and the business is now dealing with another.
That’s why regular monitoring matters. Track accuracy and relevance on a steady basis, and retrain or fine-tune the model when forecasts begin to drift in a meaningful way from actual results or business goals.
Overrides make sense in high-stakes cases, especially when the model can’t see important context. Think strategic pivots, new regulations, or other qualitative factors that don’t show up in the data but still shape the decision.