AI-powered scenario modeling is reshaping how companies prepare investor-ready financial reports. These reports go beyond static spreadsheets, offering dynamic, multi-scenario forecasts that adjust in real time. Here's why this matters:
- What are investor-ready reports? They provide a clear snapshot of your company’s financial health, including revenue, cash flow, essential financial metrics, and forecasts. They’re essential for building confidence during fundraising.
- Why use AI? Traditional spreadsheets are static and slow. AI generates multiple scenarios - base, upside, and downside - based on live data, enabling faster, more informed decisions.
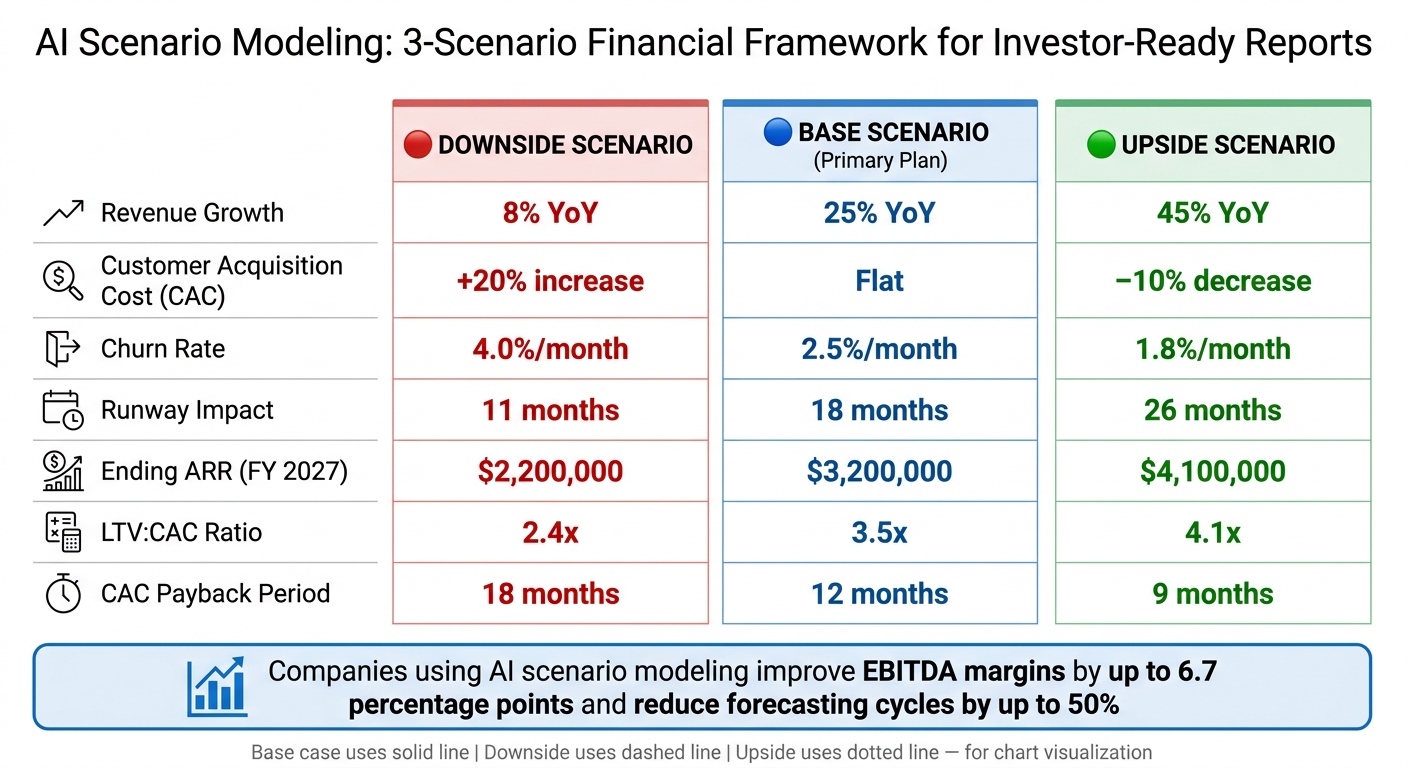
- Key benefits: Companies using AI report improved EBITDA margins (up to 6.7 percentage points) and reduced forecasting cycles by up to 50%.
AI Powered Scenario Analysis | Course Module
sbb-itb-17e8ec9
Building the Foundation for AI Scenario Modeling
Creating a solid AI scenario model is essential for delivering investor-ready reports that build trust and credibility.
Key Data Sources and Tools for Scenario Modeling
High-quality data is the backbone of accurate AI forecasts. For financial scenario modeling, this means gathering information from several critical categories: core financial metrics, sales and marketing data, workforce expenses, and external market trends.
| Data Category | Key Data Points | Primary Sources |
|---|---|---|
| Financials | Revenue, COGS, Gross Margin, EBITDA, Cash Balance | QuickBooks, Xero, NetSuite, SAP |
| Sales/Marketing | CAC, AOV, Conversion Rates, Ad Spend | Salesforce, HubSpot, Google Ads |
| Human Capital | Headcount, Salaries, Benefits, Hiring Timelines | Workday, Gusto, Payroll Exports |
| External | Interest Rates, FX Rates, Competitor Comps | Bloomberg, FactSet, SEC EDGAR |
To ensure your models stay up-to-date, use live data connections through tools like Snowflake, BigQuery, or Postgres.
How to Structure and Clean Your Historical Data
Messy data can lead to AI models making inaccurate predictions with misplaced confidence. To avoid this, standardize data formats and reconcile historical records before feeding them into AI tools. Use consistent formats like USD currency symbols, MM/DD/YYYY for dates, and period-based decimal notation (e.g., $1,250,000.00). Discrepancies between CRM and accounting data can create conflicting signals, so aim for one unified source of truth. For example, agree on a single definition for metrics like Monthly Recurring Revenue (MRR) and apply it consistently.
"The best AI software for financial scenario analysis combines flexible modeling, machine-generated forecasts, real-time integrations, and strict governance." – Ameya Deshmukh, Everworker
Once your data is clean and reconciled, focus on the specific questions your scenario model needs to answer.
Defining the Scope of Your Scenario Model
With clean, connected data, the next step is to clearly outline the goals of your model. A well-defined scope prevents unnecessary complexity and ensures your outputs remain relevant to investors.
An 18–36 month horizon with monthly granularity strikes the right balance - it’s long enough to show strategic direction while detailed enough to monitor short-term cash flow. Concentrate on projections for P&L, cash flow, and runway under various scenarios.
After organizing your data, leverage AI to generate base, upside, and downside scenarios quickly. Export these models for further refinement. While AI speeds up scenario creation, traditional spreadsheets still play a valuable role in ongoing tracking and updates.
Building AI-Driven Multi-Scenario Models
AI Scenario Modeling: Base vs. Upside vs. Downside Financial Projections
Identifying Key Drivers and Variables
Once your data is clean and your goals are clear, the next step is identifying the key variables that influence outcomes like revenue, cash flow, runway, and margin. These are the levers that directly impact your financial results. For example, changes in the mix of subscription versus one-time purchases can ripple through gross margin, EBITDA, and cash balance. The key is to ensure every driver you include can be traced back to your profit and loss statement.
Collaboration across teams is essential here. The marketing team might have the best insights into customer acquisition costs (CAC) and average order value (AOV), while the operations team likely tracks fulfillment costs and vendor pricing. By combining these perspectives, AI can uncover hidden revenue drivers that might go unnoticed with manual analysis.
Setting Assumptions and Scenario Ranges
After identifying the drivers, the next step is to build realistic assumptions around them. Avoid overcomplicating your model or relying solely on intuition - ground your assumptions in historical data and use AI for stress testing.
A three-scenario framework works well for this:
| Scenario | Revenue Growth | CAC | Churn Rate | Runway Impact |
|---|---|---|---|---|
| Base | +25% YoY | Flat | 2.5%/month | 18 months |
| Upside | +45% YoY | –10% | 1.8%/month | 26 months |
| Downside | +8% YoY | +20% | 4.0%/month | 11 months |
Your assumptions should reflect your business's actual performance rather than relying on generic benchmarks. For example, if your CAC has ranged between $120 and $180 in the past year, use that range as the foundation for your model. U.S. investors, especially those involved in Series A and B funding, will scrutinize these assumptions, so be ready to back them up with solid data.
Using AI to Strengthen Scenario Analysis
AI takes scenario modeling to a new level by analyzing thousands of variable combinations at once and pinpointing the ones that matter most. This level of sensitivity analysis is far beyond what traditional spreadsheets can achieve.
For example, AI can quickly answer questions like, "What happens to our runway if sales velocity drops by 20% while CAC increases by 15%?" or "How does a 3-point rise in churn affect our cash position over 24 months?" Companies that use AI for scenario planning have reported improvements in EBITDA margins within the first year, highlighting how this approach leads to smarter decision-making compared to manual testing.
A growing trend is conversational modeling, where AI tools allow you to run scenarios using plain-language questions instead of complex spreadsheet edits. For instance, you could ask, "What happens if AOV decreases by $3?" and get an updated model instantly. This lets your team spend more time interpreting results and less time reworking formulas when assumptions change.
Turning Scenario Outputs into Investor-Ready Reports
Once you've built your multi-scenario models, the next step is transforming those insights into reports that are ready to impress investors. The goal here is to take the outputs from your AI-driven scenario model and package them into a clear, concise report that ties your assumptions to outcomes while making your funding request unmistakable.
Core Components of an Investor-Ready Report
Investor reports need to be complete yet concise. Most U.S. investors expect a 1–2 page executive summary that highlights your business model, summarizes base, downside, and upside scenarios, and clearly states your funding request in U.S. dollars. For example: "We are raising $4,000,000 to extend our runway to 24 months and reach $5,500,000 ARR."
In addition to the summary, the report should include:
- 3–5 year financial projections: Cover the income statement, cash flow, and key metrics like ARR, gross margin percentage, and burn rate.
- Unit economics: Include critical metrics such as CAC, LTV, the LTV:CAC ratio, and CAC payback period.
- Use-of-funds breakdown: Explain how the requested funding will be allocated.
- Assumptions appendix: Clarify which inputs come from historical data, which are AI-derived, and which reflect management’s judgment.
How to Present Scenario Comparisons Clearly
To make scenario comparisons easy to digest, use a simple table focused on a single future period, like FY 2027. Pair this with visuals like line and cash balance charts for added clarity. Here's an example:
| Metric (FY 2027) | Downside | Base | Upside |
|---|---|---|---|
| Ending ARR | $2,200,000 | $3,200,000 | $4,100,000 |
| Cash Burn / Month | $190,000 | $210,000 | $240,000 |
| Runway (Months) | 13 | 19 | 24 |
| LTV:CAC | 2.4x | 3.5x | 4.1x |
| CAC Payback (Months) | 18 | 12 | 9 |
For visual consistency, use a solid line for the base case, dashed for the downside, and dotted for the upside, with colors like blue, red, and green to help investors quickly follow the comparisons.
When explaining these visuals, focus on the base case as your primary plan. Use the downside to highlight potential risks and how you plan to handle them, followed by the upside to showcase the growth potential. For example: "The downside scenario assumes CAC increases by 30% and sales cycles extend by 2 months, resulting in 20% lower ARR and 6 fewer months of runway by Q4 2027."
Using AI and Automation to Package Reports
Assembling reports manually can be a tedious process, especially when every change in assumptions means updating charts and tables. This is where AI and automation can save the day. According to a Workday Adaptive Planning survey, companies that use modern tools with AI reduce budgeting and forecasting cycle times by up to 50%. This allows finance teams to focus on crafting a compelling narrative instead of reworking the model.
Tools like Lucid Financials take automation even further. By connecting directly to your general ledger, Lucid Financials can generate investor-ready reports that update automatically as your data changes. Instead of scrambling to rebuild your presentation for every investor meeting, your tables, charts, and commentary refresh in real time. The result? A polished, up-to-date report that stands up to investor scrutiny without the last-minute stress.
Conclusion: Using AI to Stay Investor-Ready
Key Takeaways for Startup Teams
Our analysis highlights that keeping financial models accurate and up to date is key to building trust with investors. Startups that treat financial modeling as an ongoing process - updating scenarios monthly and preparing for investor questions year-round - stand out as the most reliable.
Here’s what matters most: clean data is the foundation. If your historical financials - like your P&L, balance sheet, and cash flow statements - aren’t accurate and reconciled, the insights AI provides will only be as good as the data you feed it. Once your data is in order, focus your model on a few key drivers. Metrics like revenue growth, CAC, churn, and burn rate tell a much clearer story than overly complex models with countless assumptions. According to McKinsey, companies using AI in planning and forecasting improve forecast accuracy by 10–20% and reduce budgeting cycle times by 25–50%. That’s time you can redirect toward strategy and investor communications instead of wrestling with spreadsheets.
It’s also worth remembering that AI is a tool to enhance your judgment, not replace it. Use it to identify trends, test assumptions, and quickly compare scenarios. However, deciding which scenarios are realistic and shaping the narrative for investors is still up to your team.
By adopting these practices and using an automated platform, you can stay prepared for investor scrutiny. Dedicated AI tools help ensure your financial reports are always accurate and ready to present.
How Lucid Financials Keeps You Always Ready
This is where Lucid Financials comes in. Built on a foundation of clean data, Lucid Financials automates the process of staying investor-ready. It integrates bookkeeping, tax, tax credits, and CFO support into one seamless platform - exactly what’s needed to support AI-driven scenario modeling.
Lucid Financials provides automated multi-scenario forecasts and real-time, board-ready reports that adjust as your numbers change. Founders can even ask questions directly through Slack - like "How does our runway look if we hire two sales reps in Q3?" - and get immediate, AI-assisted answers. Behind these outputs, experienced finance professionals review assumptions and refine the narrative, ensuring your investor communications are accurate and credible.
FAQs
What’s the minimum data I need to start AI scenario modeling?
To get started with AI scenario modeling, you'll need essential financial metrics such as revenue, expenses, and cash flow. These figures allow the AI to generate precise, investor-ready reports and conduct effective scenario analysis. Make sure your data is clean, consistent, and current to help the AI provide actionable insights and trustworthy projections.
How do I validate AI-generated assumptions for investors?
To ensure that AI-generated assumptions in financial reports meet investor expectations, it's crucial to prioritize accuracy and reliability. AI tools play a key role by cleaning up data, spotting anomalies, and highlighting inconsistencies that might otherwise go unnoticed. Scenario modeling is another essential step - it evaluates best-case, worst-case, and baseline outcomes to ensure the assumptions are grounded in reality. Additionally, integrating real-time data and providing regular updates help keep these assumptions aligned with the latest financial insights, minimizing errors and boosting trust in the projections.
How often should I update scenarios and investor reports?
Scenarios and investor reports need regular updates to keep the information accurate and useful. Conducting reviews on a monthly or quarterly basis is a smart way to ensure that investors always have access to the latest financial insights.