If you want the short answer: most SaaS startups should see gross margin improve as they grow, but the “right” number depends on the model. Pure subscription SaaS often aims for 75%–85% at scale, vertical SaaS with services often lands around 55%–75%, and marketplace or usage-based SaaS can sit much lower early on.
Here’s the part I’d focus on first: investors don’t just look at the number - they look at the trend. A company moving from 58% to 66% can look better than one stuck at 72%. That’s because gross margin helps show whether revenue is scaling faster than delivery costs.
In plain English, this article shows:
- What gross margin is: (Revenue − COGS) ÷ Revenue × 100
- What counts in COGS for SaaS: hosting, support, APIs, implementation tied to delivery
- How benchmarks change by stage: from about 50%–65% near $1 million ARR to 70%–85% at $50 million+ ARR
- Why model matters: pure software, services-heavy SaaS, and usage-based SaaS should not be judged the same way
- What investors see as warning signs: margins below about 50%, 55%, 65%, or 70% depending on stage and model
- Why margin matters to payback: with $100 monthly ARPU and $1,000 CAC, payback is about 13 months at 75% gross margin vs. almost 20 months at 50%
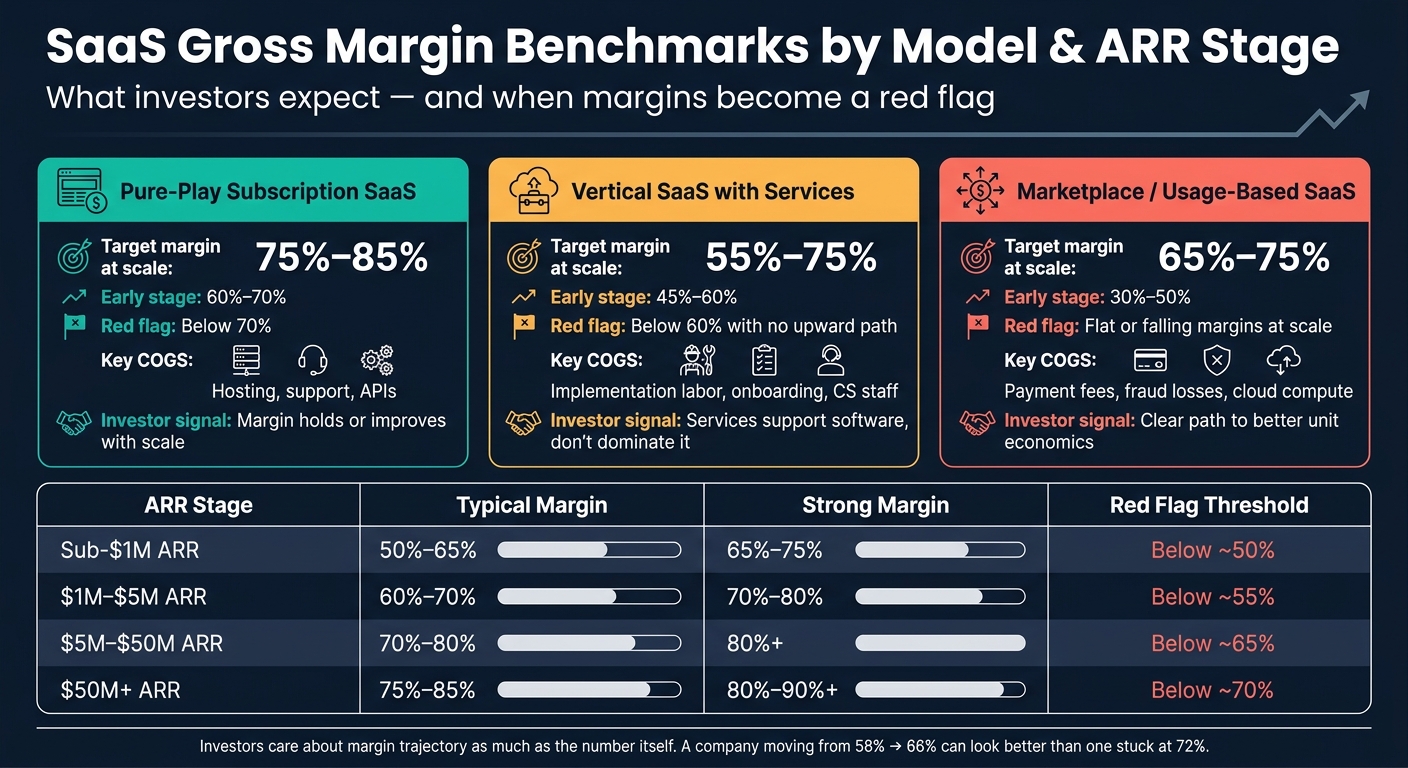
SaaS Gross Margin Benchmarks by Model & ARR Stage
Should You Target 80% Gross Profit in SaaS? Let’s Break It Down | SaaS Metrics School | Gross Profit
sbb-itb-17e8ec9
Quick Comparison
| SaaS Type | Common Margin Range | What Usually Pulls It Down | What Investors Want to See |
|---|---|---|---|
| Pure subscription SaaS | 70%–85%+ | hosting, support, API/tooling costs | margin holds or improves with scale |
| Vertical SaaS with services | 55%–75% | implementation labor, onboarding, service delivery | services support software, not dominate it |
| Marketplace / usage-based SaaS | 30%–75% depending on stage | payment fees, fraud, compute, variable usage costs | a path to better unit economics over time |
The main takeaway is simple: don’t compare your startup to a random SaaS average. Compare it to companies with a similar ARR stage and the same delivery model. That gives you a much better read on whether your margin is healthy, weak, or just normal for how the business works.
1. ARR Stage Benchmarks
At each ARR stage, the core question stays the same: is COGS growing more slowly than revenue?
That’s the heart of the story. As a SaaS company grows, gross margin should improve because delivery gets more efficient. If that doesn’t happen, something in the model is off.
Sub-$1M ARR
At this point, margins are often held back by support-heavy customers and messy infrastructure. Hosting usually isn’t tuned yet, early users may need lots of hand-holding, and onboarding often lives in someone’s inbox instead of a clear process.
Anything below ~50% is a red flag. In plain English, it usually means the company leans too hard on custom services or still hasn’t built a clean way to deliver the product at scale.
Investors at this stage usually care more about product-market fit and whether margins are settling into a better range than about hitting a perfect top-line benchmark.
$1M–$5M ARR
By now, the business should start looking more repeatable. Onboarding should get smoother, COGS should be separated more cleanly, and margins should move up.
Strong teams usually improve this by:
- tightening discounting
- negotiating better cloud contracts
- adding self-serve support
A margin below ~55% is a structural concern. It can point to a product that needs too much customization for a SaaS model that’s supposed to scale cleanly.
This is also the stage where investors start asking a sharper question: do new customers add revenue faster than they add COGS?
$5M–$50M ARR
At this stage, investors want to see delivery that scales without lots of manual work. The big shift in COGS is moving away from people-heavy delivery and toward automation and self-serve support.
A margin below ~65% starts to trigger real scrutiny. Investors will want to know whether the business is being classified the right way, or whether services-heavy delivery is quietly pulling margins down behind the scenes.
$50M+ ARR
By this point, hosting costs should improve through volume discounts, support should be mostly tiered, and professional services - if they exist - should be priced and tracked separately from subscription revenue.
A margin below ~70% at this ARR level is a meaningful red flag unless the business is built around higher-cost delivery, such as usage-based infrastructure or industry-specific services.
Model mix still matters. But at this size, stage by itself shouldn’t explain weak margins.
Use the table for a quick scan. The notes above explain why each band tends to look the way it does.
| ARR Stage | Typical Margin | Strong Margin | Red Flag |
|---|---|---|---|
| Sub-$1M | 50%–65% | 65%–75% | Below ~50% |
| $1M–$5M | 60%–70% | 70%–80% | Below ~55% |
| $5M–$50M | 70%–80% | 80%+ | Below ~65% |
| $50M+ | 75%–85% | 80%–90%+ | Below ~70% |
2. Pure-Play Subscription SaaS
Once a SaaS company is delivered mostly through software, revenue mix starts to matter more than ARR alone. For a software-first subscription business, the target at scale is 75%–85% of subscription revenue. Hitting 80%+ is often seen as best-in-class at scale.
The logic is pretty simple: in pure-play SaaS, fixed delivery costs should spread across more revenue as the business grows. That’s why scaled companies are expected to land in the 75%–85% range, while early-stage pure-play SaaS businesses often sit closer to 60%–70%.
Pure-play SaaS should do better than services-heavy models because the product is delivered mostly through software. If gross margin stays below 70%, that’s usually a warning sign for a company that wants to be seen as pure-play SaaS. Investors may take that to mean there are hidden services in the model or weak cost control.
COGS Profile
COGS in pure-play SaaS should stay fairly tight. It usually includes hosting, production reliability work, third-party tools, payment fees, and support tied directly to delivery.
Problems show up when companies push sales, marketing, product, R&D, or G&A costs into COGS. That can inflate reported gross margin above 85%–90%. And instead of thinking, “wow, this business is incredibly efficient,” investors often think the opposite: COGS is probably being under-reported.
Investor Interpretation
Investors use gross margin ranges as a fast gut check on scalability and unit economics.
- Below 70% usually points to hidden services, support load, or infrastructure drag
- 70%–75% is acceptable
- 75%–80% is strong
- 80%+ is elite
But the number by itself doesn’t tell the whole story. Investors care a lot about margin trajectory. If margins stay flat or start slipping while revenue grows, that suggests the cost base isn’t scaling well. In many cases, that is a bigger issue than simply sitting at 68% today.
Margin Improvement Levers
The cleaner the delivery model, the closer margins tend to move toward the 80% range. In practice, the fastest path from 60%–70% toward 75%–80%+ usually comes down to infrastructure, support, and cost classification.
On infrastructure, small changes can add up fast. Right-sizing instances, using reserved or savings plans, and cutting over-provisioned capacity can reduce COGS by 5–10 percentage points when cloud spend is managed with discipline.
Support is another big lever. Moving lower-ACV accounts to self-serve channels, like knowledge bases, in-app guidance, and tiered SLAs, can lower support cost per customer and help margins move up. A monthly COGS review also helps keep expenses classified the right way and margin reporting clean.
If implementation or services start to become a material part of delivery, the benchmark moves lower.
3. Vertical SaaS With a Services Component
This is the main exception to the pure-play SaaS benchmark above. Vertical SaaS businesses that include implementation and ongoing support usually land at 55%–75% blended gross margin, which is lower than pure-play subscription SaaS at 70%–85%+.
The reason is pretty simple: the software can still be very high margin, but the service work pulls the total down. In many cases, the software layer can still reach 75%–80%+ gross margin, while professional services often sit closer to 30%–40% gross margin. That gap matters. Even a small services mix can trim total company gross margin by 3–7 percentage points.
Gross Margin Range
Margins tend to get better as implementation work becomes more repeatable and less hands-on.
By the time a company reaches $1M–$5M ARR, top operators often move into the 55%–70% range. After crossing $5M–$10M+ ARR, investors usually want to see 65%–70%+.
| ARR Stage | Typical Gross Margin Range |
|---|---|
| $0–$1M | 45%–60% |
| $1M–$5M | 55%–70% |
| $5M–$10M+ | 65%–70%+ |
COGS Profile
The COGS setup here is more layered than in pure software.
The biggest cost drivers are usually implementation labor, onboarding specialists, customer success staff tied to service delivery, and integration engineers. These people help customers get live and start using the product, so their costs belong in COGS, not OpEx.
Other COGS items can include third-party integrations, compliance work, and managed operations done for clients. The accounting point matters more than it may seem at first glance: if implementation and service-delivery headcount gets moved into OpEx, gross margin looks better on paper than it actually is. That can become a problem during diligence.
Investor Interpretation
From an investor's point of view, the key issue is whether services help the software sale or are the business.
Lower margins are usually fine when services support software adoption. They become a problem when services start to drive the model. In this category, 60%–70% is widely accepted as healthy for SaaS with a services component. Investors also often want to see software make up 70%+ of total revenue, with services staying in a secondary role.
If margins stay below 60% as the company grows, and there’s no clear path up, investors may start to view the company more like a tech-enabled services business than a SaaS company. That usually leads to lower valuation multiples.
There are exceptions. Strong net dollar retention - often 110%–130%+ - and high ACVs can help offset margin concerns. But that only works if the company can show a believable plan to improve margins over time.
Margin Improvement Levers
The main goal is to reduce service intensity without slowing adoption.
That usually means standardizing implementations, turning repeat service work into product features, and automating manual steps. Think workflow builders, self-service data import tools, or industry-specific templates customers can use on their own.
The payoff can be big. Cutting implementation costs from 35% to 18% of contract value can improve gross margins by more than 15 percentage points. And even a 30%–40% cut in average implementation hours per customer - often possible with standardized onboarding packages - can move margins from the low 60s into the high 60s or more.
A practical way to do this is to start with low-risk accounts, track the margin impact, and then roll the changes out more broadly.
4. Marketplace and API/Usage-Based SaaS
When revenue comes from usage or transactions, lower gross margins are normal. Marketplace and API-driven SaaS models almost always sit below pure subscription SaaS on gross margin, and that isn't a red flag by itself. More of the revenue gets eaten up by variable costs like payment processing, fraud handling, and cloud compute, so margins tend to move with usage and transaction volume.
Gross Margin Range
Early-stage marketplace and API companies with less than $1M ARR often land in the 30%–50% gross margin range. As they move into the $1M–$10M ARR band, top operators can push that up to 60%–70% by cutting payment fees, improving fraud models, and tightening infrastructure spend. Once a company is above $10M ARR, investors usually want to see a clear path to 65%–75% gross margins - or a solid reason those margins can't move much higher.
| ARR Stage | Typical Gross Margin Range |
|---|---|
| $0–$1M | 30%–50% |
| $1M–$10M | 50%–65% |
| $10M+ | 65%–75% (target) |
Usage-based B2B SaaS often comes in around a 62% median gross margin. AI products are a different story. If they rely on third-party model costs, margins can drop to 25%–60% depending on inference spend.
COGS Profile
COGS is much more variable here than in pure subscription SaaS. The main cost drivers are:
- Payment processing fees, often about 2.5%–3% of GMV, and sometimes 3%–5%+ in card-heavy models
- Fraud losses and chargebacks, which can run 0.5%–3% of GMV in consumer-facing or cross-border setups
- Cloud infrastructure tied straight to API calls or transaction volume
For marketplace businesses, gross margin should be calculated on net take-rate revenue, not GMV. That point matters a lot. If you use GMV, the margin picture gets distorted fast.
Third-party data costs like KYC/AML checks and credit scoring APIs should sit in COGS when they scale with usage. The same goes for transaction-linked customer support. If payment, fraud, or KYC costs get pushed into OpEx instead, margins look better on paper than they are, and that tends to fall apart in diligence.
Investor Interpretation
Investors know these models cost more to run for each dollar of revenue, so they don't judge them by pure subscription SaaS standards. What they want to see is margin improvement over time. A business moving from 45%–50% gross margin toward 60%–70% as it scales tells a much better story than one stuck in the 30%–45% range.
A bad signal is flat or falling margins even after the company has gained scale. Another one is when margin gains come mostly from one-time vendor renegotiations instead of better unit economics. Founders usually earn more trust when they break out GMV, net revenue, and each COGS line as a share of net revenue. That makes the real issue easier to judge: is the margin gap built into the model, or can the company fix it?
Margin Improvement Levers
The biggest levers usually fall into three buckets: payment economics, fraud reduction, and infrastructure efficiency.
On payments, that means lowering processing fees, improving card mix, and looking at direct acquiring relationships. On fraud, it means better ML-based risk models, stronger KYC, and tighter dispute resolution. On infrastructure, simple moves can add up: reserved cloud instances, smarter caching, and better autoscaling can cut infrastructure COGS by 10%–30% per unit of usage over 12–18 months.
A practical way to tackle this is to start with infrastructure fixes and fraud controls first, while payment-term talks run in parallel. Payment negotiations can drag on for a few quarters, so they usually aren't the first lever that shows up in the numbers. The smart move is to quantify each lever and map out a 12–24 month margin plan. That's the path investors will measure against the company's model mix.
How Founders and Investors Read Gross Margin Numbers
Once you have the stage and business model benchmarks, the next step is simple: how do investors read the number during diligence?
They use gross margin as a quick test for three things:
- Scalability
- Cost control
- Fit between the business model and the economics
And they do it in context, not by looking at the number on its own.
| Gross Margin Band | Investor Reaction | Common Follow-Up Questions |
|---|---|---|
| Below 60% | Red flag; often signals structural cost issues or misclassified COGS | Is this a services-heavy business? Are COGS classified correctly? What's the path to 70%+? |
| 60%–70% | Model-dependent; acceptable with a credible improvement story | Is margin trending up? Is this vertical SaaS with embedded services? How does it compare to peers? |
| 70%–80% | Strong; suggests a scalable delivery model with room for operating leverage | Is margin stable or expanding as ARR grows? What's driving infrastructure efficiency? |
| 80%+ | Best-in-class, if COGS is classified correctly | Are support and implementation costs fully in COGS? Is this margin sustainable across cohorts? |
The table is the short version. What investors are testing runs a bit deeper.
Below 60% tends to trigger hard questions. At that level, investors want to know whether the margin reflects a built-in limit of the business or whether costs are sitting in OpEx when they should be in COGS. A low number can be fine in the right model, but it has to make sense.
The 60%–70% range depends a lot on the company type. Investors can live with it if there’s a believable path upward. For example, a vertical SaaS company with onboarding work or service-heavy delivery may land here early on. The key issue is whether the margin is improving.
At 70%–80% - where the median for public SaaS companies sits - investors usually see signs of a repeatable subscription engine and room for operating leverage. This is often the zone where the model starts to look clean and scalable.
Once a company gets to 80%+, the conversation changes. Investors don’t just nod and move on. They start checking the math more closely. Support, onboarding, and third-party tooling all need to be in the right place, and investors will test whether those costs are fully included in COGS.
One point matters more than many founders expect: direction.
A company moving from 58% to 66% can look better than one stuck at 72%. Why? Because investors care about momentum. A rising margin can signal pricing power, tighter delivery, better infrastructure use, or cleaner cost accounting. A flat number, even if higher, may suggest the business has stopped improving.
Lucid Financials helps startups keep gross margin reporting clean and investor-ready.
The tradeoff between margin level and model type is where the next analysis starts.
Pros and Cons of Each Benchmark Profile
Here’s the right way to read the benchmark ranges above: don’t look at gross margin by itself. Investors stack it against the revenue engine behind the business. A strong margin in one setup can look average in another, so the benchmark only means something when you pair it with the right operating metric.
| Profile | Main Strength | Main Drawback | Key Investor Metric | Margin Risk |
|---|---|---|---|---|
| Pure-Play Subscription SaaS | Predictable recurring revenue | Limited revenue diversification | MRR, CAC vs. LTV | Infrastructure and support cost creep |
| Vertical SaaS with Services | Recurring software plus lower-margin services | Services mix compresses blended margin | Revenue per Employee | Services growth outpacing software growth |
| Marketplace / Usage-Based SaaS | Transaction volume drives revenue and margin | Variable costs scale with every dollar of revenue | GMV, Gross Bookings, AOV | Payment, fraud, and infrastructure costs |
So the next move is simple: pick the benchmark that fits your model, not the one with the highest headline margin.
Conclusion
The comparison that matters isn't gross margin by itself. It’s gross margin in the context of your SaaS model and stage.
That means you should benchmark against businesses that look like yours, not against a random SaaS average. Then look at gross margin next to the rest of the operating model, because one number on its own never tells the whole story.
Track gross margin trends alongside churn, CAC payback, and the Magic Number. The aim isn't to show the highest margin on paper. The aim is to build a margin profile that fits the business and gets better as the company scales.
Clean books and timely reporting make that story easier to explain to investors. Lucid Financials helps startups keep that picture clear before fundraising or major scale decisions.
FAQs
How should I classify SaaS COGS correctly?
Include only direct costs tied to delivering your SaaS service. That usually means hosting fees, core third-party API costs, payment processing fees, and the salaries of customer support or customer success teams that handle retention and troubleshooting.
Leave out Sales and Marketing, Research and Development, and G&A expenses. If you mix those into the math, your gross margin figure won’t be accurate.
What gross margin trend do investors want to see?
Investors look for strong, steady, or improving gross margins because they point to a SaaS business model that can scale without losing steam. In most cases, they expect gross margins to land in the 70% to 85% range.
If margins fall below that range, investors usually want to see a clear, data-backed plan for how those numbers will get better over time.
How can a SaaS startup improve gross margin fast?
Improve gross margin fast by doing one of two things: cut COGS or grow revenue without increasing variable delivery costs.
Use this formula each month:
(Revenue - COGS) / Revenue
Keep the math clean. Do not include Sales & Marketing, R&D, or G&A in COGS.
For SaaS companies, COGS often covers costs tied directly to delivering the product, such as:
- Cloud hosting
- Third-party APIs
- Payment processing
- Customer support labor
That gives you a clear place to look first. Trim usage where you can, renegotiate vendor deals, and be careful with pricing so you don’t add volume that hurts margin. It also helps to track gross margin by customer segment. That’s often where the fastest wins show up.