If I want better investor behavior predictions, I should spend more time on features than on fancy models. In this piece, the big takeaway is simple: use past-only signals like response delays, follow-on history, runway flags, market stress, and sentiment trends to estimate who may invest, who may stall, and when I should change my fundraising plan.
Here’s the short version:
- Raw data is weak on its own. Timestamps, emails, cap table entries, and bank records need to be turned into signals a model can use.
- The best signals usually fall into 3 groups: market/timing, communication, and investor history.
- Time handling matters. If I don’t shift data before rolling windows, I leak future information and get bad model results.
- A few strong examples: days since last investor touch, 7-day vs. 90-day reply-time change, follow-on ratio, sector concentration, and runway below 12 months.
- Data prep matters. Log transforms, z-scores, winsorization, and feature pruning help keep noisy startup data under control.
- Model testing should focus on future performance. I’d look at AUC, PR AUC, and Brier score with rolling time splits.
- The output should change decisions. If follow-on odds drop from 65% to 30%, I should not plan as if an inside round is likely.
A few numbers from the article stand out:
- Use 3-, 6-, and 12-month windows for startup financials
- Use 90- and 180-day windows for thinner investor interaction data
- Track event windows around key dates like ±7, ±30, and ±90 days
- A startup with $3,000,000 in cash and $250,000/month burn has hiring risk tied directly to funding odds
- Monthly closes done in 5–7 business days support cleaner predictions and better fundraising prep
If I had to boil the article down to one line, it would be this: clean data + well-built time-aware features usually beat model complexity.
The rest of the article explains how to build those features, test them, and connect them to runway, hiring, and fundraising timing.
How to Boost Your Stock Returns with Powerful Feature Engineering
sbb-itb-17e8ec9
The Core Feature Sets That Drive Investor Behavior Models
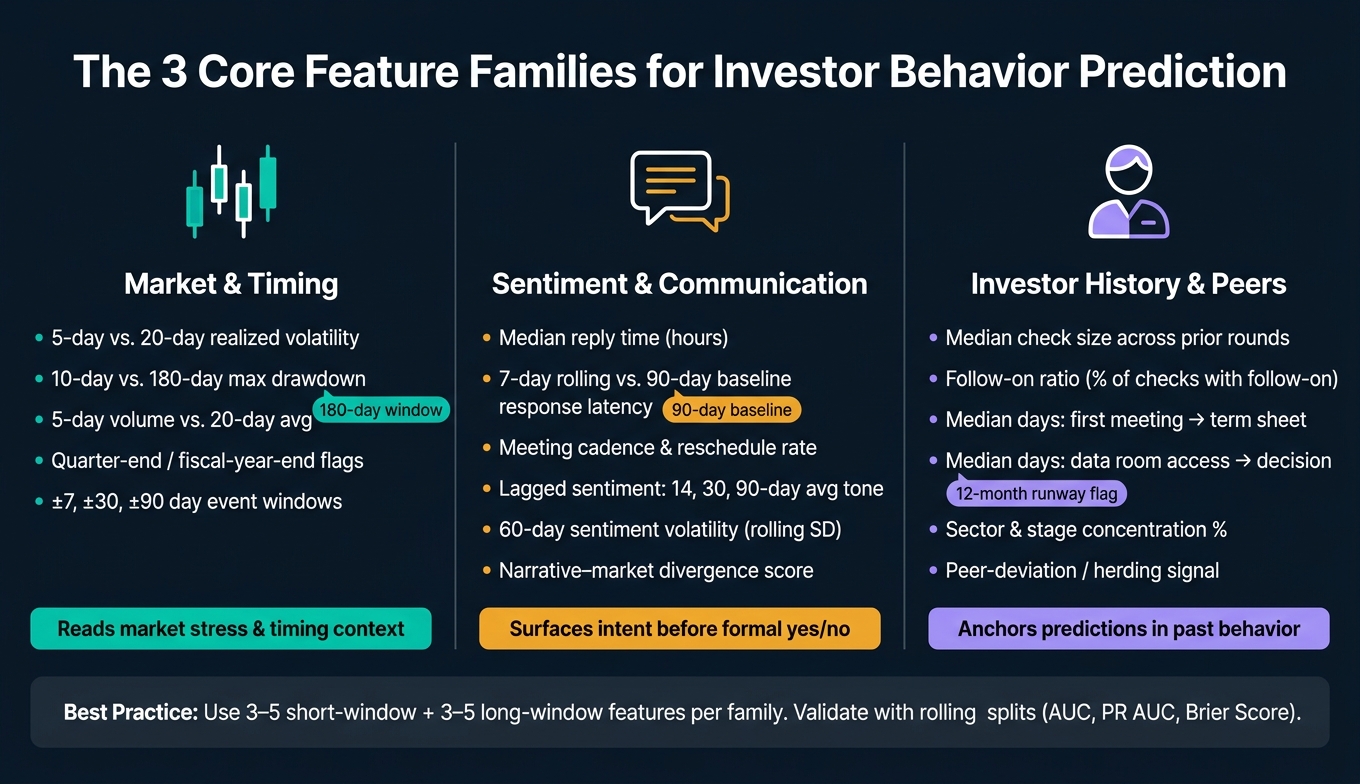
Feature Engineering for Investor Behavior: 3 Core Signal Groups Compared
These signals fall into three feature families: market and timing, communication, and investor history. Each one helps with a different kind of prediction. One explains market context, another points to communication intent, and the last estimates investor-specific likelihood.
Market, Portfolio, and Timing Features
Market and timing features add context. They help your model read whether the market feels supportive or stressed when an investor is making a call.
The most useful market features usually come in pairs: a short-window version and a long-window version of the same metric. A 5-day realized volatility number picks up a recent shock. A 20-day realized volatility number points to a longer regime shift. Short-window features react faster and can catch moments when one bad week in SaaS valuations makes an investor hesitate or cut check size. Long-window features help the model spot drawn-out bear periods in your sector.
It also helps to track drawdown features. A 10-day maximum drawdown can signal near-term stress that slows a term sheet. A 180-day maximum drawdown shows whether investors have been sitting on losses long enough to get more cautious. Liquidity proxies matter too. Examples include 5-day trading volume versus the 20-day average, or deal count in comparable private rounds over the last 30 days. These can help you time outreach when capital is actually moving.
Calendar and event features finish this set. Binary flags for end-of-quarter, end-of-fiscal-year, or the days before a major macro event like a Fed meeting often line up with repeat patterns in investor behavior data. The key is to encode exact event timing, not just rough calendar buckets. That gives your model a shot at detecting whether an investor is more likely to speed up, delay, or go quiet around a given date.
| Feature type | Short-window example | Long-window example | Sensitivity to recent shocks | Stability over time | Typical startup use case |
|---|---|---|---|---|---|
| Returns | 5-day sector ETF return | 60-day benchmark index return | High | Medium | Adjust messaging during volatile fundraising weeks |
| Volatility | 5-day realized volatility | 20-day realized volatility | Very high | Higher | Model probability of delays in term sheet signing |
| Drawdown | 10-day max drawdown | 180-day max drawdown | High | High | Flag stressed investors likely to reduce check size |
| Liquidity/volume | 5-day volume vs. 20-day avg | 90-day avg deal count in sector | Medium | Medium–high | Time outreach when sector liquidity improves |
| Calendar/cyclical | Week-before-quarter-end flag | Seasonality across quarter ends | Low–medium | High | Avoid closing attempts in historically slow periods |
A good starting point is 3–5 short-window and 3–5 long-window features that match your sector and stage. Add more only after you confirm they help prediction. On their own, these signals tell part of the story. They become much more useful when paired with who the investor is and how that investor tends to act.
Sentiment and Communication Features
Communication data can be high-signal, but it's messy. Start with the metadata.
Response latency is one of the best features you can build. Track each investor's median reply time in hours. Then calculate a 7-day rolling average and compare it with that investor's 90-day baseline. When response time jumps, it often points to weaker intent or slower commitment. Meeting cadence works the same way. Time from first meeting to partner meeting, reschedule rate, and meetings per month per investor all carry predictive weight.
For update engagement, track open rates and reply rates. Investors who open fast and reply with specific questions about growth milestones are more likely to join follow-on rounds.
Three derived metrics often beat raw sentiment scores in models. Lagged sentiment - the average tone of investor replies over the prior 14, 30, and 90 days - tracks built-up impressions instead of overreacting to the latest message. Sentiment volatility, measured as the rolling standard deviation of scores over 60 days, can flag investors with uneven conviction. In practice, that often shows up as uncertainty around check size or timing. Then there's narrative–market divergence - the gap between how positively investors talk about your company and how the sector is being discussed in news and reports. That gap can reveal early signs of fading confidence before any direct rejection shows up. Positive divergence, where your investors stay bullish while the sector cools, is a strong sign of follow-on participation.
Use headers, timestamps, and aggregated NLP scores. Do not store raw message content.
These features often surface intent before it becomes a formal yes or no.
Investor-Level Behavior and Peer-Relative Features
Investor-level features describe each investor's past patterns. In plain English, they show how someone has acted across earlier deals, not just how they're acting with you today.
Start with median check size across prior rounds, follow-on ratio, and decision speed. Median check size gives you a realistic upper bound for that investor's commitment. Follow-on ratio - the share of initial checks that got at least one follow-on from the same investor - helps separate long-term partners from one-off participants. Add median days from first meeting to term sheet, plus median days from data room access to final decision, and you get a practical planning tool. It helps answer a simple but urgent question: who can move fast if runway is tight, and who will take months no matter how strong the numbers look?
Sector and stage concentration matters as well. An investor with 60% of their portfolio in B2B SaaS at the Series A stage is structurally more likely to engage with your deal than someone making an occasional bet outside their core thesis. You can calculate a simple concentration metric - the share of prior deals in your sector and stage - using public data from Crunchbase or PitchBook plus your internal records.
Peer-relative features help you measure herding. Research shows that volume turnover, information asymmetry, and return volatility are positively and significantly associated with herding intensity among institutional investors. It helps to track whether an investor tends to move after top-tier funds in your sector. That peer-deviation feature can add signal.
Handle all profile and account data with care. Stick to behavioral and portfolio-based signals. Avoid modeling with sensitive personal attributes, and store only aggregated outputs - not raw communications - when building features from investor interactions.
Past behavior is often the strongest anchor for future participation.
How to Build Features That Are Usable, Stable, and Model-Ready
Once you know which signals matter, the next step is to build them so the model sees only past information.
Rolling Windows, Lags, and Event-Based Features
Every feature should come from data that existed before the prediction date.
For startup financials, use 3-, 6-, and 12-month windows. For investor interactions, use longer windows like 90 and 180 days because those records are usually thinner and less frequent.
One rule matters a lot here: shift before rolling. In practice, calculate .shift(1).rolling(k) so each window includes only prior data relative to the prediction date. If you roll on the unshifted series, you leak future information into the feature set. That's look-ahead bias, and it can make a model look better than it is.
Event-based features add a second layer of timing. Set windows of ±7, ±30, and ±90 days around board meetings, product launches, fundraising announcements, and month-end close dates. Then measure how your investor metrics move inside those windows. When runway drops below 12 months or burn climbs above plan, investor response rates and question volume often shift fast. Encode those moves as binary flags or count features tied to the event dates.
Scaling, Outlier Handling, and Feature Selection
Check sizes, round amounts, and one-time spend spikes are often heavily right-skewed. Investor activity counts can also vary a lot from one company to another. So before any model touches the data, use one consistent scaling approach.
Log transforms are a good fit for check sizes, round sizes, and spend spikes. In plain English, they help when percentage differences matter more than raw dollar gaps. If zeros are possible, use log(1 + x). Z-score standardization works well for most continuous features with mild skew. Winsorization caps values at the 1st and 99th percentiles, which helps control rare extremes without throwing those records away.
| Method | Robustness to Outliers | Interpretability | When to Use |
|---|---|---|---|
| Standardization | Moderate | High (units in SDs from mean) | Most continuous features, mild skew |
| Log Transform | High for right skew | Moderate (log-scale) | Check sizes, round sizes, spend spikes |
| Winsorization | High for extremes | High (original scale preserved) | Features with rare but impactful outliers |
For feature selection, start simple. Use correlation analysis to remove near-duplicate variables fast. Then train a gradient boosting model to rank the strongest predictors. After that, run a LASSO-logistic regression on the shorter list to build a sparse, interpretable investor participation score. Once you've trimmed the set, combine the remaining features into one row per investor and period.
| Method | Strengths | Limitations | Typical Use Case |
|---|---|---|---|
| Correlation-based | Simple, fast, easy to interpret | Mostly linear, ignores interactions | Initial pruning of redundant features |
| Tree-based | Captures non-linearities, interactions | Importance can be biased | Understanding complex behavior drivers |
| Regularization-based | Yields sparse, interpretable models | Assumes specific model form | Compact investor participation scoring |
Combining Financial, Behavioral, and Text Signals
After cleaning and selecting features, line them up on the same investor-period key.
Models that combine accounting, behavioral, and text features often improve prediction. The cleanest setup is one row per investor-period. Every feature in that row should be aggregated at the same level, with each value based only on data available through the end of that period. Text features like sentiment scores and topic flags can be averaged or summarized over the same window using NLP models on investor messages.
Each feature should connect to a plain behavioral idea. For example, more negative sentiment in investor emails after burn spikes may point to a lower chance of follow-on investment. That link keeps the feature set grounded. It also makes model output easier to explain to non-technical teams. Use MM/DD/YYYY across systems and stick to one time zone, because even small mismatches between email logs, accounting exports, and CRM records can create nasty join errors that are hard to spot.
How to Tell Whether Engineered Features Actually Improve Predictions
After you create features, the next step is simple to state but harder to do well: figure out whether those features help with future predictions, not just past fit.
A feature can look great in historical data and still fall apart when you use it in practice. That’s why the test isn’t “does the model fit?” It’s “does the model make better forward-looking calls?”
Pick Models That Fit Your Feature Set and Decision Goal
Start with the decision you’re trying to support.
If you need a yes/no call on investor participation, use a classification model. If you need timing estimates or runway planning, focus on well-calibrated probability forecasts, not just a binary output.
Logistic regression is a strong baseline for clean tabular data. It stays interpretable, and it’s easy to calibrate. Regularized versions like L1 and L2 also help stop high-dimensional datasets from overfitting.
Tree-based models make more sense when interactions and nonlinear relationships matter across mixed feature types. That often happens with things like portfolio concentration ratios, communication cadence, and sentiment scores. Sequence models are better saved for dense, time-stamped histories.
Measure Lift, Importance, and Stability
Once you’ve picked the model class, judge it on ranking, calibration, and stability. Accuracy alone doesn’t cut it.
AUC shows how well the model ranks investors by likelihood of participation. PR AUC is more useful when only a small share of investors actually commit. Accuracy can still look fine while the minority class is getting handled badly, so it helps to report ranking and calibration metrics side by side.
Brier score measures calibration. Lower is better. In plain English, that means the model’s predicted probabilities line up more closely with what happens in the market. That matters a lot for runway scenario planning.
A practical way to test lift is to compare a minimal baseline model with the full engineered feature set using rolling time splits. Then report:
- AUC
- PR AUC
- Brier score
That gives you a cleaner view of whether the added features are helping in ways that matter.
Next, use permutation importance to see which features are driving lift. Then use SHAP to explain individual predictions. Put together, those two views help confirm which engineered features are doing actual work. That keeps the conversation centered on feature quality, not just model output.
You’ll also want to revalidate the model every quarter or after each funding cycle. Watch for material shifts in feature importance rankings. If those rankings swing a lot, a feature may be picking up a short-lived pattern instead of durable behavior.
It also helps to annotate performance charts with macro events, such as Fed rate hikes beginning in March 2022. That gives boards more context for changes in model metrics and makes it easier to judge whether the feature set is still holding up after deployment drift.
Applying Investor Behavior Features to Startup Financial Planning
Use Behavioral Predictions in Runway, Fundraising, and Scenario Planning
Once your features are stable, turn them into operating triggers. Investor behavior models only matter if they change how you manage cash. That means tying funding probability, response latency, and follow-on likelihood to runway, hiring, and fundraising timing.
Here’s a simple way to think about it: if your model shows a 70% probability of follow-on funding within 9–12 months, and your burn is $250,000 per month with $3,000,000 in the bank, that number should shape hiring decisions. It tells you whether adding headcount is a safe move or a gamble. One common setup is to use thresholds to approve hiring. For example, greenlight a new sales team only if the model shows at least a 60% chance of raising $5 million within 12 months.
The same logic works in reverse. If follow-on probability falls from 65% to 30% after two weak months, don’t keep acting like an inside round is likely. Shift to an outside fundraising plan 12–15 months before runway runs out. Build best-case, base-case, and downside scenarios, then refresh them every month.
Build a Reliable Data Pipeline With Investor-Ready Financials
Those predictions fall apart fast when your financial data is late or inconsistent.
The starting point is a consistent monthly close. In practice, that means closing the books within 5–7 business days after month-end, with reconciled accounts, accurate revenue recognition, and a standard chart of accounts. Startups with structured, investor-ready financials usually get through due diligence 30–50% faster than companies that have to clean things up in the middle of a round. Clear, steady monthly reporting is also tied to about twice the likelihood of raising follow-on funding compared with startups that report in a sporadic way.
Lucid Financials supports this workflow with bookkeeping, tax, tax credit, and CFO support in one platform, plus Slack-based access to clean monthly closes and real-time investor-ready reporting.
These inputs only start to help after you aggregate, lag, and scale them. Here’s how common startup inputs turn into model-ready features:
| Feature Category | Source Inputs | Engineered Features |
|---|---|---|
| Financial | Cash balance (USD), monthly burn, MRR/ARR, gross margin %, runway months | 3–6 month growth rates, burn trend, runway threshold flags (e.g., < 12 months), Rule of 40 |
| Behavioral | Investor update cadence, meeting count, response timing, warm introductions per month | Update frequency stability, average response latency, engagement score by investor type |
| Sentiment | Email/Slack text, board notes, investor feedback | Sentiment polarity over time, risk keyword ratios, tone shifts after milestones or misses |
| Market | Public comps, sector funding volumes, interest rates, volatility indexes | Sector valuation trend, funding climate index, macro risk level |
Conclusion: Prioritize Feature Quality Before Model Complexity
Investor behavior is noisy by nature. Fund dynamics, partner preferences, and macro shifts are often hard to see directly. In that kind of setup, well-engineered features built from clean, consistent data tend to beat a more complex model built on messy inputs almost every time.
Define the target, build domain-specific features, validate with time-aware backtests, and connect the outputs to hiring, fundraising, and burn decisions.
FAQs
What is feature engineering in investor behavior analysis?
Feature engineering in investor behavior analysis means choosing and shaping the signals an AI model looks at to spot patterns and predict behavior. Rather than feeding the model raw data and hoping for the best, it turns messy market information into structured metrics that can improve accuracy.
That can include sentiment scores, volatility, rates of change, bid-ask spreads, order-book depth, and volume z-scores. Put simply, these features help models tell the difference between normal day-to-day activity and more meaningful shifts, like herding or panic selling.
How do I avoid look-ahead bias in time-based features?
Use only the data that existed at the moment each observation was made. That means no future data leakage. For example, an end-of-day price should never influence a mid-day signal.
You also need strict data validation. Audit your feature engineering pipeline and check, step by step, that every feature stays inside its proper time boundary. If a value would not have been known at that point in time, it should not be in the model input.
Which investor signals matter most?
The signals that matter most to investors often show up at the edges. Sentiment scores above 0.80 or below 0.20, for example, can line up with sharper market moves and changes in fundraising conditions.
The main signals to watch include investor sentiment, engagement metrics, behavior shifts like volume spikes or unusual order flows, and financial markers such as burn rate and Net Asset Value (NAV) changes.