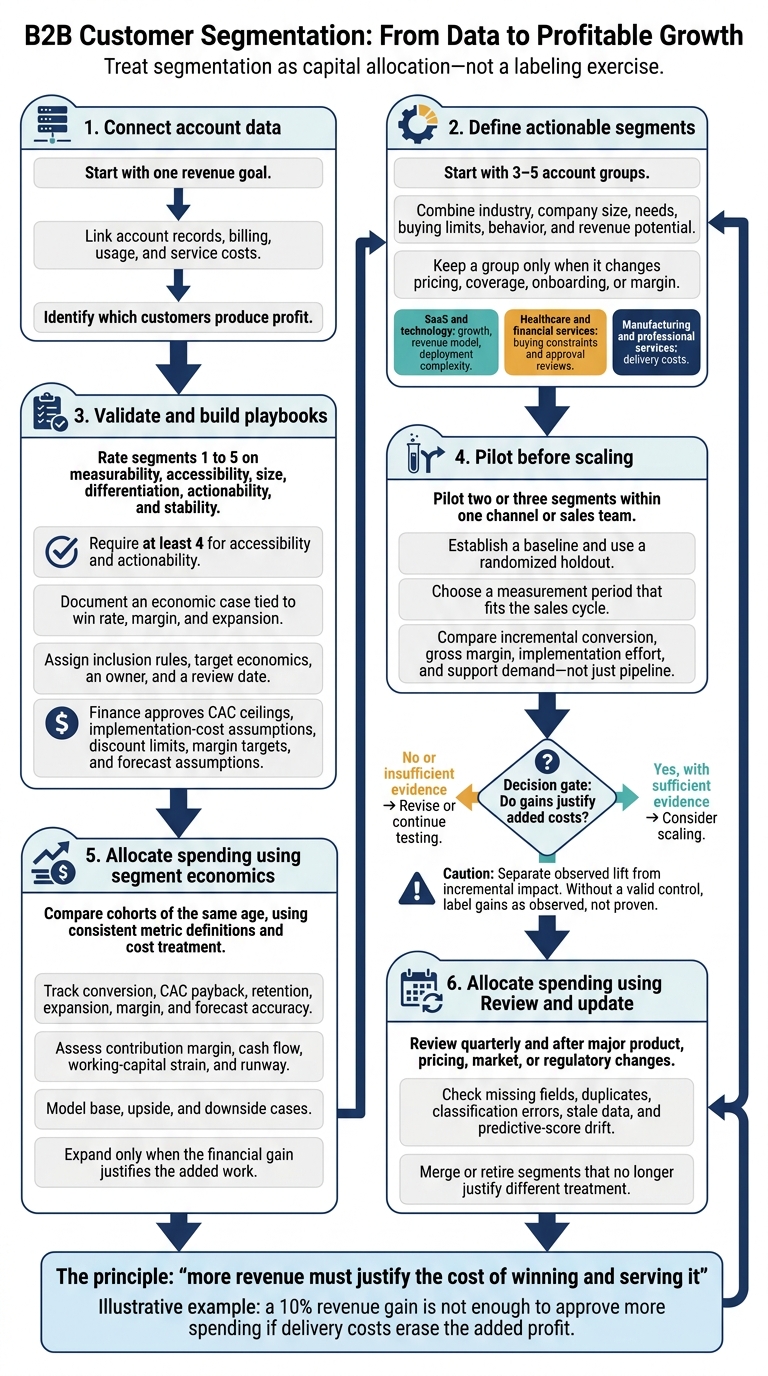
I treat B2B segmentation as a spending decision - not just a way to group customers. Start with one revenue goal and 3–5 account groups that need different pricing, sales support, or onboarding. Test 2–3 groups before committing more budget.
Here’s the approach I use:
- Connect the data: Link account records, billing, usage, and service costs to see which customers produce profit.
- Choose useful groups: Combine industry, company size, needs, buying limits, behavior, and revenue potential. Keep a group only when it changes how you serve it.
- Check industry differences: Account for deployment needs in SaaS, approval reviews in healthcare and finance, and delivery costs in manufacturing and professional services.
- Test before scaling: Set rules, assign owners, and compare pilot results with a control group. Measure conversion, retention, expansion, margin, and cash needs - not just pipeline.
- Review quarterly: Check data quality, compare customers over the same time span, and revise groups that no longer need separate treatment.
My rule: <u>more revenue must justify the cost of winning and serving it</u>. Illustrative example: a 10% revenue gain is not enough to approve more spending if delivery costs erase the added profit.
B2B Customer Segmentation: From Data to Profitable Growth
How to Segment a B2B Market
sbb-itb-17e8ec9
Build Customer Segments by Industry
Once the core model is set, turn it into industry rules for pricing, coverage, and delivery costs. Apply those rules where buying constraints or delivery costs shape revenue decisions. Track only fields that affect pricing, coverage, onboarding, or margin.
SaaS and Technology: Segment by Growth and Revenue Model
Look at funding stage alongside growth, revenue model, and deployment complexity. Funding stage alone shouldn't determine coverage. Standard deployments may work with self-service onboarding. Complex integrations and security reviews may need specialists. Use subscription metrics for subscription accounts - not for every technology business.
Healthcare and Financial Services: Segment by Buying Constraints
For healthcare and life sciences, separate accounts by organization type, clinical or administrative workflows, data sensitivity, and budget ownership. Scope privacy reviews, training, and integration work before setting prices. Each can affect approval time, onboarding costs, and service margin.
For financial services, segment by institution type, core systems, and risk exposure. Longer approval cycles and higher onboarding costs can pay off when retention and expansion support contribution margin.
Manufacturing and Professional Services: Segment by Delivery Costs
For manufacturing, protect service margin by favoring repeatable site rollouts over custom engineering at every plant.
For professional services, offer packaged onboarding to standardized firms and expert-led delivery to complex practices. Price and expand by site, user, or team only when delivery costs stay within margin limits.
The table below translates these industry patterns into segment rules and metrics to track.
| Industry | Segmentation variables | Buying dynamics | Value drivers | Sales and service approach | KPIs |
|---|---|---|---|---|---|
| SaaS and technology | Growth, ARR, revenue model, sales motion, stack, integrations, security maturity | Technical, security, executive approval | Adoption, retention, infrastructure efficiency | Seat, usage, or hybrid pricing | ARR, growth rate, average contract value, NRR, CAC payback, implementation time, gross margin, support cost; transaction volume, take rate, license bookings, or hardware margin for other models |
| Healthcare and life sciences | Providers, payers, pharmaceutical, biotechnology, medical-device manufacturers; workflow, data sensitivity, budget owner | Privacy, clinical, research, procurement reviews | Patient operations, research efficiency, quality | Domain specialists; phased deployment; EHR, claims, or laboratory integrations; site or transaction pricing | Approval time, contract value, onboarding cost, time to value, retention, expansion, service margin |
| Financial services | Banking, lending, payments, insurance, wealth management, fintech; core systems, risk, transaction scale | Vendor-risk, legal, security, audit, continuity requirements | Fraud reduction, automation, risk control, customer experience | Coordinated compliance support; platform or transaction pricing | Approval time, win rate, contract value, onboarding cost, retention, expansion, contribution margin |
| Manufacturing | Subsector, plant count, automation, geography, integrations, downtime risk | Plant leadership, engineering, IT, procurement | Throughput, quality, reduced downtime | Site pilots; plant or machine pricing | Deal size, service margin, time to value, downtime impact, deployment hours, multi-site expansion |
| Professional services | Specialization, firm size, staffing, utilization, client concentration, recurring revenue, reporting needs | Partners, practice leaders, finance, operations | Project profit, realization, scalable delivery | Project, retainer, or user pricing | Project profit and service margin - including labor, subcontractors, travel, and rework - utilization, retention, recurring revenue, revenue per employee, team expansion |
Treat these industry patterns as hypotheses to test. Check which segment boundaries predict win rate, margin, and expansion.
Validate Segments and Put Them to Work
Once you’ve defined your segments, test whether they predict revenue outcomes before rolling them out.
Test Segment Quality and Predictive Scores
Rate each segment from 1 to 5 on measurability, accessibility, size, differentiation, actionability, and stability. Require at least 4 for accessibility and actionability, along with a documented economic case tied to win rate, margin, and expansion. Compare historical win rates, retention, and support hours. Then check with customers and frontline teams to confirm that the differences warrant separate treatment.
Start with clear rules. Add purchase, renewal, churn, or expansion scores only when you have enough positive and negative history. Keep scores separate from segment labels, and use them only as inputs. Test scores on time-based or random holdouts by industry, excluding any data collected after the outcome. Document variables and thresholds, monitor drift, and require human review before scores change pricing, contracts, or service access.
Use validated scores to turn segments into operating rules.
Build Segment Playbooks
Each playbook should include inclusion rules, data sources, score thresholds, customer problems, offers, implementation needs, target economics, an owner, and a review date. Link playbooks to marketing, sales routing, pricing, contracts, onboarding, renewals, and product dependencies. Finance should approve CAC ceilings, implementation-cost assumptions, discount limits, margin targets, and forecast assumptions.
Pilot two or three segments. Keep the test within one channel or sales team, establish a baseline, and use a randomized holdout. Choose a measurement period that fits the sales cycle. Compare incremental conversion, gross margin, implementation effort, and support demand - not just pipeline. Expand only when the financial gain justifies the added work.
Once the pilot proves out, bring segment results into planning and forecasting.
Use Segment Economics in Financial Planning
Assign revenue and direct costs to accounts for planning. Document how you allocate shared costs, and keep costs you can’t trace in a shared pool. Separate accounting profit from contribution margin and cash flow, factoring in billing terms, collections, and upfront hiring.
Lucid Financials provides the financial data founders need for segment economics and runway planning. Use segment-level economics to model hiring, acquisition spending, and runway under base, upside, and downside cases.
Measure Revenue Impact and Update Segments
Once validated playbooks are live, measure whether they improve revenue and margin, not just activity.
Track Revenue and Unit Economics
Before activation, set baselines and targets for each segment. Lock in metric definitions, inclusion rules, attribution windows, and cost assumptions so comparisons stay consistent.
Track conversion, CAC payback, retention, expansion, margin, and forecast accuracy. Support these measures with qualified pipeline, win rate, ACV, CAC, activation, and LTV. Use fixed reporting windows: monthly pipeline, quarterly bookings, and 12-month retention cohorts. Include account and opportunity counts, revenue at risk, and cohort age with every metric.
Keep the formulas fixed:
- Win rate = won deals ÷ (won deals + lost deals)
- Pipeline velocity = qualified opportunities × win rate × average deal value ÷ sales-cycle days
- NRR = (starting recurring revenue − churn − contraction + expansion) ÷ starting recurring revenue
- CAC payback months = CAC ÷ monthly gross profit per acquired customer
Report gross margin and contribution dollars using the same cost-allocation method as the baseline.
Compare Cohorts and Adjust Spending
Before increasing spend, compare each segment with a baseline cohort of the same age. Compare cohorts by industry, company size, channel, and acquisition or activation period. Use the company average as a mix-adjusted benchmark.
| Segment | Measurement period | Account-fit criteria | Pipeline | Conversion | Average contract value | Retention | Margin | Expansion | Recommended action |
|---|---|---|---|---|---|---|---|---|---|
| Baseline cohort | Before activation; baseline observation window | Fixed industry, size, and channel rules | Qualified pipeline dollars | Rate and denominator | Dollars per won account | Mature cohort rate | Gross and contribution margin | Share of starting revenue | Establish comparison |
| Post-activation cohort | After activation; same cohort age | Same rules; segment playbook applied | Qualified pipeline dollars | Rate and denominator | Dollars per won account | Pending until mature | Gross and contribution margin | Share of starting revenue | Scale only with sufficient evidence |
| Company average | Same period and maturity | All qualified accounts, adjusted for mix | Qualified pipeline per eligible account | Rate and denominator | Dollars per won account | Same retention definition | Same cost treatment | Same revenue basis | Use as benchmark |
Include account counts and sample sizes beside each metric. This helps prevent small cohorts from looking more persuasive than the data supports.
Separate observed lift from incremental impact. Account for market, pricing, and capacity effects. Use a valid control when possible. If that isn't possible, match accounts on industry, size, prior pipeline, geography, contract potential, and channel.
Label gains as observed, not proven. Gains that persist across periods still don't establish causality. Increase spend only when gains hold up after delivery costs; better pipeline alone doesn't justify more capacity.
Use these results to decide whether a segment needs a new version - not just a new budget.
Review Segment Rules Quarterly
Keep version records for inclusion and exclusion rules, effective dates, owners, approvals, and CRM labels. Review them quarterly and after major product, pricing, market, or regulatory changes.
Before revising rules, check for missing fields, duplicates, classification errors, stale data, and predictive-score drift. Keep old definitions for historical reporting. Merge or retire segments that no longer justify different messaging, coverage, pricing, service, or product investment.
Conclusion: Scale Segments With Proven Results
Treat B2B segmentation as capital allocation, not a labeling exercise. Combine industry context, customer needs, buying constraints, and unit economics. Start with one revenue goal, a few segments you can act on, reliable account data, a baseline, and named owners across sales, marketing, customer success, and finance. Fund only the segments that change revenue outcomes.
Test each segment before increasing spend. Use controlled pilot results and industry-specific segment economics to assess each offer, service model, and investment cap. Require revenue, retention, and margin gains - not pipeline alone. Check concentration risk, then test cash needs and runway. Fund a segment only when returns outweigh delivery costs and working-capital strain.
FAQs
How can I segment accounts with limited data?
Start with one measurable goal, such as increasing expansion revenue or reducing churn. Then define 3 to 5 core segments based on non-revenue factors, like product behavior or customer health scores.
Use k-means clustering with 10 to 20 standardized features, such as industry, employee band, or weekly active users.
Clean your records by standardizing formats. Use the same primary key, such as company domain, across your CRM and billing systems.
How do I handle accounts that fit multiple segments?
Don’t squeeze accounts into a single label. Standardize each record with one primary account ID - a CRM account ID or domain. Then automate segment assignments using real-time signals: industry, size, intent, usage, and revenue.
Use one primary segment for routing and messaging. Keep secondary views to report outcomes across segments.
Review win rate, ACV, churn, and expansion to check whether those assignments support revenue decisions.
How many accounts do I need for a reliable pilot?
There’s no fixed number of accounts you need for a pilot. AI segmentation depends more on data accuracy and quality than volume. Start with clean, standardized records that stay consistent across systems, then use a simple model with 3 to 6 segments.
Lucid Financials helps you get started by organizing your financial data within seven days and providing reliable, investor-ready reporting to support your segmentation plan.