If you want better pipeline, higher ACV, and lower CAC, start with segmentation tied to revenue goals. I’d keep it simple: use closed-won and closed-lost data to define your ICP, clean your CRM and finance data, build a small set of account segments, and push those segments into sales, marketing, and forecast reviews.
Here’s the short version:
- Start with one goal: more qualified pipeline, better win rates, or higher ACV
- Build your ICP from deal data: look at industry, company size, region, deal size, sales cycle, and loss reasons
- Clean your data first: up to 70% of CRM data can be outdated or incomplete
- Use account-level signals: firmographic, behavior, intent, product usage, and revenue data
- Begin with simple models: for most startups, 3–6 segments is enough
- Make each segment useful: each one should change routing, messaging, spend, or customer follow-up
- Review results on a set cadence: track win rate, ACV, CAC, churn, expansion, and forecast variance in U.S. dollars
A few numbers stand out. Companies with a documented ICP can see 68% higher account win rates and 1.7x shorter sales cycles for ICP-fit accounts. And in many B2B SaaS companies, the top 20% of ICP-fit accounts drive about 42% of new ARR. That’s why I’d treat segmentation as a revenue tool, not just a reporting exercise.
At a high level, this article shows a four-step path:
- Set the goal and define the ICP
- Audit and clean the data
- Pick a simple AI method you can use now
- Put segments into daily GTM and finance work
Here’s a quick comparison of the main segmentation types:
| Segment type | Main data used | Best use |
|---|---|---|
| Firmographic | Industry, employee count, revenue, region | Routing, territory planning, ICP fit |
| Behavioral | Product usage, logins, funnel activity | Lead scoring, lifecycle tracking |
| Intent | Website visits, third-party intent, content activity | Outreach timing, pipeline focus |
| Value-based | ARR, churn, margin, expansion | Retention, upsell, budget decisions |
The main idea is simple: I’d start small, tie every segment to a clear action, and keep only the segments that move revenue metrics within one or two sales cycles.
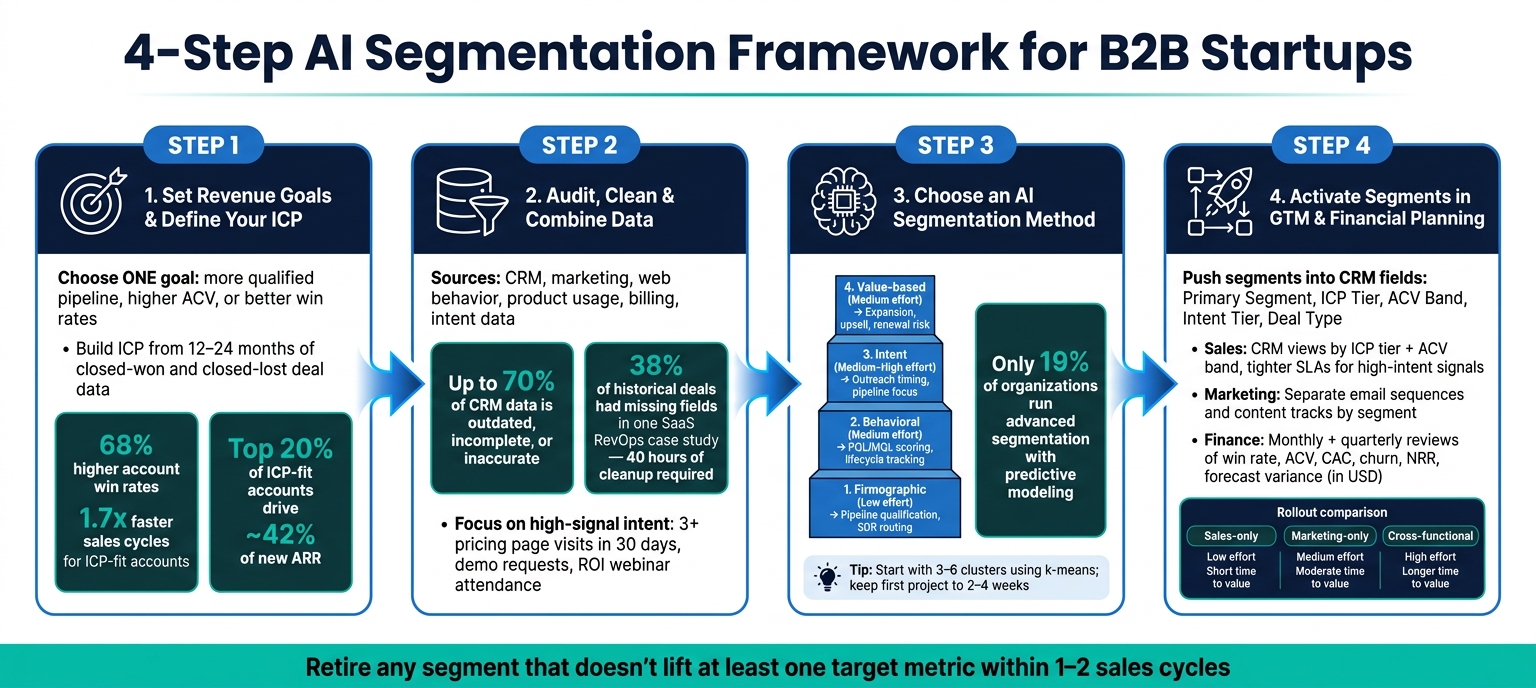
4-Step AI Segmentation Framework for B2B Startups
How to Build Customer Segments with AI (Real-World Use Case)
sbb-itb-17e8ec9
Step 1: Set Revenue Goals and Define Your Ideal Customer Profile
Start with one clear revenue target from the introduction: more qualified pipeline, higher ACV, or better win rates. That target gives the work a point. Without it, segmentation turns into a pile of broad audience groups that look fine on a slide but don't help the team make day-to-day calls.
Connect Segments to Pipeline, ACV, and Sales Efficiency
Tie that goal to one use case: outbound targeting, lead scoring, expansion, or retention. Then use that choice to decide where rep time and budget should go. Keep it tight. If you try to fix several motions at the same time, it gets hard to tell what changed the result.
Track one metric monthly or quarterly. That ICP then becomes the baseline for the data audit in Step 2.
Build an ICP From Closed-Won and Closed-Lost Data
Your CRM history is the best place to start. Pull 12 to 24 months of closed-won and closed-lost deals from your CRM, then compare the two groups. Look at:
- industry
- employee count
- region
- lead source
- sales cycle length
- deal size
- reason lost
The goal is simple: find the account traits tied to better pipeline quality, ACV, and sales efficiency. If the same traits keep showing up in won deals, those patterns should shape your ICP.
Companies with a documented ICP can see 68% higher account win rates and 1.7x faster sales cycles for ICP-fit accounts. In the median B2B SaaS company, the top 20% of ICP-fit accounts generate about 42% of new ARR. Early segmentation should spot those accounts and keep them in focus.
Once the patterns are clear, turn them into plain rules your sales and marketing teams can use every day. For example: U.S. mid-market software companies with 50–500 employees and clear adoption and expansion potential. Just as important, write down what to leave out - industries with low conversion rates, account types that drag out sales cycles, or segments where ACV doesn't justify the work. A good ICP works like a filter.
Once the ICP is defined, the next step is to check the data behind it.
Step 2: Audit, Clean, and Combine the Right Data
Once your ICP is defined, the next step is pretty direct: do you have the data to back it up? From there, map those ICP traits to the systems and fields you already use.
The main sources to look at are CRM, marketing, web behavior, product usage, billing, and intent data. Each one tells you something different about an account: who they are, how they act, what they use, and what they're worth. The problem is, these sources usually don't line up on their own. And the records inside them are often messy, patchy, or inconsistent.
Up to 70% of CRM data is outdated, incomplete, or inaccurate. That's more than enough to throw off a model. For a startup with a small deal history, even a handful of bad records can bend the output in the wrong direction.
Focus on Data That Reflects Buying Intent and Customer Value
Once the data is cleaned up, score the signals that do the best job of pointing to purchase intent.
High-signal intent features include pricing page visits, especially 3 or more within 30 days, demo requests, attendance at live webinars focused on implementation or ROI, and engagement with case studies that include ROI figures. These actions should carry the most weight. Lower-signal actions, like generic email opens or a single blog visit, should matter much less. Timing matters too. A pricing page visit from yesterday means more than one from 90 days ago.
On the customer value side, focus on ACV and ARR in USD, gross margin by account, expansion history over the past 12–24 months, and churn indicators such as contract term left at cancellation. For SaaS products, early product usage signals can be a strong clue too. Hitting free-tier limits, fast feature adoption, and rising API usage often point to upgrade-ready accounts before sales ever gets involved.
Pull these signals together at the account level, not just the contact level. If three people from the same company hit your pricing page in the same week, that's a lot more telling than one person showing up once.
Fix Data Quality Gaps Before Modeling
The most common startup data issues are duplicate records, uneven industry and employee-count fields, and account IDs that don't match across systems. One SaaS RevOps team found that 38% of its historical deals had missing fields - budget, close date, or loss reason - and spent 40 hours cleaning data before connecting an AI tool. That's not rare. It's the kind of cleanup work many teams run into.
A simple way to handle the gaps:
- Profile each system by exporting 12–24 months of data and checking duplicate rates and missing values
- Standardize industry fields with a controlled list, and map employee count into set bands
- Map every system to one primary key, usually a CRM account ID or company domain
- Label missing values as "Unknown" instead of filling them with the most common value, which can skew the model
Add Financial Data to Make Segments More Useful
Behavioral signals tell you who's interested. Financial data tells you who matters most to the business.
Segment-level revenue, gross margin, churn rates, and expansion history turn segmentation into a GTM priority tool. That also ties the work back to the main goal here: optimizing revenue, not just sorting accounts into tidy buckets.
For many early-stage startups, this is where things get messy. Financial data often lives across invoices, spreadsheets, and accounting tools that don't connect cleanly to the CRM. If revenue data isn't rolled up at the account or segment level, it's tough to spot which groups are driving profitable growth.
Centralize accounting data so you can measure segment performance by revenue, margin, churn, and expansion.
Step 3: Choose an AI Segmentation Method You Can Actually Use
Pick the simplest segmentation method that helps you make the decision in front of you: routing, retention, or expansion. The point isn’t to create neat labels. The point is to make better routing, scoring, and budget calls.
A startup assigning accounts to SDRs needs one kind of segmentation. A team trying to protect renewals or spot expansion needs another. Your method should help lift pipeline quality, ACV, win rate, or renewal risk, not just sort accounts into tidy buckets.
Only 19% of organizations run advanced segmentation with predictive modeling. So start with the method your data and team can support right now. Then add more layers once those first segments are changing GTM actions.
Start With Firmographic, Behavioral, Intent, or Value-Based Segments
Use the lightest method that can lead to an action your team can take this month.
| Method | Data Required | Setup Effort | Strengths | Limits | Revenue Outcome |
|---|---|---|---|---|---|
| Firmographic | Industry, company size, revenue ($), HQ state or region, funding stage | Low | Simple, stable, easy to align to ICP and territory planning | Misses behavior and timing; segments can be too broad | Pipeline qualification, SDR routing, basic ABM |
| Behavioral | Product events, logins, feature usage, funnel stages in CRM | Medium | Shows engagement and lifecycle stage | Needs solid tracking; can get noisy | PQL/MQL scoring, payback tracking, CS playbooks |
| Intent | Website analytics, third-party intent (G2, Bombora), content consumption | Medium–High | Spots accounts that are actively evaluating and signals buying readiness | Relies on external tools; coverage gaps | Timing outreach, prioritizing active pipeline |
| Value-based | Revenue (MRR/ARR), expansion $, churn, margins from accounting/BI tools | Medium | Keeps attention on ROI, helps with pricing and retention | Needs clean finance data; may trail live buying signals | Expansion/upsell focus, renewal risk, customer-success prioritization |
A simple path works well for most teams:
- Start with firmographic
- Add behavioral when tracking is steady
- Layer in intent when third-party tools are connected
- Move to value-based once segment-level ARR and margin data flow cleanly into your CRM or BI tool
Lucid Financials can push clean revenue and margin data into your BI or CRM for segment-level reporting.
Use Simple AI Models First and Keep Segments Actionable
At the startup stage, the main limits are pretty plain: not much data, not much bandwidth, and a need for GTM actions that can happen now.
For unlabeled data, k-means clustering is a good place to start. Feed it 10–20 standardized features per account, such as industry, employee band, weekly active users, intent score, and current ARR. Then aim for 3–6 clusters. That gives you enough separation to act on without turning the output into a mess.
Hierarchical clustering helps when you want to see how segments group together and decide on the cluster count using a cluster tree plus business judgment.
Once your CRM and finance data include steady labels like closed-won, churned, or expanded, move to supervised scoring. Models like logistic regression or gradient boosting can output a 0–100 probability score that sales can use right away.
A segment only matters if it clears three bars:
- It has enough accounts to justify a dedicated play
- The groups show clear differences in value or behavior
- Each segment has an obvious GTM action tied to it, like routing, messaging, or pricing treatment
If you can’t write a different message for a segment or assign it a clear owner, it’s too vague to help.
Keep the first project tight: 2–4 weeks. Pull in sales and marketing to name the clusters and sanity-check them. Then write one action for each segment so sales, marketing, and finance can use it in Step 4.
Once the first segments hold up, plug them into daily workflows and forecast reviews.
Step 4: Put Segments Into Sales, Marketing, and Financial Planning
This is the point where segments stop living in a spreadsheet and start shaping daily work. The goal is simple: put stable segments inside the CRM, dashboards, and team workflows people already use every day.
Add required Account and Opportunity fields like Primary Segment, ICP Tier, ACV Band, Intent Tier, and Deal Type. Then automate updates using firmographic, behavioral, and intent signals.
Activate Segments in Daily GTM Workflows
Segments should change what teams do, not just what they look at in reports.
In sales, use segment labels to shift prioritization and response times. Create CRM views filtered by ICP tier and ACV band so top accounts show up first. Then set tighter SLAs for high-intent signals, like repeated pricing page visits or demo requests.
For marketing, send prospects into different email sequences, content tracks, and campaign plays based on segment. A mid-market buyer usually needs a different level of proof and detail than an enterprise buyer.
For customer success, connect health scores and playbooks to segment membership. High-expansion accounts can get proactive outreach and upsell motions. At-risk accounts can get scaled digital check-ins instead.
Use Segment Reporting to Guide Forecasts and Budget Allocation
Once those workflows are live, use segment reporting to compare how each account type performs. Review these metrics by segment every month and quarter: pipeline value and coverage, win rate, ACV, sales cycle length, churn, expansion revenue, net revenue retention (NRR), and CAC payback by segment.
Each metric should lead to a decision. That might mean changing routing, shifting spend, adding headcount, or leaning harder into expansion.
Lucid Financials can connect segment-level reporting to the books for cleaner forecast inputs.
The table below shows three common rollout paths:
| Rollout Type | Effort | Expected Impact | Data Needs | Time to Value |
|---|---|---|---|---|
| Sales-only | Low | Faster prioritization, better meeting rates, improved pipeline quality | CRM segment fields, ICP tier, ACV band | Short |
| Marketing-only | Medium | Higher lead quality, better conversion to sales-qualified opportunities | Behavioral tracking, audience fields, campaign tagging | Moderate |
| Cross-functional | High | Aligned revenue generation and financial planning across all teams | CRM + MAP + product usage + finance data connected | Longer |
Use the table to pick the rollout that fits your current data setup and team bandwidth. Review the metrics on a fixed cadence, and keep the segments that improve pipeline, ACV, and retention.
Conclusion: Measure Results, Update Segments, and Scale What Works
Once segments are live in GTM and finance, the focus shifts to measurement. AI-driven segmentation only matters if it changes the numbers that matter: win rate, ACV, CAC, retention, and forecast accuracy. Track those metrics in USD so comparisons stay consistent. The loop is straightforward: define, activate, review.
The benchmark is just as clear. Segment-level reporting should improve the metrics that matter. If a segment does not lift at least one target metric within one or two sales cycles, tighten it up or retire it.
Review Segment Performance on a Set Cadence
Use a fixed review cadence to keep segments tied to revenue results. Seed-to-Series B startups should review segments every month. Sales should look at pipeline created, win rate, and sales cycle length by segment. Marketing should own MQL-to-SQL volume, cost per opportunity, and segment-level conversion. Finance should run a quarterly deeper review of recognized revenue, gross margin, churn, expansion, and forecast variance by segment, all in USD.
It also helps to watch for drift. If the model no longer lines up with current buying patterns, or stale segments start to show up, refine the definitions instead of rebuilding the whole system. In many cases, that means splitting one broad segment into two narrower ones.
As ARR grows, segment definitions should get tighter. Broad groupings often give way to narrower tiers built around ACV bands, use case clusters, and buying committee complexity. Lucid Financials can keep segment-level revenue, CAC, and retention figures aligned with GAAP-compliant financial statements as those definitions change, so board reporting stays clean and consistent. Treat segment definitions as living inputs to strategy, not fixed labels. Document every change and track how it affects historical comparisons.
FAQs
How much data do I need to start AI segmentation?
You don’t need a massive dataset to get started with AI segmentation. What matters most is clean, accurate data based on what customers actually do.
A good starting point is to focus on just one data category, such as:
- Website activity
- Purchase trends
- Engagement metrics
From there, build a solid base by cleaning and standardizing your records, using consistent customer IDs, and keeping your segmentation simple at first. In most cases, 3 to 5 core segments is a smart target.
It also helps to refresh your data every month so your insights stay current and useful.
What should I do if my CRM data is messy?
Start with a thorough audit to spot duplicates, missing values, stale records, and bias. Then standardize your formats and use one consistent ID across your CRM, billing, and support systems.
From there, set up automated validation and cleaning so bad data doesn’t keep slipping through. Check your data pipelines on a regular basis, and refresh segments at least once a month.
For financial or transactional data, DBSCAN can help flag noisy or outlier records for manual review.
How do I know if my segments are improving revenue?
Track the metrics that connect straight to growth, like customer lifetime value, conversion rates, and return on marketing investment.
Then watch segment performance over time. That shows you which groups bring in the most revenue per customer, stick around longer, and move through the sales cycle the fastest.
Lucid Financials can track these indicators and expansion ARR in real time, so you can keep your attention on the segments that drive the most profit.