When presenting financial data to your board, the goal is clarity and relevance. Overloaded spreadsheets and dense reports can obscure critical insights, making it harder for directors to focus on what matters. Customized financial reports solve this by highlighting key metrics like cash management, goal progress, and risks requiring immediate attention.
Key takeaways:
- Board packs average 226 pages, but directors spend only 4 hours reviewing them.
- Tailored reports link financial data to strategic goals, improving decision-making.
- Companies using structured variance analysis see 27% better resource allocation and 34% improved cost management.
- Reports should focus on 6–8 core metrics to avoid overwhelming the board.
Steps to create better reports:
- Consolidate financial data into key statements: Balance Sheet, Income Statement, and Cash Flow Statement.
- Include cash runway projections and Budget vs. Actuals (BvA) analysis.
- Select metrics that fit your company's growth stage (e.g., ARR growth, Net Dollar Retention for SaaS).
- Use visuals like charts to simplify data and emphasize trends.
- Add narrative analysis to explain variances and ensure compliance with standards like GAAP.
Automation tools, like Lucid Financials, can streamline data collection, ensure accuracy, and generate board-ready reports in days. Automating recurring reports reduces manual errors (88% of spreadsheets contain errors) and allows teams to focus on analysis rather than data gathering.
Customized and automated financial reports turn board meetings into productive strategy sessions, ensuring directors can focus on insights rather than raw data.
How To Automate Financial Reports Without A Developer
sbb-itb-17e8ec9
Core Components of Board-Ready Financial Reports
When presenting financial data to your board, clarity is key. A well-prepared financial report combines three essential elements: financial statements that outline your current position, projections that assess operational longevity, and metrics that measure progress toward strategic goals. Each of these serves a distinct and critical purpose.
Balance Sheets and Income Statements
The balance sheet provides a snapshot of your company's financial standing by summarizing assets, liabilities, and equity at a specific moment. Board members rely on it to gauge liquidity through the current ratio and assess leverage using debt-to-equity calculations. This foundational document helps directors understand the company's financial health and ensures transparency.
The income statement, often referred to as the profit and loss statement, highlights revenue, expenses, and profitability over a given period. It reveals performance trends that allow directors to evaluate whether the company is meeting its financial goals. Presenting these trends in a clear and tailored way helps board members quickly determine if financial performance aligns with strategic objectives.
The statement of cash flows completes the financial picture by tracking the movement of cash across operating, investing, and financing activities. This report is essential for identifying whether the company can meet its financial obligations, even if accounting profitability suggests otherwise. Clear cash flow reporting is crucial for maintaining board confidence.
Cash Flow and Runway Projections
Cash runway projections estimate how many months your company can operate based on its current burn rate. These projections are critical for guiding decisions on hiring, budgeting, and fundraising. Pairing these with a Budget vs. Actuals (BVA) analysis further enhances credibility by showing how well actual performance aligns with forecasts.
Zero variances are neither realistic nor expected. What matters is showing a clear understanding of why discrepancies occurred.
When variances arise, boards expect more than just explanations - they want detailed root cause analyses and corrective actions. This level of insight transforms financial reports from mere data summaries into strategic decision-making tools.
KPIs and Metrics for Your Business
The metrics you track should align with your company’s growth stage. For pre-seed startups, focusing on cash runway and headcount makes sense. As companies grow into Series A and beyond, more comprehensive dashboards and waterfall reporting become valuable.
For SaaS companies, metrics like ARR growth and Net Dollar Retention (NDR) are closely tied to enterprise value. Top-performing SaaS enterprises often achieve annual ARR growth of 45% and maintain NDR above 120%. To avoid overwhelming your board, limit your dashboard to 6–8 key metrics. This approach ensures directors stay focused on the big picture rather than getting lost in operational minutiae.
How to Create Customized Financial Reports
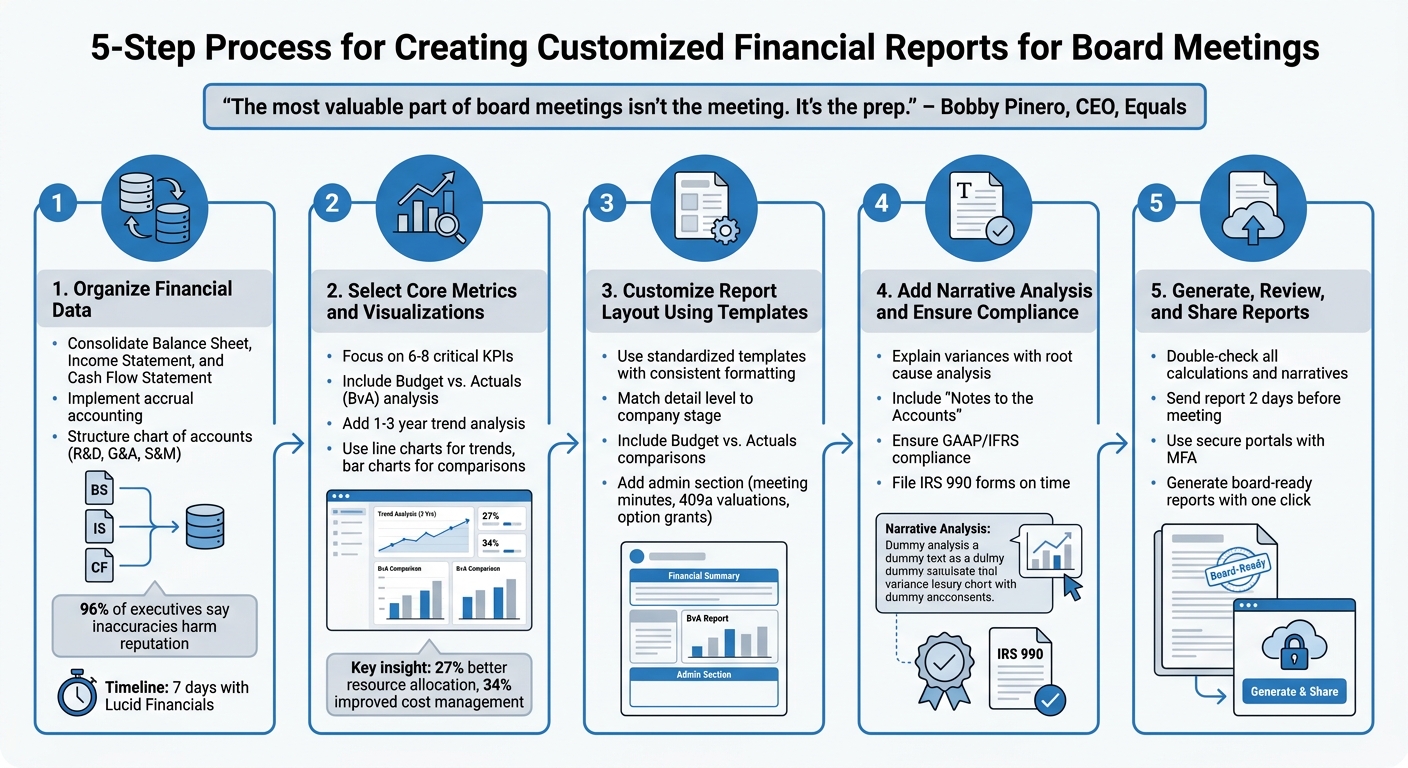
5-Step Process to Create Board-Ready Financial Reports
Turning raw financial data into a polished, board-ready report doesn't have to feel overwhelming. By breaking the process into clear steps, you can create reports that not only instill confidence but also guide strategic decisions.
Step 1: Organize Financial Data with Lucid Financials

Start by consolidating your key financial statements - Balance Sheet, Income Statement, and Cash Flow Statement - into a unified format. This is crucial, especially when considering that 96% of executives acknowledge that inaccuracies in financial reports can harm their organization's reputation.
Lucid Financials simplifies this process. It integrates bookkeeping, tax services, and forecasting into a single platform, delivering clean, real-time financial data in just seven days. This means you’ll have a centralized, investor-ready view at your fingertips.
To provide clarity, implement accrual accounting and structure your chart of accounts to categorize operating expenses into R&D, G&A, and S&M. Adding headcount data and key performance indicators alongside these statements helps highlight the main drivers of your expenses. Companies that use Budget vs. Actuals analysis see improvements in both resource allocation (27%) and cost management (34%).
"The most valuable part of board meetings isn't the meeting. It's the prep." – Bobby Pinero, CEO, Equals
Timeliness is key - ensure the board receives financial reports within two to three months of the reporting period. With Lucid Financials' Slack integration, you can address financial questions in real time, giving you instant access to accurate data whenever needed.
Step 2: Select Core Metrics and Visualizations
Focus your report by selecting 6–8 critical KPIs to feature on a streamlined dashboard. Summarize income and expense categories instead of diving into every line item. Include a trend analysis covering one to three years to help directors spot patterns and anticipate future needs.
Budget vs. Actuals (BvA) comparisons are especially valuable. They demonstrate your team’s ability to manage projections effectively, building trust in future forecasts. When variances occur, explain the reasons behind them - whether it’s a drop in conversion rates, delayed payments, or a strategic shift - rather than just presenting the numbers.
"Over time, the closer you get to your projections, the more confidence the board will have in your next projections." – Josh Aharonoff, Founder & CEO, Mighty Digits
Visual aids can make a big difference. Use line charts to show trends over time and bar charts to compare categories. These tools simplify complex data, making it easier for board members to grasp the key takeaways.
Step 3: Customize Report Layout Using Templates
A standardized template can save time and improve clarity. Use consistent formatting, colors, and terminology across all reports to help the board quickly understand the information. Include columns that compare actual results to both budget projections and prior periods.
The level of detail should match your company’s stage. For example, Series A+ companies might include detailed Budget vs. Actuals and waterfall reporting, while pre-seed startups can focus on cash runway and headcount.
Here’s a quick comparison to guide your template design:
| Feature | Standard Accounting Export | Tailored Board Template |
|---|---|---|
| Detail Level | High (transactional) | Summarized (strategic) |
| Context | Raw numbers only | Includes Budget vs. Actuals and explanatory narratives |
| Visuals | Basic tables/grids | Charts and KPI dashboards |
| Compliance | Basic ledger accuracy | Includes notes, 990 verification, and 409a items |
Consider adding an admin section for critical board items like meeting minutes, 409a valuations, and option grants. This ensures compliance without derailing strategic discussions during the meeting.
Step 4: Add Narrative Analysis and Ensure Compliance
Once your data is consolidated, focus on creating narratives that explain variances and confirm regulatory compliance. These narratives can turn a dry report into a compelling story.
"The difference between a productive board meeting and a tedious update session often comes down to how financial information is presented." – Abacum
Include "Notes to the Accounts" to clarify accounting practices or any complex items. Ensure compliance with regulatory standards like GAAP or IFRS and file necessary documents, such as IRS 990 forms, on time. Lucid Financials can help by tracking compliance requirements and flagging potential issues early, with expert reviews ensuring accuracy.
Step 5: Generate, Review, and Share Reports
Before distributing your report, double-check all calculations and narratives for accuracy. Make sure the insights align with the data and avoid generic commentary.
Send the finalized report deck at least two days before the meeting to give board members time to review. This transforms the meeting into a strategic discussion rather than a basic presentation, as directors will arrive informed and ready to dive into the numbers.
Lucid Financials makes this process seamless by generating board-ready reports and investor-grade forecasts with a single click. With real-time updates, you’ll always have current data on hand, whether you’re scaling, fundraising, or hiring. Say goodbye to the last-minute scramble for reports.
Using Automation to Speed Up Reporting
Manual board reporting often drains time, as teams focus more on gathering data than analyzing risks and variances. Here's a startling fact: 59% of finance teams plan to increase AI spending and are already seeing returns, while studies show that 88% of spreadsheets contain errors. This reliance on flawed data can lead to decisions based on incomplete or incorrect information. By automating reporting processes, you can build on your existing report framework, ensuring both efficiency and strategic focus.
Automating Recurring Reports
With tools like Lucid Financials, you can connect directly to systems like QuickBooks, NetSuite, Salesforce, and Gusto via APIs. This integration eliminates export errors and resolves data ownership issues. Once the data syncs, you can immediately perform trust checks - like completeness, reconciliation, and freshness - to flag any outliers. For example, setting a firm data freeze deadline (e.g., noon on Day 6) ensures that any changes after this point are logged as exceptions, maintaining data integrity.
Lucid Financials also offers smart templates that automatically update visuals and charts. Built-in prompts notify department heads to explain significant variances, while features like digital sign-offs, version control, and audit trails replace the chaos of email threads. Here's a typical automated reporting timeline:
| Day | Owner | Activity | Output |
|---|---|---|---|
| 1-3 | Finance Ops | Automated data fetch and validation checks | Clean, refreshed datasets |
| 4-5 | Dept Leads | Narrative contributions and KPI commentary | Draft narrative complete |
| 6 | CFO/CEO | Executive review and final edits | Approved board pack |
| 7 | Ops/EA | Secure distribution to board | Directors receive board pack |
| 14 | Board | Board meeting | Decisions and action items |
To ensure accountability, assign one owner per metric using a clear RACI matrix: Finance Ops as Responsible, CFO as Accountable, Department Leads as Consulted, and the Board as Informed.
"Board reporting automation turns reporting into a system that runs on schedule, with consistent data, and a clean approval trail."
- Kevin Daniel Pantasdo, Expert in AI-powered application creation
When it comes to distributing sensitive financial data, security is key. Instead of emailing PDFs, use secure portals with multi-factor authentication (MFA) and revocable access. Lucid Financials automates this process, keeping your confidential information safe while ensuring clarity and readiness for board meetings. Automating recurring reports not only saves time but also adds strategic depth to your board materials.
Improving Reports for Future Meetings
Automation doesn’t stop once the report is sent out. The best finance teams continuously refine their board materials based on feedback and shifting priorities. After each meeting, identify which variances are routine and which indicate deeper strategic issues. Future reports should focus on the latter.
Gather specific feedback from board members about what they found most useful - and what they skipped. This input helps you adjust templates and refine KPI selections for upcoming cycles. Research shows that organizations using systematic variance analysis improve resource allocation by 27% and cost management by 34%.
Lucid Financials simplifies this iterative process. The platform learns from your data patterns, offering real-time adjustments and trend analysis. Its AI suggests improvements, while your finance team ensures compliance and aligns outputs with strategic goals. By automating these steps, every board meeting benefits from accurate, timely insights that enhance decision-making.
Conclusion
Customized financial reports can lighten the load of reporting while ensuring precision. The trick lies in blending the essential financial statements - Profit & Loss, Balance Sheet, and Cash Flow - with contextual reporting that aligns your financial data with your startup's strategic objectives. By including clear variance explanations and homing in on 6–8 key KPIs, board meetings shift from being data dumps to productive strategy sessions. This approach turns raw numbers into actionable insights.
Accuracy and timeliness are non-negotiable. Reports should be both precise and available within 2 to 3 months to meet legal fiduciary obligations. Adding narrative analysis to your data provides board members with a deeper understanding of financial shifts. For instance, a staggering 96% of executives acknowledge that undetected errors can severely damage reputations.
"When financials are dialed in, you spend less time explaining metrics and more time getting strategic advice." - Hillock Studio
Once clarity and compliance are under control, the next step is to adopt tools that streamline the process. Lucid Financials simplifies data collection, creates investor-ready reports with just one click, and integrates seamlessly with Slack. With clean books delivered in seven days and AI-driven insights supported by seasoned professionals, you can shift your focus back to strategy. Systematic variance analysis helps uncover better ways to allocate resources and manage costs effectively.
FAQs
What 6–8 metrics should I include for my company stage?
For your company's current stage, it’s important to zero in on 8–12 key metrics that give a clear picture of growth, profitability, and financial health. Some of the most important ones to track include:
- Cash flow
- Burn rate
- Monthly recurring revenue (MRR) growth
- Customer retention rate
- Churn rate
- Lifetime value (LTV)
- Unit economics
- Cash runway
By focusing on these specific metrics, you can create reports that are not only clear but also highly relevant - especially when preparing for board presentations. Tailoring your approach like this ensures everyone stays aligned on the company’s performance and future direction.
How do I explain Budget vs. Actual variances to the board?
Budget vs. Actual variances highlight the differences between what was planned financially and the actual outcomes. These gaps provide valuable insights into a company’s performance, helping to pinpoint areas where things went better - or worse - than expected.
Key Areas to Examine
- Revenue: A higher-than-budgeted revenue is considered favorable, as it indicates the company earned more than anticipated. On the flip side, lower-than-planned revenue could signal issues like declining sales or market challenges.
- Expenses: If actual expenses are less than budgeted, it’s a positive variance, showing cost efficiency. However, higher-than-expected expenses might reveal overspending, inefficiencies, or unexpected costs.
- KPIs (Key Performance Indicators): Variances in metrics like customer acquisition costs or production efficiency can shed light on operational strengths or weaknesses.
Why Variances Matter
Understanding these variances isn’t just about numbers - it’s about their implications. For instance:
- Favorable variances (e.g., higher revenue, lower expenses) may indicate strong market demand, effective cost control, or successful strategies.
- Unfavorable variances (e.g., higher costs, lower revenue) might suggest operational bottlenecks, changing market conditions, or areas needing immediate attention.
Visualizing the Data
Using charts or graphs can make these variances easier to digest. For example:
- A bar chart comparing budgeted vs. actual revenue can quickly highlight areas of overachievement or shortfall.
- A pie chart breaking down unexpected expenses can pinpoint where overspending occurred.
These visuals not only clarify the numbers but also help the board grasp the broader operational and strategic impact. Whether it’s a need for course correction or a chance to replicate success, these insights are crucial for informed decision-making.
How can I automate board reporting without losing accuracy or compliance?
Automating board reporting becomes much easier with interactive financial dashboards that connect directly to your accounting systems. These dashboards provide real-time updates and ensure the accuracy of your data. By concentrating on key metrics, standardizing data to reduce errors, and incorporating clear visualizations with features like drill-downs and filters, you can present information in a way that's both precise and easy to understand.
Automated updates not only save time but also help ensure compliance with reporting standards. Tools like Lucid Financials simplify this process by offering investor-ready reports, letting you streamline your workflow without sacrificing clarity or precision.