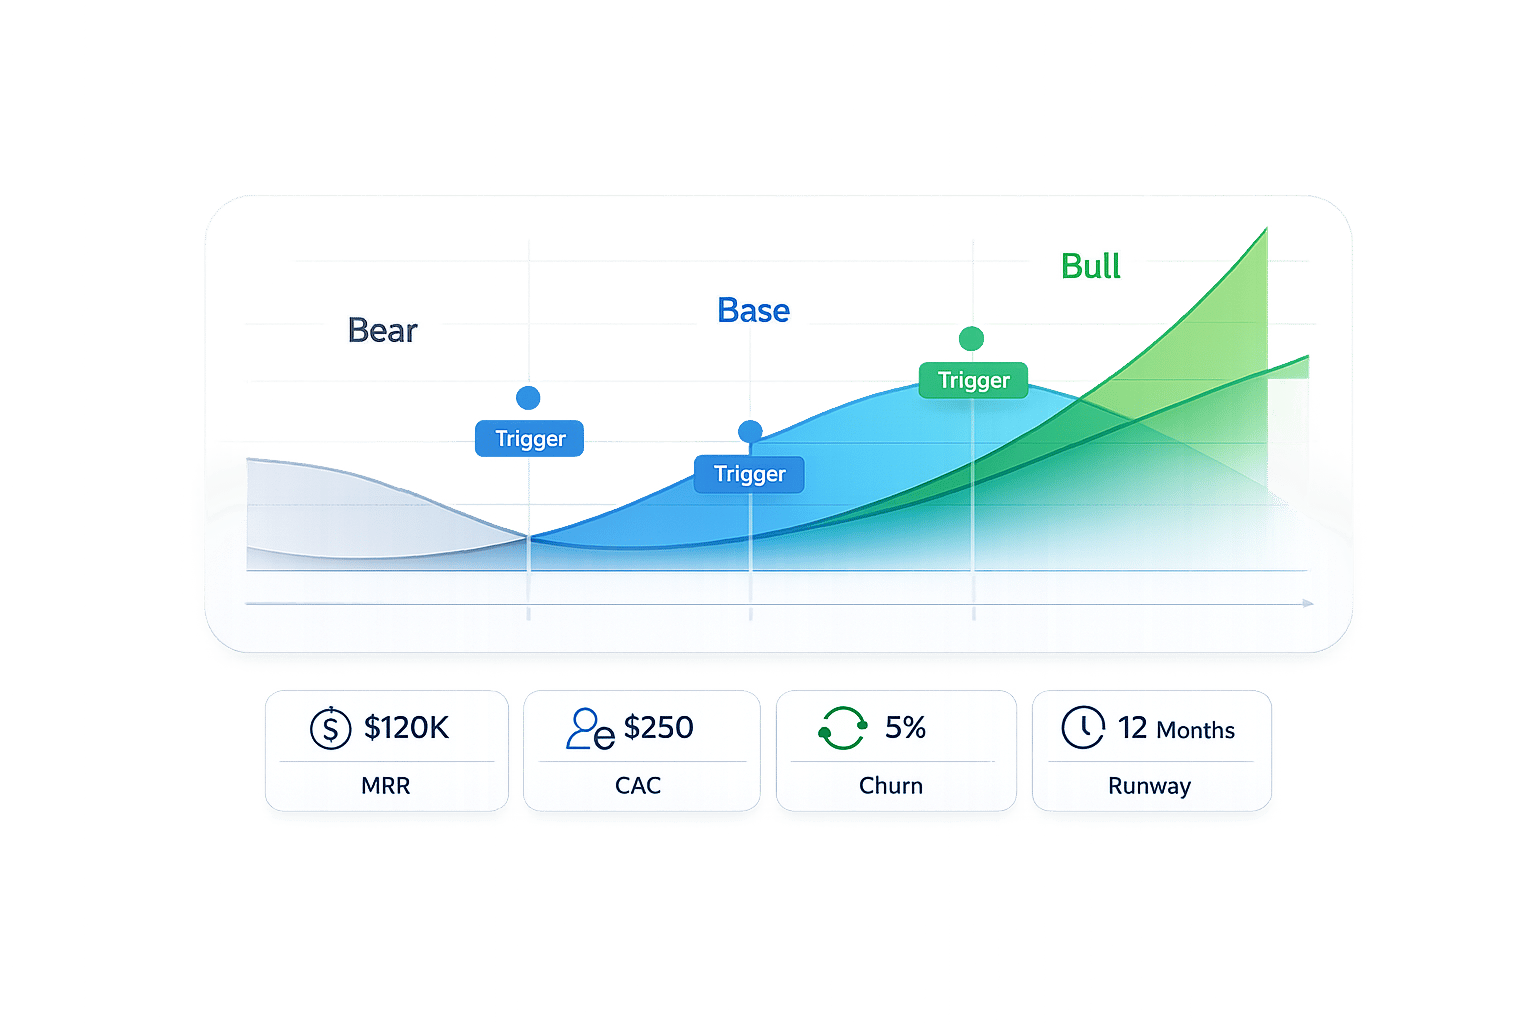
If I had to cut this down to one line: use K-Means for simple segments, Hierarchical for layered groupings, DBSCAN for odd transactions, and GMM when accounts sit between groups.
Startup finance data is messy. Customer payments drift, vendor bills spike, and burn patterns change month to month. This article compares 4 clustering methods and shows where each one fits in planning work like:
- Customer segmentation
- Expense grouping
- Vendor spend review
- Runway and burn analysis
- Irregular transaction checks
Here’s the short version:
- K-Means works well when your data is clean and you want clear groups.
- Hierarchical Clustering helps when you want to see how small groups roll up into bigger ones.
- DBSCAN is strong for finding outliers and noisy records, like a $100,000+ invoice that does not match normal spend.
- Gaussian Mixture Models (GMM) fit cases where records overlap and a hard label is too simple.
In plain terms: if you want a fast first pass, start with K-Means. If you need a tree view, use Hierarchical. If your main goal is flagging strange activity, use DBSCAN. If you need probabilities for forecast scenarios, use GMM.
Quick Comparison
| Method | Best for | Main strength | Main limit |
|---|---|---|---|
| K-Means | Clean customer or expense segments | Simple and fast | Weak with outliers and uneven shapes |
| Hierarchical | Layered cost or revenue views | Shows parent-child groupings | Can get slow on large datasets |
| DBSCAN | Outlier and anomaly checks | Marks noise automatically | Settings can be hard to tune |
| GMM | Overlapping financial profiles | Gives probability by segment | Harder to explain |
If you’re planning cash flow, burn, or runway, the right clustering method can stop one-off records from bending your view of the business.
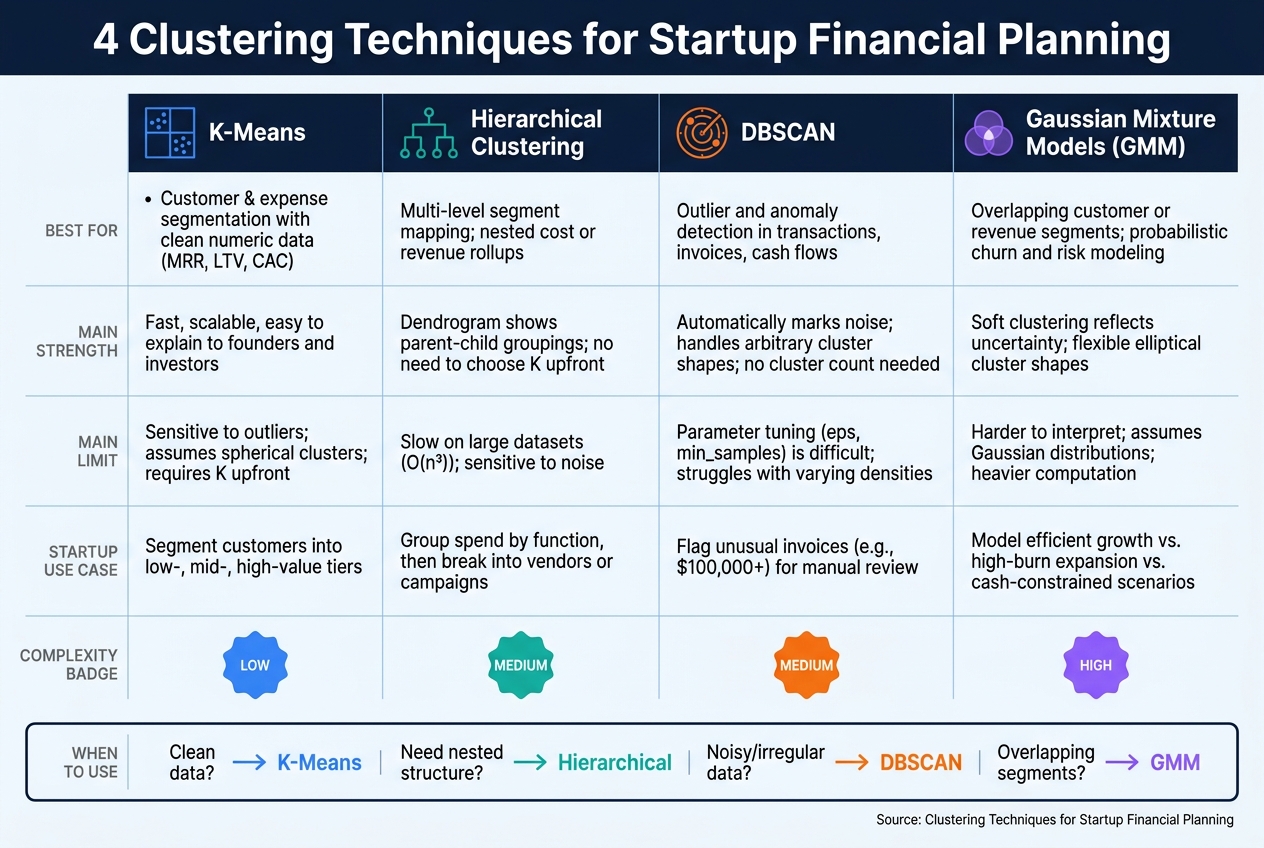
4 Clustering Techniques for Startup Financial Planning: Quick Comparison Guide
Clustering Models Explained with Intuition (Handwritten) | K-Means, DBSCAN, Hierarchical
sbb-itb-17e8ec9
1. K-Means Clustering
K-Means is a solid place to start for early-stage startups. It groups records into K clusters by assigning each data point to the nearest centroid. Because it’s fast and simple, it works well as a first-pass segmentation method.
Financial Planning Use Case Fit
K-Means works best when you need broad segments from clean numeric data. Say a SaaS startup wants to group customers by monthly spend, churn risk, and gross margin. K-Means can split them into low-, mid-, and high-value tiers that help with pricing, customer success, and budget planning.
The same idea applies to expenses. A startup can use it to sort infrastructure, people costs, growth spend, and experimental initiatives into separate groups. It also handles large billing and accounting exports well. That said, this approach depends on data that’s fairly clean and clusters that aren’t too uneven.
Outlier and Noise Handling
K-Means is sensitive to outliers because centroids are based on means. If metrics like MRR are skewed, a log transform can help. It also makes sense to review extreme invoices on their own before clustering.
Cluster Structure Assumptions
K-Means assumes clusters are roughly spherical and close in size. Startup finance data doesn’t always look like that.
Customer revenue often has a heavy tail, and expense categories can vary a lot in spread. So K-Means isn’t a bad pick, but its output should be treated as an early cut, not the final word. It tends to work better for stable metrics than for irregular cash-flow patterns.
Standardizing features and checking the results against business judgment can help you spot whether the clusters match actual financial behavior. If your startup data has nested groups or uneven shapes, hierarchical clustering can separate those patterns with more precision.
Interpretability for Founders and Finance Teams
One reason K-Means is so useful is that each centroid can be read as the average member of a group. That makes it easy to describe a cluster with metrics like average MRR, churn rate, and gross margin, then turn that into action.
For example, teams can use those summaries to:
- Prioritize upsells
- Improve collections
- Reallocate customer success headcount
A 2026 study found four financial-performance clusters after applying K-Means to company financial ratios. Labels like high-value or price-sensitive users also make investor reporting easier to follow and give finance teams a direct input for pricing, collections, and headcount planning.
This works best when groups are clearly separated. If startup records are messy or overlap a lot, the next methods tend to handle those cases better.
2. Hierarchical Clustering
K-Means gives you a flat picture. Hierarchical clustering gives you a tree of relationships.
It builds a dendrogram by merging similar records step by step, so you don't need to pick the number of clusters at the start. That's handy for early-stage startups that are still trying to figure out the natural shape of their cost structure or customer base.
Financial Planning Use Case Fit
Hierarchical clustering works well when you need to see how financial patterns sit inside other patterns. A startup can use it to group spend by function first, then break each function into vendors or campaigns.
It can also show nested customer segments. For example, you might see high-MRR accounts with heavy support use separated from mid-average revenue per user (ARPU) accounts with lighter support needs. That extra detail can guide customer success staffing, pricing, and resource allocation. The same tree view can also make unusual transactions stand out.
Outlier and Noise Handling
Hierarchical clustering doesn't screen out outliers. Instead, it places them in small, isolated branches that join other clusters only at high cut points.
So if you have a large legal settlement or one unusually large customer, it will often show up as its own branch for review. Standardizing your financial variables before running the analysis helps stop large dollar amounts from overpowering smaller but still important categories.
Cluster Structure Assumptions
Once you can see outliers, the next step is choosing how clusters connect. Ward's method is a good default when you want compact, comparable groups. Complete linkage works better for clearly separated segments. Single linkage often creates chain-like clusters, which usually fit finance data poorly.
Interpretability for Founders and Finance Teams
The dendrogram is the biggest day-to-day plus of hierarchical clustering. You can cut the tree at different heights for a board-level view or a more detailed cost review, all from the same analysis.
A color-coded dendrogram can group spend into core operations, growth, and overhead. To turn that into something a team can use, build cluster summary tables with:
- Average monthly spend in USD
- Number of vendors or customers in each cluster
- A plain-language label for each group
3. DBSCAN
When startup data is uneven and noisy, density-based clustering often works better than fixed-shape methods. DBSCAN (Density-Based Spatial Clustering of Applications with Noise) finds clusters as dense regions of data points and labels everything else as noise. It uses two settings: eps (radius) and min_samples (minimum points).
Financial Planning Use Case Fit
DBSCAN works well with irregular spend, seasonal spikes, and uneven customer behavior because you don’t need to set the number of clusters in advance. That matters in startup finance, where the data rarely lines up in neat patterns.
Applied to MRR, contract length, and payment lag, DBSCAN can separate stable SMB subscribers from irregular enterprise accounts. That split gives finance teams a cleaner base for burn and runway planning. The stable group can support your baseline forecast, while irregular enterprise deals can be treated as upside scenarios instead of being mixed into the core model.
In plain English, DBSCAN helps you separate recurring financial behavior from one-off events. That’s a big deal when you’re trying to avoid a forecast that looks better on paper than it does in the bank account.
Outlier and Noise Handling
One of DBSCAN’s biggest strengths is that it doesn’t shove every data point into a cluster. Points in low-density areas are marked as noise, so outlier detection is built into the result from the start.
That has a direct finance use case. A one-off annual contract, a legal expense, or a duplicate invoice can be flagged as noise instead of skewing segment averages. In other words, the oddball items stay visible instead of quietly bending the numbers.
Finance teams can also turn this into a simple control rule. Any transaction flagged as noise above a set USD amount, such as $100,000, can be routed to manual review for cash-flow protection, expense validation, or invoice cleanup.
Interpretability for Founders and Finance Teams
After clustering, the reporting step matters just as much as the model itself. The output needs to be translated into business language that people can act on. Labels like "core burn", "seasonal spend," and "exceptional items" make the results much easier to discuss across finance, leadership, and the board.
For board and investor reporting, show how much revenue or spend falls into dense, predictable clusters versus flagged outlier events, and then tie each category back to the forecast. That way, people can see which numbers come from stable patterns and which come from unusual activity.
4. Gaussian Mixture Models (GMM)
Where DBSCAN gives you a hard noise label, GMM deals with overlap through probabilities. Instead of forcing each record into one segment, GMM assigns a probability to each one. So a record can sit across multiple segments at the same time. That makes sense for startup finance, where patterns often blur together instead of falling into neat boxes.
Financial Planning Use Case Fit
GMM works best when financial behavior overlaps. A customer group or cost center might look like it belongs to more than one segment. K-Means makes a hard choice. GMM shows how strongly each account fits each segment.
That probability-based view is especially useful for scenario planning. Each component can stand for a regime like efficient growth, high-burn expansion, or cash-constrained operations. The weights show how likely each regime is. Finance teams can use that to build base-case, upside, and downside forecasts that reflect actual uncertainty around essential financial metrics like burn, runway, revenue quality, and customer mix, instead of relying on one fixed plan.
Cluster Structure Assumptions
GMM assumes each cluster follows a Gaussian distribution. Unlike K-Means, though, it can model elliptical clusters. That matters when metrics move together, like headcount and burn. In startup finance, headcount, burn rate, and revenue usually do not move on their own, so clusters that reflect those links are often a better match.
You also need to choose the number of components ahead of time, or estimate it with AIC or BIC model-selection criteria. Add too many components, and the model may start fitting noise instead of actual patterns. So before using a cluster in a forecast, check that it lines up with a business pattern you can name and explain. The probability-based view is useful, but it comes with tradeoffs, which the comparison below gets into.
Outlier and Noise Handling
GMM has no built-in noise label. One-off grants, acquisition costs, or odd vendor payments can skew means and covariances, especially when the dataset is small. A good move is to flag points with low probability across all components before they distort burn and runway forecasts. It also helps to clean out known one-offs before fitting the model.
Interpretability for Founders and Finance Teams
GMM is less intuitive than K-Means, but the output doesn't have to feel dense. The trick is to translate cluster probabilities into plain business labels like efficient growth, high-burn expansion, and cash-constrained, then show the average metrics for each segment.
For board reporting, a simple chart usually works better than a covariance matrix. Show which financial profile the company is closest to, then show the probability of shifting into another regime under different hiring or pricing assumptions. That's the kind of view people can act on. Keep the number of segments low, limit the metrics, and use probabilities to make uncertainty visible.
Pros and Cons of Each Clustering Technique
Use this section to choose based on data shape. K-Means fits clean segmentation, hierarchical clustering fits nested rollups, DBSCAN fits noisy anomaly work, and GMM fits overlapping risk regimes. So the comparison below works as a practical choice map, not just a recap.
K-Means is a good starting point for customer segmentation and expense grouping when your data is clean and numeric. It runs in O(nk) time, which helps as transaction and ledger datasets get larger. If you want a fast baseline, start here. If the clusters turn out uneven, move to a more flexible method.
Hierarchical Clustering makes sense when you need to show how smaller sub-segments roll up into broader cost or revenue groups. Its biggest limits are speed - some implementations scale as O(n³), while more efficient versions reach O(n² log n) - and the fact that you usually need to rerun it from scratch when new data comes in. It works well for nested rollups. If your data is messy or noisy, DBSCAN may be the better next step.
DBSCAN is often the best fit for transaction outlier detection, like unusual vendor payments, odd cash movements, or invoices that sit outside normal patterns. The hard part is tuning eps and min_samples across financial data that might include tiny subscriptions and large wire transfers in the same set. Use it when anomaly detection matters more than neat segment boundaries.
GMM works best when customer or revenue segments overlap and you need partial membership instead of a hard label. That makes it useful for forecast uncertainty, where one account may match more than one financial profile. The tradeoff is simple: the Gaussian assumption and probability-based output can be tougher to explain to nontechnical stakeholders.
The table below turns those tradeoffs into a quick selection guide:
| Technique | Best-fit use case | Major benefits | Key drawbacks |
|---|---|---|---|
| K-Means | Customer or expense segmentation with clean numeric features such as MRR, LTV, and CAC | Fast, scales well, and is easy to explain to founders and investors | Requires the number of clusters upfront; sensitive to outliers; assumes roughly spherical clusters |
| Hierarchical Clustering | Multi-level segment mapping, such as how sub-segments roll up into broader cost or revenue groups | Easy-to-read dendrogram; no need to choose K upfront | Poor scaling on large datasets; sensitive to noise; results can shift with linkage method |
| DBSCAN | Anomaly detection in transactions, invoices, and cash flows | Finds outliers automatically; handles arbitrary shapes; no cluster count needed | Parameter tuning is not simple; sensitive to feature scaling; struggles with varying densities |
| GMM | Overlapping customer or revenue segments; probabilistic churn and risk modeling | Soft clustering reflects uncertainty; flexible cluster shapes; richer risk modeling | Harder to interpret; heavier to run; assumes Gaussian distributions |
Conclusion
The best clustering method depends on the shape of your data and the call you need to make. What matters is picking the method that fits the planning job in front of you.
For customer segmentation, use K-Means. For nested financial relationships, use Hierarchical Clustering. For outliers and irregular patterns, use DBSCAN. For probabilistic assignments across overlapping segments, use GMM.
In practice, the best setup is often layered. You might use K-Means for segmentation, Hierarchical Clustering to see structure, DBSCAN to flag noise, and GMM to handle overlap. The point isn't the model by itself. The point is whether the output helps with forecasting, burn control, runway planning, and vendor review. Lucid Financials can turn those clusters into cleaner books, faster reporting, and tighter planning.
Match the method to the question, test it against actual financial behavior, and use it inside planning workflows.
FAQs
How do I choose the right clustering method?
Choose the right clustering method based on your financial goals and the kind of data you have. Start by getting clear on the job: do you want to group customers by behavior, or sort transactions to spot anomalies?
Put AI-driven methods at the top of your list if they can respond to real-time metrics, match your business goals, connect with your financial systems, and handle growth as your startup scales.
What startup finance data should I cluster first?
Start with cash flow and burn rate data. That’s often the easiest place to begin because key inputs like AR aging, vendor payment history, past burn, and transaction volumes are usually already on hand.
This also connects clustering to day-to-day finance decisions right away. Once you have a cash flow baseline, you can branch into customer churn, payment behavior, or headcount and operating costs.
How often should I update clustering models?
To keep financial planning on track, step away from periodic manual updates when you can and use real-time processing instead. That way, your models reflect current market conditions and customer behavior, not stale snapshots from weeks ago.
If needed, review system performance monthly and refresh core model assumptions quarterly. Better yet, let updates happen automatically as new data comes in. It helps keep financial strategies tied to what the business is doing right now.