Most cross-sell campaigns fail for one simple reason: the offer goes to the wrong customer at the wrong time. I fix that by using clean customer data, a small set of segments, and clear revenue tracking tied to expansion ARR.
Here’s the short version:
- I start with customer-level revenue data in U.S. dollars
- I group accounts using product use, account value, health, and firmographic data
- I keep the first version simple with 3 to 5 segments
- I push those segments into CRM, email, and in-product tools
- I track attach rate, conversion rate, and expansion ARR by segment
- I update scores at least monthly so offers stay current
If I skip clean IDs, timestamps, and revenue labels, the model can look right but still give me the wrong answer. And if I can’t separate base revenue from expansion revenue, I can’t tell whether a campaign added new money or just moved numbers around.
A few numbers matter most here:
- 10 to 100 employees: the startup team size this playbook fits best
- 3–5 segments: the right starting range for most early teams
- Monthly refreshes: a simple cadence to keep segment logic from going stale
What this guide shows, in plain terms, is how I move from raw customer data to live cross-sell programs: collect the right inputs, build simple segments first, add clustering and propensity scoring later, and measure which groups produce more expansion revenue.
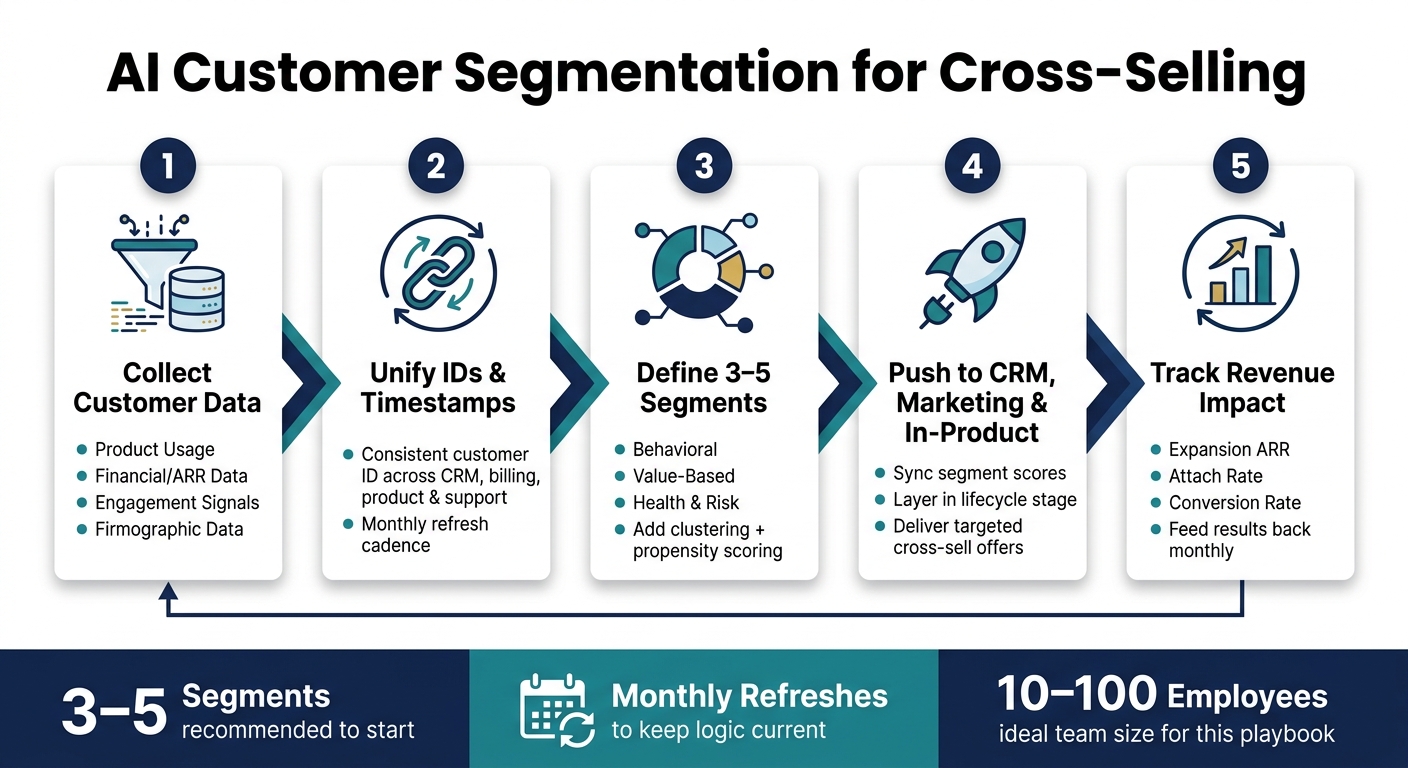
AI Customer Segmentation for Cross-Selling: Step-by-Step Process
How to Build Customer Segments with AI (Real-World Use Case)
sbb-itb-17e8ec9
Build the Data Foundation for AI Segmentation
Start with clean, consistent customer data. If your data is messy, segments drift. And when segments drift, cross-sell offers tend to miss.
These inputs become the base for your segment rules and model scoring.
Collect the right customer data
The main inputs for AI segmentation usually fall into four groups.
- Product usage: login frequency, specific feature adoption, user counts, and integration depth
- Financial and revenue data: ARR, contract size, payment history, and expansion history
- Relationship and engagement signals: stakeholder activity, support interactions, and sentiment such as NPS or CSAT
- Firmographic data: company size, industry, growth stage, and market position
It also helps to track expansion potential. That means looking for untapped departments or unused features within an existing account. The point isn't just to describe where an account stands today. It's to spot signs that more growth is possible.
Pick a segmentation method that fits your stage
If you're on a lean team, start simple. Pick one non-revenue dimension, like product behavior or customer health.
| Segmentation Dimension | Key Data Inputs | Primary Use Case |
|---|---|---|
| Behavioral | Product adoption stage, feature affinity, engagement frequency | Timing feature-based upgrade offers and add-on campaigns |
| Value-Based | Current ARR, expansion potential, contract maturity | Allocating CSM resources and prioritizing expansion |
| Health & Risk | Health scores, sentiment signals (NPS/CSAT), support escalations | Triggering proactive save campaigns and interventions |
A good starting rule is to define only 3–5 primary segments at first.
Once you know which segment types you want, standardize the customer record so each account can move cleanly between them.
Keep IDs, timestamps, and product data consistent
This is where data quality usually falls apart. Every customer record needs one consistent ID across your billing system, CRM, product analytics, and support tools. If the same account shows up differently from one system to another, your segments will end up with gaps and duplicates.
Standardize timestamps and product event names across systems too. Then refresh your segments at least once a month. If the data gets old, you'll send the wrong cross-sell offer at the wrong time.
Use rules that shift customers between segments as their behavior or health scores change instead of relying on static lists.
Document each segment's trigger, threshold, and purpose. That keeps the model aligned.
With the data layer fixed, you can move to scoring and clustering.
How to Build AI-Powered Segments Step by Step
Step 3: Add clustering and propensity scoring
Once your segments stop shifting around, bring in clustering to group similar accounts and propensity scoring to rank the odds of expansion or churn.
This is where things get more useful. A flat revenue tier can lump very different accounts together. Two customers might both spend $50,000 a year, but one is growing fast while the other is drifting toward churn. Clustering helps you sort accounts by shared traits, and propensity scoring helps you rank which ones are more likely to expand or leave.
Use those scores to split simple revenue bands from accounts that have actual growth room. Then carry those scores into the next step, where they power the cross-sell rules.
Turn Segments Into Active Cross-Sell Programs
Push segments into CRM, marketing, and product tools
Once your scores are in place, the next step is simple: put them into the tools that deliver offers.
Sync segment scores into your CRM, marketing automation platform, and in-product prompt system so offers shift as customer behavior and lifecycle stage change. That way, you’re not sending the same cross-sell message to everyone.
For example, a new high-value customer should see a different offer than a renewal-stage high-value customer. The segment may be the same, but the timing is not. Add lifecycle stage on top of each segment so cross-sell outreach stays precise and well timed.
Measure revenue impact by segment
After activation, look at which segments actually grow.
Track expansion ARR, attach rate, and conversion rate by segment. Then use signals like adoption, engagement, and integration depth to understand why some segments perform better than others.
This helps separate surface-level wins from patterns you can use again.
Refresh models and manage risk
Feed the results back into the model each month.
Use risk-based triggers to flag low health-score accounts for intervention before attempting a cross-sell. In the same way, use health-score triggers to skip low-fit accounts instead of pushing offers that are unlikely to land.
Apply the Process by Business Model and Next Steps
SaaS, ecommerce, and fintech use cases
Once the core framework is in place, shape the signals around how each business model grows.
In SaaS, login frequency and feature use can show which accounts are ready for an upgrade. In ecommerce, purchase frequency and category overlap can point to bundle opportunities. In fintech, transaction volume and untapped products, categories, or departments can show where expansion is most likely.
Across all three, the aim stays the same: spot expansion potential early and build segment-specific playbooks around it.
What founders should do first
At the start, skip clustering. Use behavior or health as your second axis beyond current account value. That becomes the second axis founders should use.
Keep it simple:
- Define 3–5 segments with clear thresholds
- Build one offer rule for each segment
- Decide what success looks like before you segment, whether that’s a higher expansion rate or a clearly identified "Expansion Ready" subgroup
As the program matures, automate movement between segments so the logic updates with real-time behavior or health scores instead of manual reviews.
Conclusion: The direct path to better cross-sell results
Segments only matter if they improve expansion revenue. Measure that first, then adjust the logic from there.
When you need to connect segment performance to the books, Lucid Financials gives startups real-time, investor-ready reporting to connect segmentation decisions to revenue.
FAQs
How do I choose my first 3–5 segments?
Start with a clear, measurable business goal, like reducing churn or increasing expansion revenue. Then narrow your focus to 3–4 behavior signals linked to that goal, such as purchase frequency, feature usage, or spending patterns.
Keep the scope small at first. That makes it easier to test with a specific customer group, check the results, and adjust your approach without making things messy.
Lucid Financials can help you track the financial impact with real-time analytics and integrated reporting.
What data matters most for cross-sell segmentation?
Look beyond static demographics. The data that helps most includes:
- Transactional history, such as purchase frequency, average transaction value, and expansion history
- Behavioral signals, like product usage, feature adoption, and engagement patterns
- Firmographic and relationship data, including company size, industry, growth stage, support history, and sentiment
Taken together, these data points give you a more current view of cross-sell opportunities.
When should I add AI scoring or clustering?
Add AI scoring and clustering when manual, static customer classifications stop telling you enough. This tends to happen when your customer base gets too complex to sort by hand, or when you need to spot micro-segments and likely cross-sell opportunities.
Use clustering to find natural groups based on behavior. Use scoring to rank customers by how likely they are to buy.
A simple way to start:
- Focus on high-volume products first
- Test on smaller customer groups before rolling it out more broadly
That way, you can learn what works without biting off more than you can chew.