Churn tells me who I’m losing; retention tells me who’s staying active. I measure both using the same customer group and time window. If 200 of 1,000 starting customers become inactive, churn is 20% and retention is 80% - new buyers don’t change those rates.
For your store, I’d start with three checks:
- Define inactivity around reorder timing. Track subscription cancellations, failed payments, and returning customers separately.
- Check spending, not just customer counts. Review repeat purchases, purchase frequency, average order value, cohort retention, lifetime value, and existing-customer revenue.
- Connect the numbers to profit and cash. Use them to plan ads, inventory, and cash flow; test retention offers against incremental contribution profit; and reconcile sales with accounting records.
Quick Comparison
| Comparison | Churn | Retention |
|---|---|---|
| What I measure | Starting customers who become inactive | Starting customers who remain active |
| Calculation | Lost ÷ starting customers × 100 | Retained ÷ starting customers × 100 |
| Better direction | Lower | Higher |
| What it leaves out | Customer spending and profit | Customer spending and profit |
My rule: <u>keep customer definitions consistent</u>, compare matching cohorts, and review each business entity before combining results. More repeat orders don’t automatically mean more profit.
Customer Retention & Churn Rate for Ecommerce (incl. template)
sbb-itb-17e8ec9
Churn vs. Retention: Definitions and Formulas
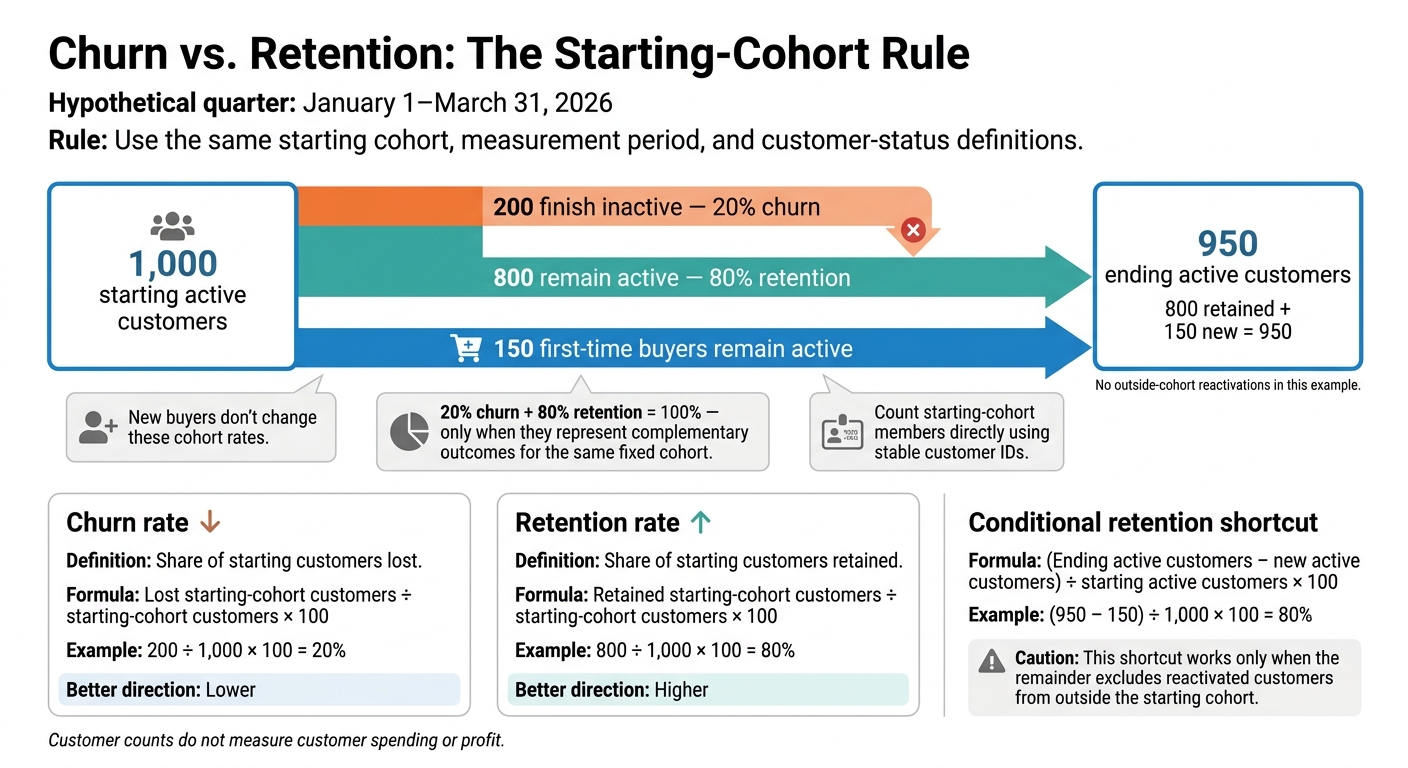
Churn vs. Retention: The Starting-Cohort Rule
| Measurement aspect | Churn rate | Retention rate |
|---|---|---|
| Definition | Share of starting customers lost | Share of starting customers retained |
| Formula | Lost starting-cohort customers ÷ starting-cohort customers × 100 | Retained starting-cohort customers ÷ starting-cohort customers × 100 |
| Interpretation | Higher means more customer loss | Higher means more customers stayed active |
Use the starting cohort as the denominator. Then apply both formulas to the same cohort over the same measurement period.
Define Customer Status and Purchase Cycles
Before calculating either rate, define who counts as active, lost, and reactivated. Set the measurement period and eligible orders, including how you’ll handle refunds, fraud, test orders, cancellations, and payment failures.
Starting active customers are active when the period begins; ending active customers are active when it ends. First-time buyers place their first eligible order during that period. Retained customers come from the starting cohort and remain active. Lost customers come from that same cohort but end the period inactive.
Reactivated customers return after exceeding your inactivity threshold. Base that threshold on actual reorder intervals. Report subscription cancellations separately from missed reorders, and distinguish voluntary cancellations from payment failures.
Calculate Churn and Retention for the Same Cohort
Required hypothetical quarter: January 1–March 31, 2026. Start with 1,000 active customers. Of those, 200 finish inactive and 800 remain active. Another 150 first-time buyers remain active, bringing the ending total to 950. With no outside-cohort reactivations, churn = 200 ÷ 1,000 × 100 = 20%, and retention = 800 ÷ 1,000 × 100 = 80%. The ending count reconciles as 800 + 150 = 950.
The shortcut gives the same 80%: (ending active customers − new active customers) ÷ starting active customers × 100. But it works only when the remainder excludes reactivated customers from outside the starting cohort.
Use stable customer IDs to count cohort members directly. Churn and retention add up to 100% only when they represent complementary outcomes for the same fixed cohort. Apply that same rule when comparing segments.
Compare Results by Cohort and Business Entity
With cohort rules in place, break down results to see where churn is rising or retention is strongest. Compare first-order cohorts, acquisition channels, product categories, geographies, and subscription statuses. Show each segment’s starting customer count.
One cohort may have high churn and low retention, while another has the reverse. Match benchmarks to the category, purchase cycle, and measurement window - not just the percentage.
Show entity-level results alongside consolidated totals. Before calculating group-wide rates, deduplicate shared customers using a common customer identifier. Document whether the analysis is customer-level, entity-level, or account-level, since each answers a different question.
Customer Metrics Beyond Churn and Retention
Churn and retention count customers. They don’t tell you how much those customers buy. These metrics link customer activity to revenue and margin, helping you see whether retained customers buy more and bring in more revenue.
| Metric | Calculation basis | How it differs from churn/retention |
|---|---|---|
| Repeat purchase rate | Customers with at least two completed orders during the period ÷ purchasing customers during the period × 100 | Tracks repeat buying, not subscription retention. |
| Purchase frequency | Total orders during the period ÷ purchasing customers during the period | Tracks orders per buyer, not future activity. |
| Average order value (AOV) | Net order revenue ÷ orders | Tracks spending per order, not whether customers reorder. |
| Cohort retention | Acquisition-cohort customers purchasing in a later window ÷ original cohort customers × 100 | Tracks returns within set windows, not continuous activity. |
| Lifetime value (LTV) | AOV × purchase frequency × average customer lifespan; multiply by gross margin for gross-margin LTV | Models customer value based on spending, frequency, lifespan, and margin. |
| Existing-customer revenue retention rate | Current-period revenue from the starting customer group ÷ prior comparable revenue from that group × 100 | Tracks spending growth or decline, not customer counts. |
Measure Repeat Purchases, Frequency, and Order Value
Use the same period and group of purchasing customers for all three measures. Define what counts as an order, consistently exclude canceled orders, and use the same refund and discount rules each time. Specify whether revenue includes shipping charges. Exclude sales tax collected on behalf of states.
Calculate contribution profit by subtracting product cost, payment fees, fulfillment, shipping subsidies, returns, discounts, and service costs from net revenue. Don’t subtract returns or discounts twice if they’re already reflected in net revenue. These figures feed the LTV and revenue-retention metrics below.
Measure Cohort Retention, Lifetime Value, and Revenue Retention
Track purchases across successive windows that match the product’s reorder cycle. A buyer might skip one window and return in the next. Cohort retention measures activity within each window, not continuous activity.
Use these metrics to build revenue forecasts from retention data. Estimate gross-margin LTV = AOV × purchase frequency × average customer lifespan × gross margin, with matching time units. Specify whether lifespan comes from observed data, a churn-based estimate, or a fixed cutoff. LTV is a model - not accounting profit.
For revenue retention, leave out new-customer revenue. Compare equivalent periods using the same revenue, refund, and discount rules. Revenue retention can exceed 100% when existing customers spend more, even if fewer remain active. Read it alongside customer-count retention to tell customer losses apart from changes in spending.
Separate Subscription Churn From Purchase Inactivity
Subscription churn ends a billing relationship. Purchase inactivity marks a missed reorder window. Repeat purchases, cohort activity, and subscription renewals measure different behaviors. Define how you’ll handle pauses, skips, failed payments, and reactivations before reporting.
| Measurement aspect | Subscription churn | Non-subscription purchase inactivity |
|---|---|---|
| Cancellation signal | Cancellation, nonrenewal, or defined involuntary churn | No purchase within the expected reorder window |
| Measurement window | Billing or renewal interval | Product-specific purchase cycle |
| Interpretation | A recurring billing relationship ends | A reorder window passes without a purchase |
| Pauses and skips | Classify as retained, temporarily inactive, or churned | Separate delayed purchases from inactivity based on a set threshold |
| Failed payments | Count involuntary churn after retries or a defined grace period | Don’t count a failed payment as churn until retries fail or the order remains unpaid |
| Reactivation | Classify restarted subscriptions consistently | Define whether a return resets inactivity while preserving cohort membership |
Use Churn and Retention for Financial Planning
Retention can steady revenue and make customer acquisition more cost-effective, but margins still determine profit. Keep the cohort and observation-window definitions from the previous section consistent across every forecast. Use customer signals to shape financial plans - not just sales targets.
These metrics connect customer behavior to decisions about revenue, inventory, and cash.
| Planning decision | Churn and retention signals | Financial input needed |
|---|---|---|
| Revenue forecasts | Fewer active customers, slower reorders, or shorter customer lifespans mean fewer future orders; stronger retention makes forecasts steadier. | Customers by cohort, purchase frequency, AOV, refunds, discounts, timing of cash receipts, and gross margin |
| Acquisition budgets | Higher churn lowers LTV and lengthens CAC payback; stronger retention supports higher CAC. | Marketing spend, new customers, cohort LTV, contribution margin, and target CAC payback period |
| Inventory purchases | Lower expected reorder volume means less stock is needed, but increases obsolescence risk; stable demand supports replenishment. | Cohort demand forecast, lead time, unit cost, landed cost, stock on hand, return rate, and inventory turnover |
| Cash flow planning | Churn reduces collections while fixed costs remain; retention makes collections more predictable and helps with working-capital planning. | Collection timing, supplier payment terms, refunds, platform reserves, operating expenses, and minimum cash balance |
Link Customer Activity to Revenue and Margin
Build forecasts by acquisition cohort. Pair customer activity with realized net revenue, gross margin, return rate, CAC, and estimated LTV. Don't assume retained customers spend equally.
Run base, downside, and upside scenarios by changing retention, purchase frequency, AOV, return rate, and collection timing. Then recalculate inventory needs, supplier payments, and ending cash. Before approving more stock, check whether committed purchase orders still match expected demand.
Investigate Customer Loss and Test Retention Actions
When churn increases, review fulfillment delays, stockouts, product quality, pricing, returns, support, and post-purchase messages. Give each affected cohort a clear owner: operations handles delivery issues, merchandising handles quality concerns, and support handles unresolved tickets.
Where possible, test changes against a control group using the same customer definitions and observation windows. Judge discounts by incremental contribution profit, not repeat orders alone. Account for campaign costs, discounts, returns, shipping, and support costs when calculating that margin.
Before using the forecast for cash planning, check it against accounting records.
Reconcile Customer Data With Accounting Records
Each month, reconcile sales, refunds, discounts, product costs, and inventory with accounting records. Separate platform settlements into sales, fees, refunds, reserves, and adjustments before matching them to bank deposits - a net payout is not revenue.
Review entity-level results before consolidating totals so one business's profits don't hide another's cash pressure.
Conclusion: Review Churn, Retention, and Profitability Together
Once the rules are set, use the metrics to assess performance - not just activity. Churn measures customer loss; retention measures continued activity. Compare them only when they use the same cohort, time window, and customer rules.
Maintain one written metric dictionary that defines qualifying orders, refunds, reactivations, and cancellations. Use those definitions consistently in every report.
Turn the metrics into decisions by reviewing churn and retention alongside revenue and margin. Judge retention by incremental profit, not order count.
Review cohorts monthly and financial results quarterly. Give each variance an owner, then check the outcome at the next review. Use what you learn to adjust budgets, inventory, and retention work.
FAQs
How do I account for seasonal buying patterns?
Track monthly and annual churn to spot recurring trends. Seasonal revenue spikes don’t always mean growth will last. Use cohort analysis to group customers by signup period and separate seasonal swings from long-term retention health.
Lucid Financials combines bookkeeping, tax services, tax credits, and CFO support to help you keep a clear view of your finances through seasonal shifts.
How much data do I need to spot churn trends?
Focus on your customer lifecycle, not a fixed amount of data. For consumer goods startups, begin with a 30-day window to spot early attrition. Extend it to 60 or 90 days to better understand long-term loyalty.
Track repeat-purchase probability by the number of months since a customer’s last order. Pair these lagging churn metrics with leading indicators, such as product usage frequency or engagement, to anticipate trends.
Which customers should I target with retention offers?
Prioritize customers based on value and churn risk. Use RFM (Recency, Frequency, Monetary) analysis to find your top 20% and target them with exclusive VIP campaigns. Use predictive Customer Lifetime Value (CLV) models to spot at-risk customers and trigger win-back campaigns before they churn.
Focus on high-value segments where better retention brings the most profit. Keeping customers costs much less than acquiring new ones.