SaaS and e-commerce startups require different KPIs to measure success. While SaaS relies on recurring revenue, e-commerce focuses on transactional sales. This difference impacts how retention, growth, and profitability are evaluated. For SaaS, metrics like Monthly Recurring Revenue (MRR), Net Revenue Retention (NRR), and churn are critical. In contrast, e-commerce prioritizes contribution margin, Return on Ad Spend (ROAS), and repeat purchase rates.
Key insights:
- SaaS: Predictable revenue streams, with NRR above 100% signaling growth without new customers.
- E-commerce: Seasonal revenue spikes and faster CAC payback (ideally under 3 months).
- Both models benefit from tracking LTV:CAC ratios (target 3:1) and maintaining financial clarity for investors.
Quick Comparison
| Metric | SaaS | E-commerce | Investor Focus |
|---|---|---|---|
| Revenue Model | Subscription-based (MRR/ARR) | Transactional (GMV/Sales) | Predictability vs. volume |
| Retention Metric | Net Revenue Retention (NRR) | Repeat Purchase Rate | Growth through retention |
| CAC Payback | 6–12 months | Under 3 months | Speed of capital recovery |
| Profitability | High gross margins (70–90%) | Contribution margin (30–40%) | Unit-level profitability |
Understanding these metrics ensures startups focus on what matters most, helping them scale effectively and attract investors.
KPIs and Metrics for eCommerce | Evaluate Your eComm Performance
sbb-itb-17e8ec9
KPI Fundamentals Common to Both SaaS and E-Commerce Startups
Before diving into the differences between these sectors, startups need to establish a consistent financial foundation. This means focusing on core metrics that allow investors to compare performance across industries without bias.
Revenue Metrics and Unit Economics
A critical shared metric is the contribution margin - calculated as revenue minus the cost of goods sold (COGS) and variable costs like shipping and payment processing. This metric shows whether additional revenue translates into profit. It's possible for a company to boast impressive top-line growth while its contribution margin deteriorates, a red flag that savvy investors are quick to spot.
Other universal metrics include Customer Acquisition Cost (CAC) and Customer Lifetime Value (CLV). To ensure accuracy, CAC should encompass all marketing expenses, not just media spend. Similarly, CLV should be calculated using contribution margin to avoid inflated projections. A 3:1 LTV to CAC ratio is a widely accepted benchmark for healthy and scalable unit economics across both SaaS and e-commerce models.
Both types of startups also need to define a North Star Metric (NSM) - a single figure that reflects genuine customer value and ties directly to revenue. For SaaS businesses, this might be weekly active users, while for e-commerce, it could be weekly unique purchasing customers. This metric keeps teams focused and provides investors with a clear indicator of meaningful growth rather than vanity metrics.
Cash Flow and Runway Tracking
Burn rate and runway are non-negotiable metrics for both sectors. These figures help investors assess whether a startup is "default alive" - able to achieve profitability without additional funding - or "default dead", where survival hinges on securing the next round of investment.
The CAC payback period is a metric that applies to both sectors but varies in expectations. In e-commerce, recovering CAC within 3 months is ideal, while 6–12 months signals caution. For SaaS, a 12-month payback is often acceptable. A longer payback period ties up working capital, limiting flexibility and extending the time needed to recover acquisition costs. Another shared benchmark is the Rule of 40, which combines revenue growth rate and profit margin to ensure the total is at least 40%. This metric helps gauge whether a startup is balancing growth with efficiency.
Data Consistency and AI-Driven Platforms
Reliable data is the backbone of accurate metrics. By 2026, privacy restrictions and the decline of third-party cookies could cause discrepancies of over 30% between reported analytics and actual sales data. This makes tools like server-side tracking and integrated financial systems indispensable.
Platforms like Lucid Financials address this challenge by consolidating bookkeeping, billing, and accounting data into a single system. This integration provides real-time updates on key metrics like contribution margin, CAC payback, and cash runway, eliminating delays from month-end reporting. These tools ensure startups and investors have a clear, up-to-date picture of financial health.
"A KPI you cannot measure is not a KPI." - C.E. Aksan
KPI Tracking for SaaS Startups
SaaS companies thrive on subscription-based revenue, creating a steady stream of income. This model shapes the key performance indicators (KPIs) that investors prioritize. By relying on strong data systems, these KPIs are monitored daily through integrated tools. Let’s break down the essential KPIs that define success for SaaS businesses.
Core SaaS KPIs
At the heart of SaaS reporting are Monthly Recurring Revenue (MRR) and Annual Recurring Revenue (ARR). MRR is used for day-to-day decision-making, while ARR provides a broader benchmark for investors.
"If you are using ARR to make monthly decisions, you are looking at the wrong number. If you are pitching investors with MRR, you are making yourself harder to benchmark." - The SaaS Library
Beyond MRR, Net Revenue Retention (NRR) and Gross Revenue Retention (GRR) are critical indicators of business health. NRR captures the impact of expansion revenue, churn, and downgrades from existing customers, while GRR focuses solely on revenue losses. A company with an NRR above 100% is growing from its current customer base alone, without needing new customers.
| Metric | Formula | Good | Best-in-Class |
|---|---|---|---|
| NRR | (Start ARR + Expansion - Churn - Contraction) / Start ARR | 100–110% | 130%+ |
| Gross Revenue Retention | (Start ARR - Churn - Contraction) / Start ARR | 90%+ | 95%+ |
| LTV:CAC Ratio | Gross-Margin LTV / Full CAC | 3:1 | 5:1+ |
| CAC Payback | CAC / (ARPA × Gross Margin) | 12–15 mo. | < 12 mo. |
| Rule of 40 | YoY Growth Rate + EBITDA Margin | 40+ | 60+ |
Source: Composite data from ChartMogul, Benchmarkit, and Bessemer (2025–2026).
Churn is another crucial factor, with the average monthly rate hovering around 3.5%. This includes 2.6% from voluntary cancellations and 0.8% due to failed payments. Notably, failed credit card payments account for 23% of all churn in SaaS businesses. Automated dunning tools can help reduce this preventable issue.
How Investors Read SaaS KPIs
Investors don’t just focus on growth - they evaluate the quality of that growth. Companies that scale MRR through expansion within their existing customer base are seen as more sustainable than those relying solely on new customer acquisition. For SaaS companies in the $15–30M ARR range, approximately 40% of growth comes from expansion MRR.
Among all metrics, NRR is the one investors analyze most closely. Companies with NRR above 100% grow nearly twice as fast as those below that benchmark - 48% year-over-year compared to the broader average. The Rule of 40 has become a key benchmark for Series B and later-stage funding. Currently, only 11–30% of SaaS companies meet this threshold. For AI-focused SaaS companies with gross margins exceeding 80%, a stricter "Rule of 60" is emerging.
"Mastering your SaaS KPIs is not optional - it's the difference between fundraising with leverage and scrambling to explain churn to investors." - Josh Sturgeon, EmberTribe
A practical tip for founders: always calculate LTV using gross margin, not total revenue. Using revenue-only LTV inflates customer value by 20–30% and won’t hold up during investor due diligence. The correct formula is:
LTV = (ARPA × Gross Margin %) / Churn Rate
Tracking Tools and Reporting Cadence
SaaS startups typically track MRR and churn on a monthly basis using platforms like Stripe or Chargebee, which offer real-time dashboards. A weekly review of MRR changes - broken down into New, Expansion, Contraction, and Churned MRR - can help spot early signs of churn before it becomes a larger issue.
Lucid Financials simplifies this process by integrating bookkeeping, billing, and accounting into one platform. This ensures metrics like CAC payback, NRR, and gross margin are always up-to-date. For startups looking to fundraise, having real-time access to these numbers isn’t just helpful - it’s a competitive edge.
KPI Tracking for E-Commerce Startups
E-commerce startups operate on a transactional revenue model, where each sale stands as an individual event. Because of this, tracking the right metrics is critical to understanding performance and ensuring long-term profitability. While the SaaS KPI framework provides a foundation, e-commerce businesses need specific metrics tailored to their unique dynamics.
Core E-Commerce KPIs
E-commerce success relies on what can be called a "profitability stack" of key metrics. At the top is ROAS (Return on Ad Spend), which evaluates how efficiently marketing dollars translate into revenue. Next is AOV (Average Order Value), which highlights the revenue generated per transaction. Beneath that is Contribution Margin, which shows what's left after factoring in costs like COGS (Cost of Goods Sold), shipping, and returns. For startups, CAC Payback (Customer Acquisition Cost Payback) should ideally stay under three months to maintain efficient use of capital. Finally, LTV:CAC (Lifetime Value to Customer Acquisition Cost) serves as a critical indicator of sustainability, with a healthy ratio ensuring long-term viability.
However, focusing too much on ROAS can be misleading.
"ROAS alone is dangerous: a 4.5x ROAS campaign can yield just 7.8% effective margin after all costs." - Luca AI
Operational KPIs like cart abandonment and conversion rates also play a major role. For example, cart abandonment rates average 70.22% globally and rise to 79.61% on mobile devices. This is especially concerning given that mobile traffic makes up over 72% of e-commerce visits but converts at just 2.1%, compared to 3.5% on desktop. These inefficiencies can significantly eat into margins.
While these metrics help measure operational performance, investors are more focused on how efficiently and sustainably a business can grow.
How Investors Read E-Commerce KPIs
Investors aren’t just looking for growth - they want efficient growth. A business showing rising revenue but shrinking contribution margins raises alarms rather than confidence.
"Revenue growth hides business health... Rising revenue with deteriorating margins means you're selling more while making less." - Danielle Voorhees, Growth Engineer, The Decision Loop
When it comes to unit economics, investors often use an LTV:CAC ratio of at least 3:1 as a benchmark for scalability. For DTC (Direct-to-Consumer) brands, a CAC Payback period under three months signals strong capital efficiency and readiness for aggressive scaling. If this period stretches beyond 12 months, it’s usually a sign of unsustainability without ongoing external funding.
Additionally, investors are increasingly wary of platform-reported ROAS metrics. Instead, they prefer ncROAS (New Customer ROAS), which excludes retargeting data to focus solely on acquisition efficiency.
Another metric under scrutiny is Inventory Turnover, as slow-moving inventory ties up cash and increases the risk of write-offs.
"Inventory turn is a core metric that directly impacts cash conversion cycles and reduces the risk of obsolete inventory write-offs." - Ascent CFO Solutions
Tracking Tools and Reporting Cadence
To effectively monitor these KPIs, tools like Shopify Analytics are invaluable for tracking daily sales, customer retention, and product performance. Google Analytics 4 complements this by providing insights into cross-channel traffic and user behavior throughout the sales funnel.
Equally important is how often these metrics are reviewed. Daily checks should focus on traffic, conversion rates, and ad performance. Weekly reviews are better suited for AOV, CAC, and fulfillment metrics. More in-depth metrics like contribution margin, LTV, and inventory turnover should be analyzed monthly. This structured cadence helps founders avoid overreacting to daily fluctuations while still catching meaningful trends early.
For startups preparing to pitch to investors, tools like Lucid Financials can help integrate operational data with financial reporting. This ensures that key metrics like contribution margin and CAC payback are tied directly to accurate financial records - a crucial step for building credibility in fundraising discussions.
SaaS vs. E-Commerce KPIs: A Direct Comparison
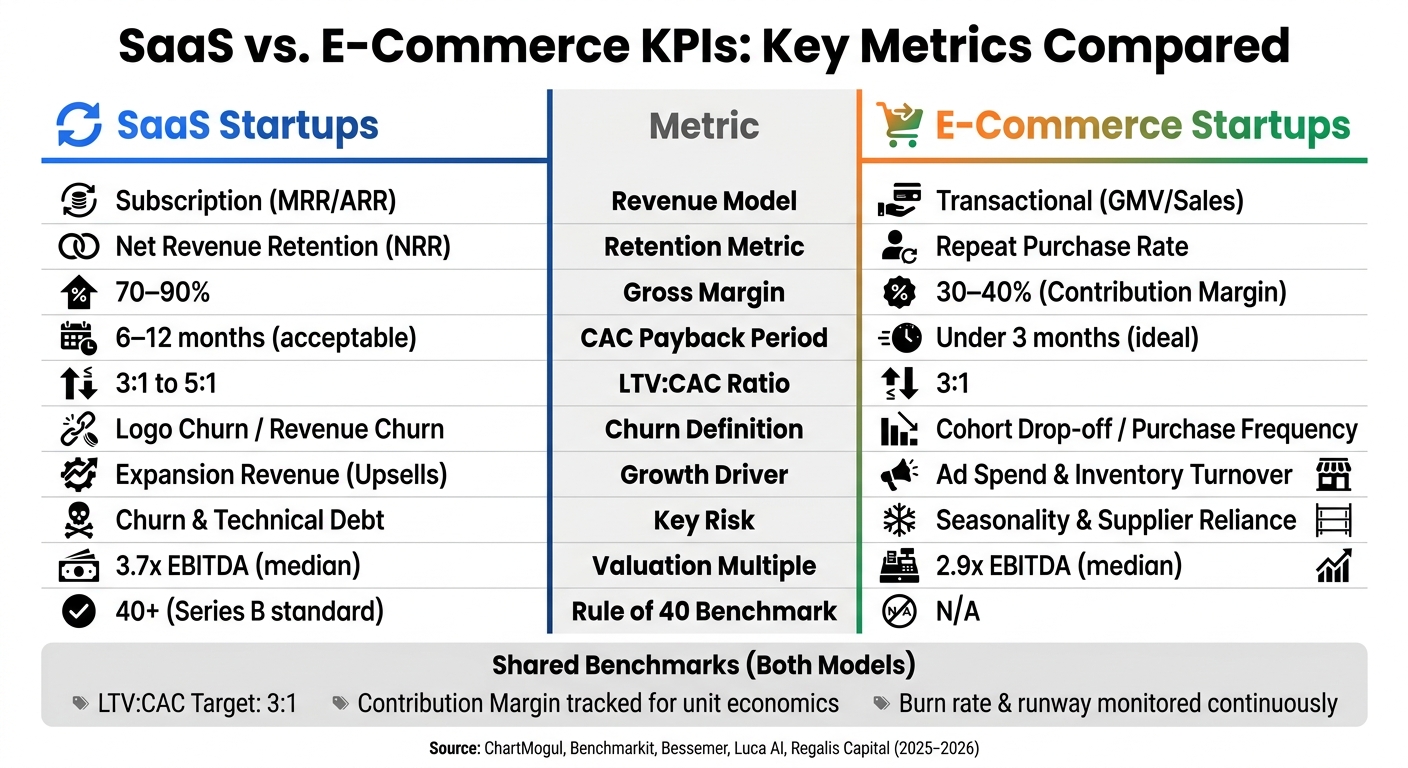
SaaS vs. E-Commerce KPIs: Key Metrics Compared
This section builds on earlier discussions by diving into how sector-specific KPIs reflect the unique priorities of investors in SaaS and e-commerce businesses. The core difference isn't just what is measured but why. SaaS investors are drawn to revenue predictability and growth potential, while e-commerce investors focus on profitability at the unit level and fast recovery of customer acquisition costs. As of Q1 2026, SaaS companies trade at a median of 3.7x EBITDA, compared to 2.9x EBITDA for e-commerce businesses. This valuation gap stems largely from SaaS's recurring revenue model.
Comparison Table: Core KPI Metrics
The table below highlights how specific metrics guide investor decisions in SaaS and e-commerce models.
| Metric | SaaS | E-Commerce | What It Signals to Investors |
|---|---|---|---|
| Primary Revenue Metric | MRR / ARR | GMV / Total Sales | Stability and predictability vs. transaction volume |
| Retention Metric | Net Revenue Retention (NRR) | Repeat Purchase Rate | Growth through retention vs. customer loyalty |
| Churn Definition | Logo Churn vs. Revenue Churn | Cohort drop-off / purchase frequency | Customer loss vs. revenue loss |
| Growth Driver | Expansion revenue (upsells) | Ad spend & inventory turnover | Internal growth vs. spending-driven growth |
| Critical Risk | Churn & technical debt | Seasonality & supplier reliance | Internal stability vs. external vulnerabilities |
"A SaaS business with a net revenue retention rate above 100% is actually growing without acquiring a single new customer." - Regalis Capital
For SaaS, churn directly affects recurring revenue, while e-commerce relies heavily on Repeat Purchase Rate, often analyzed through cohort tracking.
Comparison Table: Unit Economics
The following table compares unit economics, offering a snapshot of how profitability differs between SaaS and e-commerce models.
| Metric | E-Commerce (DTC) Target | SaaS Target | Investor Signal |
|---|---|---|---|
| CAC Payback | < 3 months (ideal) | 6–12 months (acceptable) | Speed of capital recovery |
| LTV:CAC Ratio | 3:1 | 3:1 to 5:1 | Efficiency of growth investments |
| Contribution Margin | 30–40% | 70–90% (gross margin) | Profitability at the unit level |
| Magic Number | N/A | 0.75+ | Sales and marketing efficiency |
The differences in CAC payback are striking. E-commerce businesses must recover acquisition costs quickly due to lower margins and added expenses like inventory and shipping. In contrast, SaaS companies, with their recurring revenue and high gross margins, can afford longer payback periods - up to 12 months.
Comparison Table: Tracking Cadence
| Frequency | E-Commerce Focus | SaaS Focus |
|---|---|---|
| Daily | Ad spend pacing, conversion rate | Sign-ups, system uptime |
| Weekly | CAC trends, inventory alerts, AOV | Active users (WAU), feature engagement |
| Monthly | Contribution margin, repeat purchase rate | MRR growth, churn rate, NRR |
| Quarterly | LTV:CAC by channel, inventory turns | Rule of 40, burn multiple, LTV:CAC by cohort |
These tracking cadences reflect the operating rhythms of each model. E-commerce businesses deal with daily fluctuations due to ad performance and inventory dynamics, which can quickly impact margins. SaaS metrics, on the other hand, evolve more gradually. For instance, tracking MRR weekly often creates unnecessary noise, while monthly reviews provide more actionable insights. These differences highlight how each business model aligns with distinct investor priorities, guiding the creation of KPI dashboards tailored to their needs.
Building Investor-Ready KPI Dashboards
Once you've identified the right sector-specific KPIs, the next step is presenting them effectively through dashboards designed with investors in mind.
A KPI dashboard does more than just report numbers - it plays a key role in earning investor confidence. By presenting sector-specific data clearly and concisely, you save investors from sifting through endless spreadsheets. This approach builds on the earlier KPI comparisons, ensuring the data is not only accurate but also accessible for critical decision-making.
Designing KPI Views for Mixed-Sector Portfolios
The most impactful dashboards follow a three-layer structure:
- Executive Layer: This top-level view focuses on your North Star Metric (NSM), along with key metrics like MRR (Monthly Recurring Revenue), GMV (Gross Merchandise Value), churn, and NRR (Net Revenue Retention). These are typically reviewed weekly or monthly by founders and investors.
- Channel/Segment Layer: This middle layer dives deeper, breaking down metrics like CAC (Customer Acquisition Cost) by channel and retention rates by customer cohort. These insights help guide resource allocation and strategic adjustments.
- Diagnostic Layer: At the base level, this layer tracks daily operational metrics like funnel conversions and error rates, offering a granular view of performance.
For SaaS startups, the NSM often revolves around metrics like weekly active users or weekly value delivered. For e-commerce startups, it might be weekly unique purchasing customers. Keeping these metrics separate within a shared dashboard ensures clarity and avoids confusion.
To add depth, pair lagging metrics (like churn) with leading indicators (such as product usage frequency). This combination provides a forward-looking perspective, helping investors and founders anticipate trends rather than just reacting to them.
Automating Data Ingestion and Anomaly Detection
Manually updating data is not only time-consuming but also erodes investor trust. Instead, integrate systems like advertising platforms, web analytics, ERP tools, and accounting software to eliminate data silos. This is especially critical for e-commerce startups, where real-time data is essential to keep up with rapid market changes.
Automated alerts are another must-have. These alerts immediately flag issues when KPIs deviate from expected ranges. Vikas Gautam, Principal Product Manager at ThoughtSpot, explains it best:
"SaaS metrics replace assumptions with clarity. They show you which parts of your business are working, which aren't, and where to focus next."
The move from outdated, static spreadsheets to real-time dashboards - like Liveboards that provide AI-generated context for sudden KPI shifts - is now a baseline expectation for startups aiming to attract investors.
These automated tools ensure your dashboard stays up-to-date, empowering quick and informed decisions.
How Lucid Financials Supports Investor-Ready Reporting

For startups without a dedicated finance team, keeping dashboards investor-ready can be a tall order. That’s where Lucid Financials steps in. By consolidating operational and financial metrics, Lucid bridges the gap between day-to-day performance tracking and the polished reporting investors expect.
Lucid Financials offers real-time monitoring and integrates directly with Slack. Founders can check their runway, burn rate, or spending by simply asking Lucid’s AI in Slack. If deeper insights are needed, expert support is just a message away.
With clean financial records delivered in just seven days and investor-grade reports available on demand, Lucid ensures startups are always prepared for due diligence, no matter their stage of growth. This level of preparedness can make all the difference when it comes to securing investor trust.
Conclusion: Picking the Right KPI Strategy for Your Startup
Choosing the right KPIs is crucial for steering your startup in the right direction. Your business model should dictate which metrics matter most. For SaaS startups, recurring revenue is the lifeblood, making metrics like MRR growth, NRR, and churn rate essential. On the other hand, e-commerce startups thrive on transaction volume and profit margins, so contribution margin, CAC payback, and repeat purchase rates are the key numbers investors care about. Focusing on the right metrics can help you avoid costly mistakes.
A common pitfall for founders is using the wrong framework for their business model. For instance, an e-commerce brand that prioritizes ROAS without factoring in contribution margin could be in trouble. A campaign with a 4.5x ROAS might look great on the surface but could leave you with an effective margin of just 7.8% once you account for COGS, shipping, and returns. This highlights how top-line metrics can sometimes hide underlying inefficiencies. Similarly, SaaS founders who focus solely on revenue growth without monitoring NRR might overlook a churn problem that could quietly undermine their business.
The good news? Building a KPI strategy doesn't have to be overly complex. Align your metrics with your company’s growth stage and pair lagging indicators with leading ones. This approach helps you anticipate challenges before they escalate, ensuring your strategy stays aligned with the growth priorities discussed earlier in this article.
"The difference between scaling sustainably and burning through runway lies in choosing the right performance indicators." - Ascent CFO
A well-thought-out KPI strategy not only drives growth but also strengthens investor confidence. For founders juggling operations without a dedicated finance team, keeping investor-grade reports up to date can feel overwhelming. That’s where Lucid Financials steps in. It combines AI-powered bookkeeping, real-time financial insights, and CFO-level support to consolidate your financial data into one platform. Whether you're a SaaS startup monitoring NRR or an e-commerce brand managing inventory turnover, Lucid ensures your books are clean in just seven days, with board-ready reports available anytime. It’s a game-changer for staying investor-ready while focusing on scaling your business.
FAQs
How do I pick the right North Star Metric for my startup?
To steer your business effectively, focus on a single, high-level KPI that captures your core value and aligns with your growth objectives. For SaaS companies, metrics like net revenue retention or the LTV:CAC ratio are often the go-to choices. On the other hand, e-commerce businesses might zero in on contribution margin or conversion rate.
The key is to choose a metric that checks three boxes: it should be actionable, easy to explain, and a reliable predictor of success. This clarity not only sharpens your strategy but also keeps your team aligned and motivated.
What’s the best way to calculate LTV without overstating it?
To get an accurate Customer Lifetime Value (LTV), you need to go beyond basic calculations. Use formulas that factor in key metrics like average order value, purchase frequency, retention rate, and profit margins. Don’t forget to include costs and churn rates to get a clear picture.
For a deeper analysis, consider using cohort-based or predictive models, which can provide insights into customer behavior over time. Also, make it a habit to update your calculations regularly with actual customer data. This helps you stay aligned with changing retention patterns and gives you a more realistic understanding of your customers' long-term value.
How can I build an investor-ready KPI dashboard with consistent data?
To build a KPI dashboard that impresses investors and ensures reliable data, follow these steps:
- Pinpoint the right KPIs: Choose metrics that align with your industry. For example, SaaS companies might focus on Monthly Recurring Revenue (MRR), while e-commerce businesses may prioritize conversion rates.
- Connect your data sources: Integrate all relevant systems to maintain data accuracy and consistency across the board.
- Automate your reporting: Streamline the process to reduce manual errors and save time.
Make it a habit to review and refine your metrics regularly. This helps you identify trends early and keep your dashboard clear and organized. Using standardized formats ensures your dashboard aligns with what investors expect and supports smart decision-making.