Why it matters: Financial reports can be overwhelming. Visual storytelling transforms raw data into clear, engaging visuals like graphs and dashboards. This method simplifies complex information, making it accessible for investors, board members, and teams.
How it helps startups: Startups benefit from real-time insights into key metrics like burn rate and runway. Automated tools allow instant reporting, helping founders make fast decisions and build trust with stakeholders.
AI's role: AI platforms streamline financial reporting by automating data collection, generating visuals, and creating narratives. Features like Slack integration provide instant updates, while scenario modeling prepares businesses for various outcomes.
Key principles:
- Present data with clarity and context (e.g., compare actual vs. projected figures).
- Use effective visuals like bar charts for comparisons and line graphs for trends.
- Combine visuals with concise narratives for impact.
Tools to know: Platforms like Lucid Financials integrate bookkeeping, tax services, and CFO support, offering real-time dashboards, predictive analytics, and secure reporting.
Takeaway: Visual storytelling and AI-driven tools modernize financial reporting, offering startups a competitive edge while saving time and reducing errors.
Core Principles of Effective Visual Financial Reports
Presenting Data with Clarity and Context
Financial data without context is just a collection of numbers. To truly convey meaning, you need to frame your data in a way that highlights comparisons and provides stakeholders with a clear understanding of what the numbers represent for your business.
One effective approach is using scenario-based presentations. For instance, show best-case, worst-case, and actual outcomes. This method paints a more complete picture than isolated figures. If your Q3 burn rate is $45,000 per month, compare it to your projected $50,000 and explain what that means for your 18-month runway. These comparisons make the data relevant and actionable.
Another way to add depth is by referencing industry benchmarks. Take customer acquisition cost (CAC) as an example: $120 might seem high until you compare it to the $150 average for similar SaaS companies. Platforms like Lucid Financials simplify this by integrating benchmarks directly into your reports, making it easier to position your metrics against industry standards.
Real-time insights into critical metrics, like burn rate and runway, allow for immediate analysis and decision-making. This is especially valuable during board meetings or investor calls when quick, data-backed responses are crucial.
Trend analysis is another essential element of effective reporting. A single month’s revenue figure doesn’t tell the whole story, but showing growth from $25,000 in January to $67,000 in June reveals a clear pattern. Use tools like trend lines and growth curves to make these changes visually obvious and easy to interpret.
Once you’ve established clarity and context, the next step is to focus on the design elements that turn raw numbers into meaningful insights.
Best Practices for Visual Elements
Visual tools like charts and graphs can make even the most complex financial data easier to digest - if they’re designed thoughtfully. Stick to U.S. formatting standards to ensure your reports resonate with stakeholders. Use dollar signs and proper comma separators (e.g., $1,234.56), display dates in MM/DD/YYYY format, and show percentages with standard decimal notation (e.g., 15.3%).
Color schemes are critical for guiding interpretation. Use green for positive trends like revenue growth, red for negative metrics such as rising burn rates, and neutral colors like blue or gray for baseline data. Consistency in color use across reports helps stakeholders quickly understand the visuals without confusion.
Different types of charts serve different purposes:
- Bar charts are ideal for comparing categories, such as monthly revenue or departmental expenses.
- Line graphs work best for tracking trends over time, like cash flow or customer growth.
- Pie charts should only be used to show parts of a whole, and only when there are fewer than six categories - too many slices make them hard to read.
Interactive dashboards are quickly becoming the standard for financial reporting. Unlike static PDFs, these dashboards allow users to click on specific data points for more detail. For example, a board member could click on Q2 revenue to see a breakdown by product line or region, eliminating the need for additional reports.
Tables still have their place, especially when precision is essential. Use them for financial statements, detailed expense breakdowns, or any data that stakeholders might need for their own calculations. However, pair these tables with visual summaries to emphasize key takeaways.
While visuals simplify complex data, the real impact comes from integrating them with a compelling narrative.
Balancing Visuals with Narrative
Strong visuals are only part of the equation. To make your financial reports truly impactful, combine them with a clear, engaging narrative that guides stakeholders through the story behind the numbers.
Start by structuring your report in a way that aligns with how stakeholders think. Begin with high-level performance metrics, move into operational details, and wrap up with forward-looking projections. Every visual should reinforce a specific point in your story, not just exist as decoration.
An executive summary at the start of your report sets the stage for everything that follows. For example, stating, "Q3 revenue exceeded projections by 23%, driven primarily by enterprise client acquisitions", provides a clear narrative framework. The charts and graphs that follow then serve as evidence to support that statement.
AI-powered tools like Lucid Financials make it easier to balance visuals and narrative. These platforms can automatically generate insights alongside your visuals, identifying key trends and anomalies and explaining their significance for your business. This eliminates the need to manually write explanations for every chart, saving time while improving clarity.
Here’s a quick comparison of traditional reporting versus modern, AI-enhanced methods:
| Traditional Reporting | AI-Enhanced Visual Reporting |
|---|---|
| Static tables and basic charts | Dynamic, interactive dashboards |
| Manual narrative creation | Automated insight generation |
| Days or weeks for updates | Real-time data and visualization |
| Limited scenario modeling | Instant best/worst case comparisons |
| Siloed data sources | Integrated financial ecosystem |
Customization is another key feature of effective reporting. Different stakeholders have different priorities. Board members might focus on high-level strategic insights, while department heads need operational details. Modern reporting platforms let you tailor narratives for each audience, all while using the same underlying data.
Finally, real-time notifications are pushing the boundaries of how visuals and narratives work together. Instead of waiting for scheduled reports, stakeholders can receive immediate updates via tools like Slack. These notifications include contextual visuals and concise narratives, keeping everyone informed and aligned without delay.
Strategic Financial Reporting in PowerBI: Automate, Visualize, Act
Using AI for Better Financial Storytelling
AI is reshaping how startups and growing companies approach financial reporting. Gone are the days of tedious manual data collection and static reports. Today, AI-powered platforms automate these processes, uncover insights in minutes that would take hours for human analysts, and present financial stories in a way that's easier to understand and act on.
Automating Financial Data Collection and Visualization
One of the biggest challenges in financial reporting has always been manual data collection. Teams often spend days pulling information from multiple systems and reconciling it. AI changes the game by seamlessly connecting to banking, payroll, accounting, and other financial systems to automate this process.
Take Lucid Financials, for example. This platform integrates directly with various data sources to deliver clean, reconciled books in just seven days. It also detects anomalies and keeps your accounts accurate, eliminating the end-of-month panic many companies face.
Another key benefit? Real-time visualization. Instead of waiting for monthly reports, stakeholders can access dashboards that update in real time. Metrics like burn rate, revenue trends, and runway are always up-to-date, helping teams make faster, better-informed decisions. With Slack integration, financial insights are just a question away - like "What's our current runway?" or "How did we perform against budget this month?" - giving founders instant, actionable answers without disrupting their workflow.
AI also reduces errors. By flagging inconsistencies and unusual transactions, it prevents small mistakes from snowballing into larger issues. For example, if a transaction doesn't align with historical patterns, the system alerts your team right away.
Here’s a quick comparison of traditional versus AI-powered data collection:
| Traditional Data Collection | AI-Powered Collection |
|---|---|
| Manual input from multiple sources | Automated integration across platforms |
| Updates only weekly or monthly | Real-time data synchronization |
| High risk of human error | Automated validation and anomaly detection |
| Hours spent reconciling accounts | Instant reconciliation |
| Static, end-of-period reports | Dynamic, always-updated dashboards |
With automated processes and real-time visuals, AI doesn’t stop there - it also crafts compelling financial narratives.
Using AI for Narrative Generation
Writing financial summaries used to be a time-consuming task requiring expertise to interpret and explain the numbers. AI now handles this with ease, generating executive summaries, identifying key trends, and highlighting the metrics that matter most.
Platforms like Lucid Financials analyze your data and provide context-rich insights. For instance, if your burn rate is rising faster than expected, the platform not only flags the issue but also explains the contributing factors. These AI-generated narratives bridge the gap between raw numbers and actionable insights.
AI also creates investor-ready reports that go beyond basic summaries. These reports highlight achievements, explain discrepancies, and offer the context stakeholders need to understand your company’s financial health. Whether it’s a board meeting or an investor pitch, AI can tailor reports to suit different audiences, ensuring everyone gets the right level of detail.
Another advantage? Consistency. Unlike human-written reports, which can vary in quality, AI ensures every narrative is thorough and structured, covering all critical points.
But AI doesn’t just explain the past - it also helps predict the future.
Forward-Looking Insights with Predictive Analytics
For startups, forecasting isn’t just helpful - it’s essential. Traditional reporting focuses on past performance, but AI-powered predictive analytics look ahead, offering insights that drive smarter decisions.
With AI, scenario modeling becomes quick and seamless. Instead of spending hours building spreadsheets, you can generate best-case, worst-case, and most-likely scenarios in minutes. This is especially valuable for startups navigating uncertain markets or planning their next moves.
Lucid Financials users benefit from AI-generated forecasts that guide critical decisions, from hiring plans to fundraising strategies. Luka Mutinda, Founder and CEO of Dukapaq, shares:
"As we scaled, budgeting and cash flow became critical. Lucid's CFO services give us the visibility we need, while their bookkeeping and tax support keep everything accurate and stress-free. It's been a game-changer for our operations."
- Luka Mutinda, Founder and CEO, Dukapaq
AI also refines runway analysis by factoring in seasonal trends and predicting cash flow to help businesses avoid shortages. This level of insight lets founders pinpoint the best times to raise funds or expand their teams.
Moreover, AI enables detailed "what-if" scenario modeling. Teams can instantly evaluate the financial impact of strategic decisions, like hiring more staff or increasing marketing budgets. For fundraising, predictive analytics produce investor-ready plans that showcase not just current performance but also future potential, making a strong case for securing capital.
With these capabilities, financial reporting evolves from a routine task into a strategic tool that drives growth and supports smarter, faster decision-making.
sbb-itb-17e8ec9
Customizable Visual Reporting Tools and Techniques
Choosing the right visual reporting tools can completely change how your startup shares financial performance with stakeholders. With AI's ability to generate insights, these tools let you create financial visuals tailored to each audience. Today’s AI platforms offer features like adaptable dashboards, live updates, and flexible presentations designed to meet the needs of various stakeholders.
Real-Time Dashboards and Visualizations
Real-time dashboards simplify financial decision-making by delivering up-to-the-minute insights on critical metrics such as burn rate, runway, and cash flow. Unlike traditional monthly reports that quickly become outdated, these dashboards provide a live snapshot of your financial health, enabling founders to make informed decisions on the fly.
Take Lucid Financials as an example. This platform offers real-time financial insights that help startups manage cash flow, extend runway, and maintain growth. It can instantly generate financial plans for best-case, worst-case, and actual scenarios, giving teams the agility to adapt to changing market conditions or seize new opportunities.
In 2023, a manufacturing startup using Lucid Financials automated its monthly financial close process, saving 18 hours per month and reducing errors by 90%. By leveraging customizable dashboards, they visualized cash flow and spending trends, which led to a 15% improvement in budget accuracy.
These dashboards also provide instant access to industry benchmarks tailored to your product and market. This means you can quickly compare metrics like customer acquisition costs (CAC), valuation multiples, and competitor performance without hours of research. Real-time benchmarking not only helps identify areas for improvement but also validates your growth strategies.
When dealing with financial data, security is non-negotiable. Lucid Financials adheres to SOC 2 compliance standards, ensuring enterprise-grade protection for all the data displayed in reports and dashboards. Additionally, these real-time insights integrate seamlessly with tools like Slack, making financial updates even more accessible.
Slack Integration for Financial Insights
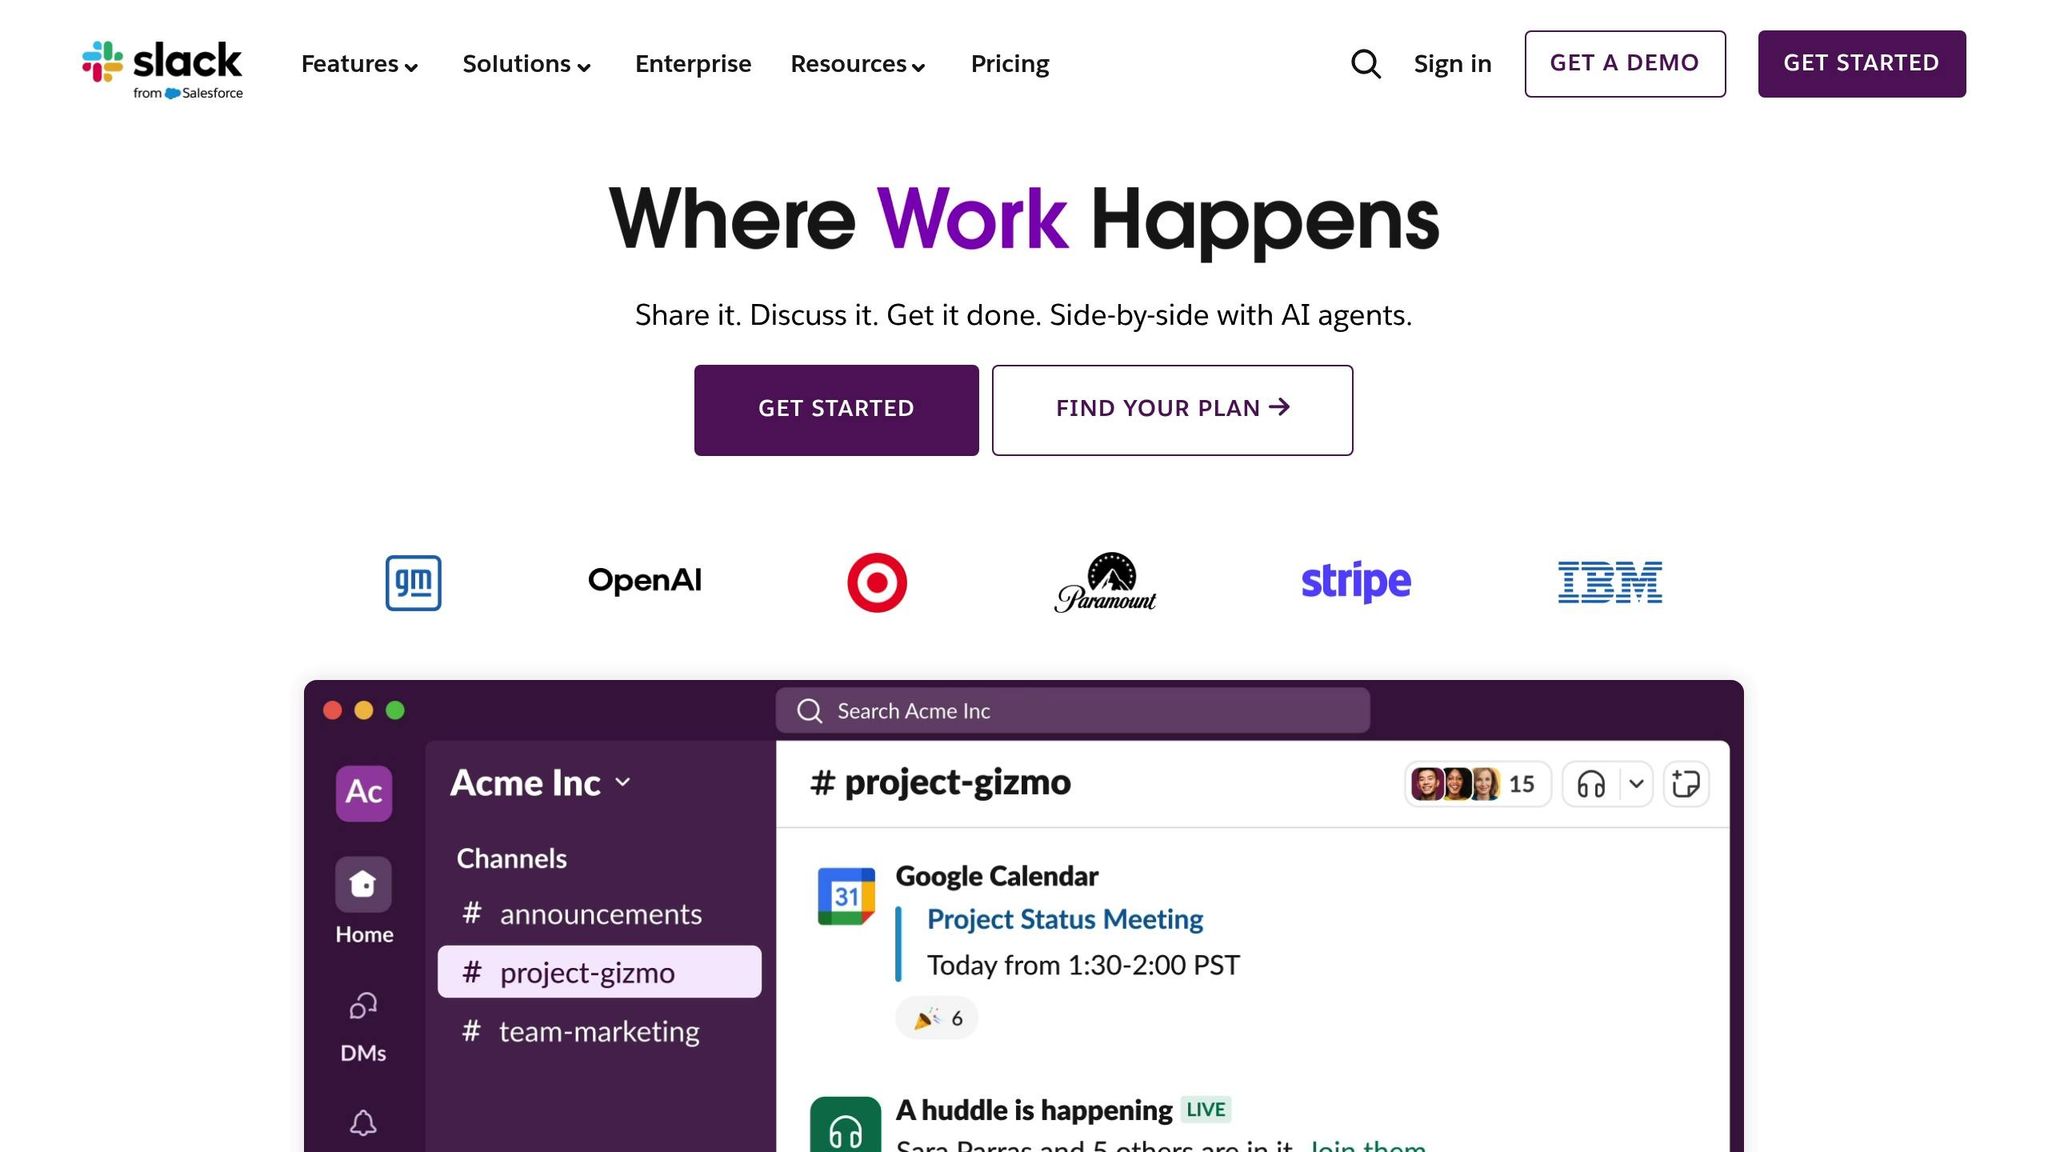
Slack integration brings financial insights directly into your daily workflow, making data accessible without disrupting your routine. Instead of switching between platforms, teams can get instant answers to financial questions.
Lucid Financials integrates smoothly with Slack, enabling founders to ask questions like, "What’s our current runway?" or "How did we perform against budget this month?" and receive immediate, actionable responses. This eliminates the need for context switching while ensuring financial data is always within reach during crucial decision-making moments.
The benefits go beyond convenience. Whether you're deciding on a new hire or evaluating a marketing investment, Slack integration allows you to access key financial metrics in real time. AI-powered responses clarify both numbers and trends, ensuring you stay informed.
Aviv Farhi, Founder and CEO of Showcase, shared how this has transformed their operations:
"Lucid turned our bookkeeping and taxes from a headache into a simple, reliable process. Their CFO insights give us clarity to plan growth with confidence - it feels like having a full finance team on demand."
This instant access proves especially valuable during fundraising. When investors request specific financial metrics at a moment’s notice, teams can quickly generate investor-ready reports and provide the detailed information needed for due diligence discussions. With Slack integration making data retrieval effortless, the next step is choosing the right visual formats to present your findings effectively.
When to Use Tables vs. Graphs
The choice between tables and graphs can make or break how stakeholders interpret your financial data. Tables are ideal for detailed comparisons and granular data, while graphs excel at showing trends, patterns, and changes over time. Picking the right format ensures your financial story is clear and impactful.
| Feature | Tables | Graphs |
|---|---|---|
| Best Use | Detailed comparisons, granular data | Highlighting trends, patterns, changes over time |
| U.S. Formatting | $1,234.56, MM/DD/YYYY | $1,234.56, MM/DD/YYYY |
| Readability | High for specifics | High for visualizing movement |
| Decision Support | Precise, supports audits | Fast, supports strategic review |
For instance, tables are perfect for presenting quarterly financial statements, detailed expense breakdowns, or comparative analyses over time. If you’re showing metrics like monthly recurring revenue (MRR) alongside customer acquisition costs and churn rates, a table allows stakeholders to dive into specifics and even calculate ratios.
On the other hand, graphs are better suited for illustrating revenue trends, burn rate changes, or seasonal patterns. A line graph showing monthly revenue growth over a year can instantly highlight momentum or pinpoint key inflection points that might be overlooked in a table.
Your audience also matters when deciding on visual formats. Graphs are great for board presentations where high-level trends need to be communicated quickly, while tables are better for investor due diligence, where precise figures are required. The most effective reports often combine both formats - using graphs to tell the story and tables to back it up with detailed data.
AI-powered tools like Lucid Financials can automatically recommend the best visualization format based on your data and use case. This ensures your reports are not only consistent but also tailored to meet the expectations of your audience.
Best Practices for Investor and Board Reporting in the U.S.
When it comes to reporting for U.S. investors and boards, the right approach can do more than just tick compliance boxes - it can strengthen trust and drive decision-making. Combining precise data with thoughtful storytelling is key to meeting the high standards of transparency and accuracy expected in these circles. The challenge lies in understanding what each group values most and presenting insights that resonate with their priorities.
Tailoring Reports for Different Stakeholders
Not all stakeholders are looking for the same thing. Investors, board members, and founders each have distinct focuses, and your reports should reflect that.
- For investors: Highlight growth metrics, capital deployment, and return potential. Scenario modeling is especially valuable here - offering best-case, worst-case, and realistic projections helps demonstrate how funds are being used and what milestones are within reach.
- For board members: Focus on strategic oversight and governance. This means including metrics like quarterly comparisons, cash flow forecasts, and budget variances. Adding industry benchmarks provides additional context, showing how your performance stacks up against the broader market.
- For founders: Provide operational insights they can act on immediately. Reports should include details like departmental spending, hiring runway calculations, and real-time budget alerts. These actionable insights help optimize resource allocation and growth strategies.
Lucid Financials offers a solution that caters to these varied needs. Its AI-powered platform generates customized reports for each stakeholder group, ensuring that the right insights are delivered to the right audience. But creating these reports is just the beginning - combining AI-driven insights with human expertise takes them to the next level.
Combining AI Insights with Expert Review
AI can process data at incredible speed, spotting patterns, modeling scenarios, and analyzing trends. But it’s not a substitute for the experience and judgment of seasoned finance professionals. The most effective reports come from blending automated insights with expert review.
Lucid Financials embodies this approach. Its AI generates detailed financial plans, including multiple scenarios, while a dedicated finance team reviews the outputs to ensure accuracy and compliance. This dual process ensures that the assumptions behind forecasts are sound and align with market realities. For example, Erez Lugashi, Founder and CEO of Abilisense, shared:
"Tracking finances used to be overwhelming. With Lucid handling bookkeeping, taxes, and CFO support in one place, everything is organized, automated, and easy to manage. It's given me real peace of mind."
This combination of automation and human oversight becomes especially critical during fundraising or due diligence. While AI can lay the groundwork by generating preliminary reports and isolating key metrics, experienced professionals refine the final presentation to meet investor expectations and address potential concerns head-on.
Maintaining Investor-Ready Financial Standards
To build confidence and ensure compliance, financial reports must adhere to consistent formatting, clear disclosures, and regulatory guidelines. For example, U.S. reports should format figures as $1,234.56 and use dates in MM/DD/YYYY format.
Transparency is non-negotiable. This means explaining significant variances, acknowledging risks, and providing all material information. Investors appreciate honesty and well-rounded context far more than overly rosy projections.
Security is another cornerstone. Platforms managing financial data must meet enterprise-grade requirements like SOC 2 compliance to protect sensitive information. Lucid Financials ensures these standards while offering real-time reporting capabilities. Features like burn rate tracking, runway projections, and key performance indicators keep investors informed with up-to-date data. Adding benchmarks - such as CAC ratios or growth rates - further enriches these reports, helping investors make well-informed decisions.
The Future of Visual Financial Storytelling
Visual financial storytelling is changing the way businesses communicate with stakeholders. By combining AI-driven insights with expert human input, it elevates financial reporting and supports business growth.
Key Takeaways for Startups and High-Growth Teams
For startups, financial reports are more than just a collection of numbers - they tell the story of a company’s past achievements and future potential. AI-powered tools significantly speed up financial management, allowing founders to focus on scaling their business while ensuring their reports are always ready for investors.
Using visual storytelling alongside tools like Slack creates an always-available financial intelligence system. This setup gives teams instant access to metrics like burn rate, runway, and budget variances, empowering them to make informed, data-driven decisions every day.
Security and compliance are critical, with U.S.-specific formatting (e.g., $1,234.56, MM/DD/YYYY) ensuring reports meet professional standards.
Cost-effectiveness is another major advantage. Plans start at just $50 per month for small teams, with more advanced options available for $150 per month. This pricing makes professional-grade financial storytelling accessible even for early-stage startups.
These innovations pave the way for a closer look at how Lucid Financials is driving this transformation.
The Role of Lucid Financials in Visual Financial Reporting
Lucid Financials stands out as a leader in merging AI-driven insights with human expertise, redefining financial reporting for startups and fast-growing companies. The platform addresses key needs by delivering clean books within seven days and providing continuous investor-ready reporting.
It combines bookkeeping, tax services, and CFO support into a single, integrated platform. This comprehensive approach ensures that visual reports are based on real-time data, offering stakeholders a complete and transparent financial overview.
The Slack integration takes financial data engagement to the next level. Instead of waiting for monthly updates, founders can access critical metrics and scenario modeling instantly. This allows for quicker decisions and more proactive cash flow management.
Looking ahead, the future of visual financial storytelling lies in platforms that seamlessly blend automation with human expertise. For U.S.-based startups navigating complex growth challenges, this combination provides a strong foundation for scaling effectively and securing funding.
FAQs
How does visual storytelling in financial reports help startups make better decisions?
Visual storytelling takes complex financial data and turns it into clear, engaging visuals that are much easier to understand. For startups, this means gaining faster insights into essential metrics like cash flow, revenue patterns, and budgeting, which leads to quicker and smarter decisions.
When data is presented visually, stakeholders can absorb critical information almost instantly. This not only minimizes the chances of misinterpretation but also saves valuable time. It allows founders and teams to stay informed about their financial health without getting bogged down in dense reports, keeping their focus where it matters most - on growth.
How does AI improve financial reporting and make it more accurate and efficient?
AI is reshaping financial reporting by taking over intricate tasks, minimizing mistakes, and delivering insights in real time. Tasks like budgeting, cash flow management, and forecasting become more streamlined, empowering businesses to make quicker, data-backed decisions.
With AI, financial reports are not only more accurate but also visually appealing, making it easier for stakeholders to grasp important metrics and trends at a glance. This blend of precision and efficiency allows businesses to save valuable time and concentrate on driving strategic growth.
How do real-time dashboards and Slack integration make financial data more accessible and useful for stakeholders?
Real-time dashboards paired with Slack integration simplify access to financial data, keeping stakeholders updated and enabling quicker decision-making. These tools deliver instant updates, so users can easily track spending, oversee cash flow, and analyze key metrics without any lag.
With a user-friendly design and smooth communication features, these integrations put crucial financial insights right at your fingertips. This empowers businesses to plan for growth and adapt to changes swiftly and efficiently.