Telecom companies face steep financial challenges due to high infrastructure costs and reliance on debt. Managing the cost of capital (WACC) is critical for ensuring profitability and shareholder value.
Key takeaways:
- WACC: A benchmark for investments; projects must exceed this to create value.
- Verizon’s WACC: 5.7% (2026).
- AT&T’s WACC: 6.0% (2026).
- Cost Components:
- Equity: Investor returns based on risk (e.g., Telus: 6.1% cost of equity).
- Debt: Lower due to tax benefits (e.g., Verizon: 4.55%; AT&T: 5.1%).
- Challenges: Heavy debt reliance (e.g., AT&T: $296B liabilities in 2022) and regulatory impacts on capital allocation.
Case studies:
- Telus Corporation: Uses WACC (5.1%) to evaluate investments.
- Teletech Corporation: Adopts segment-specific WACC for diverse business risks.
- WiMAX Projects: Tailored WACC critical for large-scale investments.
Regulations also shape WACC. For example, Germany’s telecom WACC dropped from 7.11% (2010) to 2.81% (2024), reflecting evolving market conditions.
Startups can learn to:
- Use segment-specific WACC for better capital allocation.
- Balance debt reduction with liquidity.
- Base calculations on market values for accuracy.
AI tools now simplify WACC analysis, offering real-time insights for better financial decisions.
Case Studies: How Telecom Companies Manage Cost of Capital
Telus Corporation: Using WACC for Investment Decisions
Telus Corporation applies Weighted Average Cost of Capital (WACC) as a strict benchmark for evaluating investments. For 2026, the company estimates its WACC at 5.1%, with a cost of equity at 6.1% and a cost of debt at 5.65%. This calculation is based on a 3.45% risk-free rate, a 5.6% market premium, and an adjusted beta of 0.43. To ensure accuracy, Telus relies on current market yields when determining the cost of debt.
The company emphasizes the importance of how funds are utilized, stating:
"The cost of capital is determined mostly by how the funds are used rather than where they were obtained from, as the risk associated with how funds are deployed drives investment decisions".
This approach ensures that every investment aligns with shareholder value creation.
Teletech Corporation: Different WACC for Different Business Segments

Teletech Corporation learned the hard way that using a single hurdle rate across diverse business segments can misallocate capital. The company operates two distinct units: Telecommunications Services and Product and Systems Manufacturing, each with unique risk profiles. Recognizing this, Teletech introduced segment-specific WACC calculations.
For its Telecommunications Services segment, Teletech calculated a hurdle rate of 8.64%, using a risk-free rate of 4.62%, a market risk premium of 5.5%, and a beta of 1.05. The pre-tax cost of debt for this segment was estimated at 5.79%.
Investor Yossarian, who owns a 10% stake, criticized the company for failing to optimize hurdle rates. In response, Teletech refined its approach by benchmarking, recalibrating betas, and factoring in segment-specific volatility. This shift highlights the necessity of tailoring WACC to reflect varying risks across business units.
While Telus focuses on consistent risk management through uniform WACC, Teletech's experience underscores the importance of customized approaches for different segments, especially when risk profiles vary significantly.
WiMAX Investment: Analyzing a $2.6 Billion Capital Decision
Large-scale projects like WiMAX deployments require even more detailed risk assessments. For a $2.6 billion WiMAX investment, telecom companies must rigorously evaluate WACC while considering factors such as technology adoption, competition, regulatory challenges, and the risk of obsolescence. If the expected returns fall below the WACC, the project risks eroding shareholder value.
Given the limited historical data for projects of this scale, companies often benchmark against industry peers and adjust betas to reflect a "pure play" risk profile. This approach avoids the pitfalls of applying a uniform corporate WACC. The WiMAX example highlights the critical role of project-specific WACC calculations in ensuring long-term value creation for shareholders.
sbb-itb-17e8ec9
Telecom Financial Model Crash Course with Excel Template - Revenue, Capex, Debt & IRR
How Regulations Affect Telecom Cost of Capital
Grasping how regulations shape the Weighted Average Cost of Capital (WACC) is key for understanding telecom investment strategies and their long-term financial outcomes. Regulatory bodies often play a direct role in setting the cost of capital for regulated services. In several European markets, government agencies establish WACC benchmarks, relying on standardized methodologies to guide capital planning alongside market conditions.
Swedish Mobile Networks: WACC and Regulatory Shifts
European telecom operators are navigating increased regulatory pressure under the European Commission's 2019 WACC Notice (2019/C 375/01). This framework standardizes how National Regulatory Authorities (NRAs) calculate the cost of capital for legacy copper infrastructure. A historical 5-year average of 10-year government bond yields is used to determine the risk-free rate. However, when inflation surged past 5% in 2022, some nominal post-tax regulatory WACCs dropped below 3%, effectively resulting in a negative real WACC.
Industry group Connect Europe (formerly ETNO) challenged this methodology, stating:
"A historic 5-year average, however, is strongly in contrast with the current expectation of increasing and much higher rates in the future".
Connect Europe also called on the European Commission, BEREC, and NRAs to reconsider this rigid approach, arguing for regulatory WACCs that ensure operators can achieve a reasonable return on investments.
Germany's regulatory framework offers another example of how countries attempt to balance these competing demands.
German Telecom Regulation: BNetzA's WACC Approach
In Germany, the Bundesnetzagentur (BNetzA) calculates the telecom WACC annually on June 30 using a Capital Asset Pricing Model (CAPM)-based methodology, expressed as a pre-tax real rate. To align national practices with EU standards, BNetzA introduced a "glide path" for gradual adjustments.
The evolution of regulated WACC rates in Germany highlights significant changes over time. For fixed networks, the WACC dropped from 7.11% in 2010 to a historic low of 2.16% in 2022. For mobile networks, the WACC decreased from 7.88% in 2010 to 4.42% in 2019. In 2023, the fixed-network rate increased slightly to 2.96% before settling at 2.81% by mid-2024.
| Reference Date | Fixed Network WACC (Pre-tax real rate) | Mobile Network WACC (Pre-tax real rate) |
|---|---|---|
| June 30, 2010 | 7.11% | 7.88% |
| June 30, 2015 | 5.90% | 6.02% |
| June 30, 2019 | 4.39% | 4.42% |
| June 30, 2022 | 2.16% | - |
| June 30, 2023 | 2.96% | - |
| June 30, 2024 | 2.81% | - |
BNetzA's methodology is grounded in academic research, incorporating risk-free rates and equity risk premiums. To support broadband expansion, the agency also commissioned the "Breitbandgutachten" study in 2010, which analyzed interest rates to account for the specific risks tied to high-speed infrastructure projects. While this method aims to balance regulatory stability with market needs, industry groups argue that the resulting rates may still fall short of encouraging substantial infrastructure investments.
WACC Comparison Across Case Studies
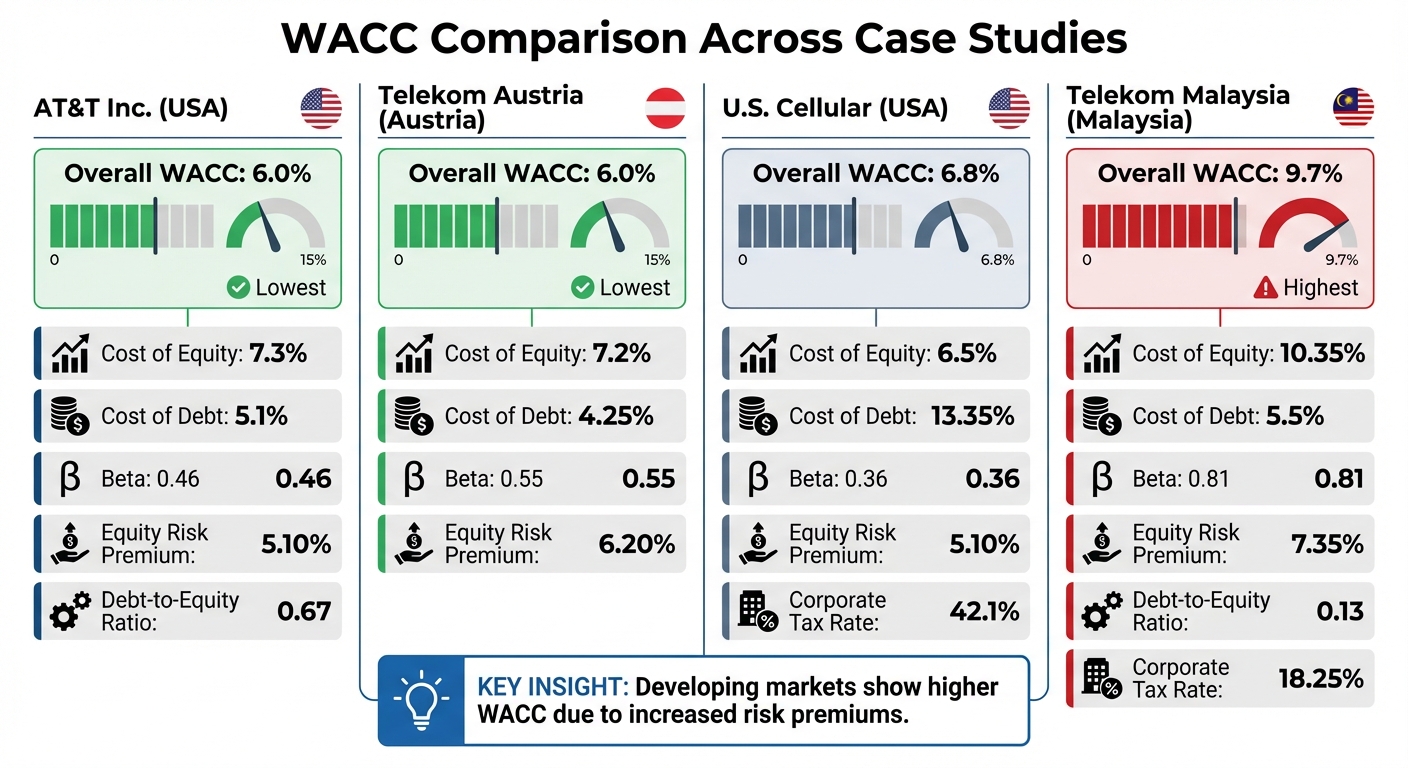
Telecom WACC Comparison: AT&T, Telekom Austria, U.S. Cellular, and Telekom Malaysia
Using detailed case analyses, we can see how WACC components differ across regions and companies, influenced by factors like regional risks, capital structures, and regulatory frameworks.
Take AT&T and Telekom Austria as examples. Both report a 6.0% WACC, but they arrive at this figure differently. AT&T incorporates a higher risk-free rate of 4.15% paired with a lower equity risk premium of 5.10%. Telekom Austria, on the other hand, uses a 3.05% risk-free rate but applies a higher equity risk premium of 6.20%.
In developing markets, WACC tends to be higher. Telekom Malaysia stands out with a WACC of 9.7%, the highest in the case studies. This reflects its 7.35% equity market risk premium and an adjusted beta of 0.81. By contrast, U.S.-based companies benefit from lower equity market risk premiums, such as the 5.10% used by AT&T and U.S. Cellular.
However, high debt costs can offset favorable equity conditions. U.S. Cellular is a great example. Despite a cost of equity at 6.5% (beta 0.36), its overall WACC climbs to 6.8% due to a steep 13.35% cost of debt and a corporate tax rate of 42.1% - almost double Telekom Malaysia's tax rate of 18.25%.
WACC Comparison Table
| Company/Region | Cost of Equity | Cost of Debt | Overall WACC | Key Assumptions (Beta / Risk Premium) |
|---|---|---|---|---|
| AT&T Inc. (USA) | 7.3% | 5.1% | 6.0% | Beta: 0.46; ERP: 5.10% |
| Telekom Austria (Austria) | 7.2% | 4.25% | 6.0% | Beta: 0.55; ERP: 6.20% |
| U.S. Cellular (USA) | 6.5% | 13.35% | 6.8% | Beta: 0.36; ERP: 5.10% |
| Telekom Malaysia (Malaysia) | 10.35% | 5.5% | 9.7% | Beta: 0.81; ERP: 7.35% |
Capital structure decisions also have a big impact on WACC. For instance, Telekom Malaysia keeps a conservative debt-to-equity ratio of 0.13, while AT&T relies on higher leverage with a ratio of 0.67. These choices reflect how companies weigh the benefits of tax shields against potential financial risks. Such comparisons offer valuable insights for startups looking to fine-tune their financial strategies.
What Startups Can Learn from These Case Studies
Startups can draw valuable insights from the strategies used by telecom leaders to better manage their cost of capital and financial planning.
Lessons from Telecom Leaders
Telecom case studies highlight three key strategies that startups can adopt to improve their financial decision-making:
- Segment-specific hurdle rates: Teletech Corporation demonstrated the importance of tailoring hurdle rates to specific business segments. For example, their Telecommunications Services segment had a hurdle rate of 8.64%. Using a single, company-wide rate for diverse business lines often results in poor capital allocation. Startups with multiple product lines should calculate separate Weighted Average Cost of Capital (WACC) for each division. This ensures that capital is allocated appropriately between high-risk and low-risk projects, improving overall financial efficiency.
- Strategic debt management: Telecom companies often prioritize reducing long-term debt over maintaining short-term liquidity. While this can temporarily strain liquidity, it frees up resources for future investments and strengthens long-term competitiveness. Startups can adopt this mindset to balance immediate needs with sustainable growth.
- Market values over book values: Companies like Telus provide a clear example of why using market values in financial calculations is more accurate. For instance, Telus calculated its cost of equity using a beta of 0.75 and a risk-free rate of 5.82% based on Government of Canada Bonds. Startups should follow suit, using current market values of equity instead of outdated book values. This approach ensures that WACC calculations reflect present risks and potential future cash flows.
Leveraging AI for Financial Planning
AI-driven tools are taking these traditional methods to the next level by making financial planning faster and more precise. Modern AI platforms now incorporate real-time data, such as risk-free rates (currently around 2.8% to 3.3%), equity market risk premiums (5.7% to 6.7%), and adjusted betas, to deliver instant WACC estimates. This eliminates the need for time-consuming spreadsheet calculations and allows startups to experiment with different debt-to-equity ratios to find the most efficient capital structure.
Lucid Financials is one such platform that integrates seamlessly into your workflow, even through tools like Slack. It uses AI to generate financial forecasts and investor-ready reports tailored to your business. Whether you're evaluating a major investment or preparing for fundraising, you can ask questions about runway, cost of capital, or cash flow scenarios and receive data-backed insights in real time. The platform handles beta calculations, benchmarking, and risk adjustments (usually between 0.25%–0.5%), with finance professionals reviewing outputs for accuracy. Starting at $150 per month, it provides CFO-level insights at a fraction of the cost, making it an essential tool for startups aiming for steady growth.
FAQs
How do I pick the right WACC for a specific telecom project?
To figure out the appropriate Weighted Average Cost of Capital (WACC) for a telecom project, you'll need to look at a few key factors: industry benchmarks, regulatory guidelines, and your company’s specific capital structure. Start by reviewing industry data, regulatory rulings, and relevant studies to pinpoint WACC ranges that apply to your sector. It's also critical to ensure your calculations align with local regulations while factoring in any risks unique to your project. This approach helps maintain both compliance and precision.
When should a company use segment-specific WACC instead of one rate?
A company should apply segment-specific WACC (Weighted Average Cost of Capital) when its business segments face different levels of risk or operate under distinct capital structures. This method becomes especially important when variations stem from factors like industry-specific challenges, regional regulatory requirements, or differing financial conditions. By evaluating each segment individually, businesses can make more precise assessments of the financial risks and potential returns unique to each part of their operations.
How do regulations change a telecom company’s WACC over time?
Regulations play a key role in shaping a telecom company's Weighted Average Cost of Capital (WACC) by determining allowable rates of return and tweaking its components. For instance, regulatory bodies might set specific rates, adjust cost estimation methods like the Capital Asset Pricing Model (CAPM), or modify weightings to reflect current market conditions. These regulatory shifts can either increase or decrease WACC, which, in turn, impacts how companies approach investment choices and pricing strategies over time.