Most consumer goods startups focus on acquiring new customers, but retaining existing ones is far more cost-effective and profitable. Improving retention by just 5% can increase profits by 25% to 95%. Loyal customers spend 67% more than new ones and are 60–70% more likely to make repeat purchases. Tracking retention metrics helps identify issues early, reduce churn, and drive long-term growth.
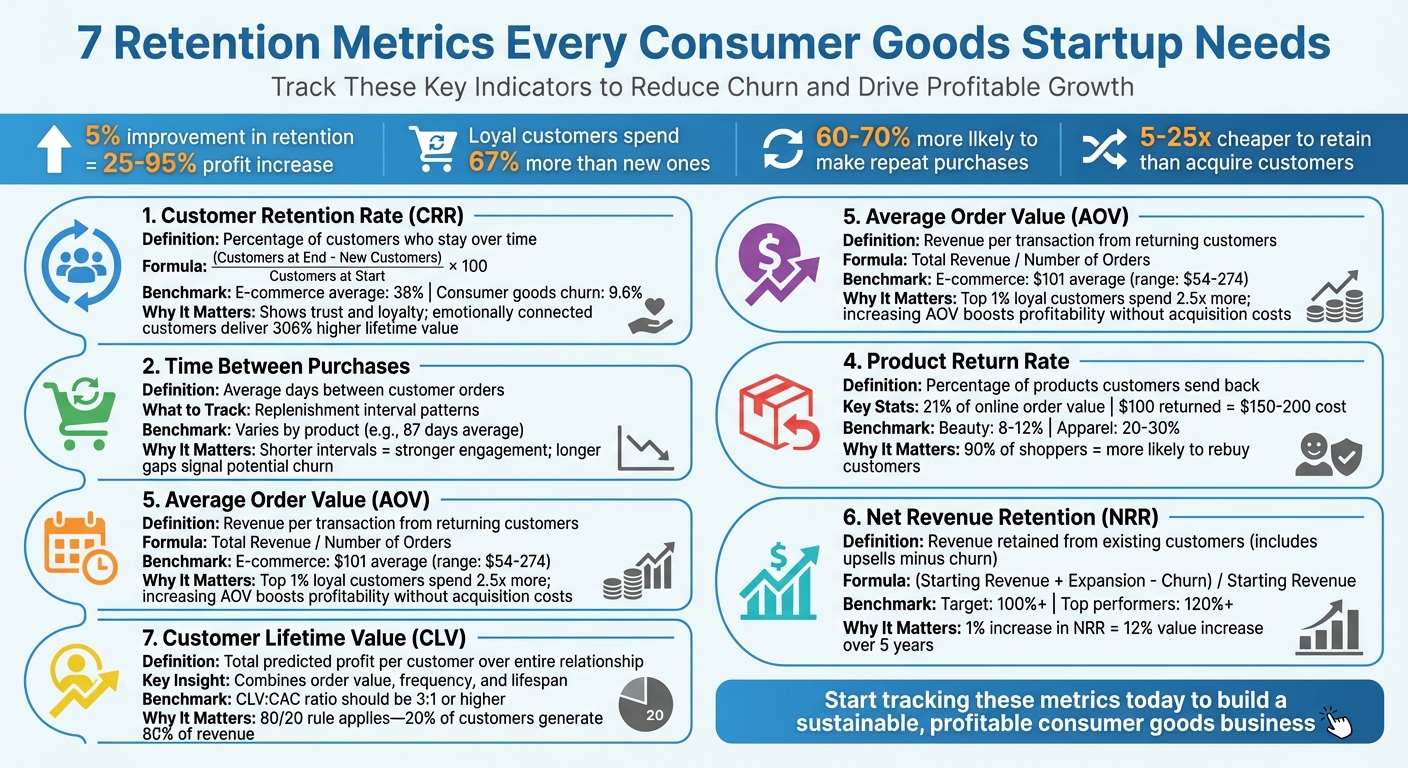
Here are the 7 key retention metrics every consumer goods startup should monitor:
- Customer Retention Rate (CRR): Measures how many customers stay with you over time. A high CRR indicates trust and loyalty.
- Repeat Purchase Rate (RPR): Tracks how often customers make additional purchases, signaling strong engagement.
- Time Between Purchases: Reveals how engaged customers are by tracking how quickly they reorder.
- Product Return Rate: Highlights issues like quality or mismatched expectations that can hurt loyalty.
- Average Order Value (AOV): Shows how much customers spend per transaction, reflecting their growing trust in your brand.
- Net Revenue Retention (NRR): Combines upsells and churn to measure overall revenue growth from existing customers.
- Customer Lifetime Value (CLV): Predicts the total profit a customer will bring, helping guide acquisition and retention investments.
7 Essential Retention Metrics for Consumer Goods Startups
Customer Retention & Cohort Analysis | How VCs Calculate Customer Retention
sbb-itb-17e8ec9
1. Customer Retention Rate
Customer Retention Rate (CRR) measures the percentage of existing customers who continue to engage with your brand over a specific period, excluding new customers. The formula is straightforward:
[(Customers at End – New Customers) / Customers at Start] x 100.
For example, if you begin January with 1,000 customers, gain 200 new ones, and finish with 950 customers, your CRR is 75%.
Impact on Customer Loyalty and Retention
CRR reflects how well your product delivers consistent value. A high retention rate shows that customers trust your brand and are likely to become repeat buyers or even advocates. For reference, ecommerce businesses average a retention rate of about 38%, while consumer goods startups often face churn rates around 9.6%. However, loyalty can be fragile - 61% of customers may switch to a competitor after a single negative experience. On the flip side, emotionally connected customers can deliver up to 306% higher lifetime value.
Actionable Insights for Reducing Churn
Churn tends to spike early, usually within the first 14–45 days. This makes early engagement critical for showing your product’s value. For instance, a skincare startup might send helpful usage tips or offer discounts on complementary products, while a meal subscription service could share personalized recipes to keep customers engaged.
Cohort analysis can also provide clarity. By analyzing retention based on the month customers joined, you can pinpoint when churn increases. For example, if retention drops around Month 3, investigate potential causes like inventory issues or pricing concerns. Segmenting retention data by acquisition channel can also reveal which channels bring in more loyal customers.
Relevance to Consumer Goods Startups
For startups in consumer goods, retention is essential for long-term growth. In industries where supply chain disruptions and shipping delays are common, consistent service and personalized experiences can transform one-time buyers into loyal customers.
"Increasing customer retention by as little as 5% can increase profits by 25% or more." – Fred Reichheld, Creator of Net Promoter Score
Keeping an eye on customer behavior is crucial. For example, if a customer who typically reorders every 30 days stretches their cycle to 60 days, it’s a warning sign. Proactive measures, like sending a “running low?” reminder, can help prevent churn. Additionally, collecting feedback from departing customers can guide improvements.
Potential for Revenue Growth and Profitability
Retention has a direct impact on revenue and profit. Returning customers tend to spend 67% more than new ones. Imagine a startup selling $30 skincare products: if 100 customers make three repeat purchases instead of just one, the revenue from those customers triples. A strong CRR not only improves profitability but also provides predictable recurring revenue, which reduces acquisition costs and appeals to investors. It’s the difference between a business with constant churn and one with steady, sustainable growth.
Understanding CRR lays the groundwork for analyzing other metrics that reveal customer behavior. Next, we’ll dive into the Repeat Purchase Rate to gain further insights.
2. Repeat Purchase Rate
Repeat Purchase Rate (RPR) measures how many of your customers come back for more. It’s calculated using this formula: (Number of customers with more than one purchase / Total number of customers) x 100. For example, if out of 500 customers, 150 make a second purchase, your RPR is 30%. While Customer Retention Rate (CRR) tracks overall loyalty, RPR focuses specifically on repeat buying behavior.
Impact on Customer Loyalty and Retention
RPR is a clear indicator of loyalty, showing how well your brand converts first-time buyers into repeat customers. While CRR reflects how "sticky" your customer base is overall, RPR hones in on those who actually make additional purchases. For most ecommerce businesses, a solid RPR ranges between 20% and 40%, with anything above 50% being exceptional. A high RPR often reflects strong trust in your brand and the perceived value of your products. The numbers back this up: selling to an existing customer has a success rate of over 60%, compared to just 5–20% for new prospects. Monitoring RPR can help identify your most loyal customers and highlight areas where engagement efforts might be needed.
Actionable Insights for Reducing Churn
Boosting repeat purchases often comes down to timing and personalization. For instance, The Turmeric Co. increased retention by 60% and doubled customer lifetime value by introducing a gamified loyalty program in 2024. Timing matters too - if customers typically reorder every 45 days, sending a re-engagement email around day 40 can encourage a timely repeat purchase. Companies like Shapeways saw a 525% jump in click-through rates with tailored campaigns, while HomeWorx improved retention by 25% and grew revenue 11-fold in just 90 days by offering one-click reordering. These examples show how personalized strategies and well-timed communication can significantly reduce churn.
Potential for Revenue Growth and Profitability
Loyal customers are a goldmine for revenue. In fact, just 8% of customers can account for 41% of your revenue, proving the immense potential of repeat business. Retaining customers is also far more cost-effective - it’s 6 to 7 times cheaper than acquiring new ones. Take Dollar Shave Club, for example: they gained 12,000 subscribers in a single day and maintained a 33% retention rate after two years. Their subscription model not only created predictable revenue but also strengthened profitability, forming a reliable financial base.
3. Time Between Purchases
The "time between purchases", often referred to as the "replenishment interval" in consumer goods, is a key metric for gauging customer engagement. It tracks the duration customers take before making their next purchase. A shorter interval typically reflects stronger satisfaction and engagement, while a longer one can suggest declining interest or disengagement.
Impact on Customer Loyalty and Retention
This metric provides insights into customer behavior that other metrics might miss. When customers order more frequently, they tend to form a habit around the product, naturally shortening the time between purchases. On the flip side, a lengthening interval can signal the early stages of disengagement. As Carlos Gonzalez de Villaumbrosia, Founder & CEO of Product School, explains:
"A shrinking time gap usually signals stronger engagement and satisfaction, while longer gaps may hint at fading interest or potential churn".
By keeping a close eye on these trends, businesses can identify and address potential churn before it becomes a larger issue.
Actionable Insights for Reducing Churn
Replenishment interval data can guide the timing of customer outreach. For example, if the average interval is 87 days, sending a reorder reminder around day 80 can encourage timely purchases. For customers whose purchase patterns deviate from the norm, targeted winback campaigns - such as offering discounts - can help re-engage them. Mark Johnson from Repeat highlights the benefits of this approach:
"When you reduce your replenishment interval, customers increase their LTV at a faster rate, and the value of the customers you worked hard to acquire increases".
Additionally, aligning renewal reminders with actual product consumption patterns ensures you're meeting customer needs more effectively. This metric complements other retention indicators like CRR and RPR, offering a more detailed view of customer engagement rates.
Relevance to Consumer Goods Startups
For startups in the consumer goods space, understanding replenishment intervals is particularly important. With an average churn rate of 9.62%, improving retention by just 5% can boost profits by 25% to 95%. To maximize retention, focus on products with the shortest "first-to-second order" intervals. These products encourage quicker repeat purchases, helping new customers establish buying habits and driving long-term growth.
4. Product Return Rate
The product return rate shows the percentage of items customers send back, shedding light on potential problems like quality issues, misleading descriptions, or unmet customer expectations.
Impact on Customer Loyalty and Retention
How a brand handles returns can make or break customer loyalty. Over 90% of shoppers say they’re more likely to buy again from a site with an easy return process, while 95% admit that a brand’s return policy heavily influences their future shopping decisions.
Returns are also a major financial burden. For U.S. online retailers, they account for about 21% of total order value. To make matters worse, every $100 in returned goods can cost businesses between $150 and $200. As Rafay Hassan from Rocket Returns explains:
"Return rates are the silent profit killer that every eCommerce business faces, yet few address strategically".
Actionable Insights for Reducing Churn
To manage returns effectively, start by identifying the reasons behind them. Around 65% of returns happen because of issues with fit or sizing, and 56% result from products not matching their online descriptions. Tracking these patterns at the SKU level can help pinpoint problem areas, such as specific sizes, colors, or product batches.
Shifting the focus to exchanges rather than refunds can also help retain revenue. For example, introducing an "exchange-first" policy or offering instant store credit can minimize losses. Additionally, detailed product descriptions - including multiple-angle photos, fabric details, and technical specs - can address the "information gap" responsible for 31% of returns. Apparel startups, which often face return rates of 20–30%, might benefit from tools like AI-powered size recommendations or AR features that let customers virtually try on items.
Effectively managing return rates not only reduces churn but also strengthens customer retention strategies.
Relevance to Consumer Goods Startups
Return rates can vary widely depending on the product category, so benchmarking is crucial. For instance, beauty and personal care items typically see return rates of 8–12%, while apparel and fashion hover around 20–30%. Since keeping an existing customer is 5–25 times cheaper than acquiring a new one, cutting down on return-driven churn can significantly improve profitability.
Tracking metrics like your refund rate (percentage of orders returned for full refunds) and exchange rate (ratio of exchanges to total returns) can offer valuable insights into customer loyalty and revenue retention. Managing return rates is an integral part of building stronger customer relationships and boosting overall revenue.
5. Average Order Value Retention
Understanding how much each customer spends per transaction is a key part of strengthening your retention strategy. Average Order Value (AOV) measures this by dividing total revenue by the number of orders. For consumer goods startups, AOV provides insight into whether your returning customers are spending more over time or if their engagement is leveling off.
Impact on Customer Loyalty and Retention
When customers start spending more per order, it’s a sign they’re discovering more products they like, which keeps them coming back. In fact, loyal customers tend to spend much more than new ones. The top 1% of loyal customers, for instance, spend 2.5 times more than the rest.
AOV also ties closely to Customer Lifetime Value (CLV). As AOV increases, the profitability of each customer relationship grows, amplifying the return on your retention efforts. On the flip side, a declining AOV can act as an early warning that customers might be losing interest, potentially leading to churn.
Actionable Insights for Reducing Churn
To boost AOV and keep customers engaged, focus on strategies like personalized product recommendations and cross-selling. These approaches encourage shoppers to add complementary items to their carts. Dynamic bundling - offering curated product sets at a value - can also drive larger transaction sizes.
Tiered loyalty programs are another effective tool. Offering rewards like points, exclusive discounts, or VIP perks for higher spending motivates customers to increase their order sizes to unlock more benefits. Tracking AOV alongside loyalty program performance ensures your incentives are driving the desired results. These tactics not only increase immediate sales but also contribute to long-term revenue growth.
Potential for Revenue Growth and Profitability
Raising AOV has a direct and measurable impact on profitability. Studies show that increasing customer retention by just 5% can lead to a profit increase of 25% to 95%. Unlike acquiring new customers - which often requires hefty marketing budgets - improving AOV allows you to maximize the value of your current customer base without additional advertising costs.
For e-commerce businesses with 20,000 to 500,000 monthly visitors, the average AOV is around $101, with typical ranges between $54 and $274. Since every order comes with fixed costs for shipping, handling, and processing, increasing AOV spreads these costs across larger transactions, improving profit margins. Monitoring AOV retention helps ensure you're extracting the most value from each customer relationship while building a more profitable and sustainable business model.
6. Net Revenue Retention
Net Revenue Retention (NRR) is a key metric that shows how much revenue your business retains from existing customers over time. It factors in both upsells and losses from churn. The formula is simple: NRR = (Starting Revenue + Expansion Revenue – Churn) / Starting Revenue. For startups in the consumer goods space - especially those with subscription or auto-replenishment models - this metric highlights whether customers find enough value to not only stay but also spend more.
Impact on Customer Loyalty and Retention
NRR offers a clear picture of how "sticky" your customer base is. When customers increase their spending, it’s a sign they’re getting real value from your products. A solid subscription business typically aims for an NRR of 100% or higher, where expansion revenue fully offsets any churn losses. Top-performing companies often reach NRR levels of 120% or more.
"The higher the NRR, the more secure a company's outlook appears, as it implies that the customer base must be receiving enough value from the provider to remain".
Relevance to Consumer Goods Startups
For consumer goods companies, NRR can reveal whether customers are upgrading their subscriptions or adding more recurring items to their orders. Investors often look at this metric to gauge product-market fit and decide on funding. In fact, a 1% increase in revenue retention can boost a company’s value by 12% over five years. A 2022 study found that 57% of teams using a dedicated Customer Success platform reported an NRR above 100%.
Actionable Insights for Reducing Churn
To improve NRR, start by segmenting your customers based on their purchase value and potential for growth. Focus retention strategies on high-value accounts. Use health scoring to track behaviors like purchase frequency and product engagement, so you can time upsell opportunities effectively. Introduce incentives for teams that proactively identify growth within your existing customer base. Finally, conduct post-churn surveys to uncover why customers leave and use that feedback to prevent future losses. These steps can help you retain more revenue and build a stronger customer base.
Potential for Revenue Growth and Profitability
Tracking NRR alongside Gross Revenue Retention (GRR) gives you a complete view of your business. GRR shows your retention "floor", while NRR reveals your growth "ceiling". Since the average churn rate for consumer goods is 9.6%, focusing on NRR provides a clear path to sustainable growth. It allows you to grow revenue without relying solely on acquiring new customers, which is often more costly and less predictable.
7. Customer Lifetime Value
Customer Lifetime Value (CLV) is a crucial metric that predicts the total profit a customer will generate over their entire relationship with your business. It combines factors like order value, purchase frequency, and customer lifespan into a single, actionable figure. For consumer goods startups, understanding CLV is essential for balancing investments in customer acquisition and retention. As Mariel Kilroy, Co-Founder of Sticky Digital, aptly explains:
"CLV is not a bragging number. It's a governor on how fast you can grow without breaking the car".
This perspective highlights how CLV helps guide decisions on spending for ads, free shipping, or return policies while keeping profitability in check.
Impact on Customer Loyalty and Retention
CLV shifts the focus from short-term gains to the long-term health of your customer base. Unlike historical metrics, which look backward, CLV uses predictive analytics to estimate future revenue and customer longevity. This forward-thinking approach makes it easier to identify which customers deserve extra attention. For example, returning customers typically spend 67% more than first-time buyers. A healthy CLV to Customer Acquisition Cost (CAC) ratio - ideally above 3:1 - indicates profitable growth, while a ratio below 1:1 suggests that acquisition costs are unsustainable.
Relevance to Consumer Goods Startups
For consumer goods brands, CLV provides insights into which products act as "gateway" items that foster long-term loyalty versus those that result in one-time purchases. Analyzing CLV by the first product purchased can reveal the most effective entry points for new customers. The 80/20 rule often applies here, where 20% of customers generate 80% of revenue. Additionally, customer retention probabilities increase significantly with repeat purchases - after a first purchase, there’s only a 27% chance a customer will return, but this jumps to 54% or higher after a second and third purchase. Like CRR and NRR, CLV provides a forward-looking measure to strengthen retention strategies and drive sustainable growth.
Actionable Insights for Reducing Churn
- Identify top customers: Use RFM (Recency, Frequency, Monetary) analysis to pinpoint your top 20% of customers and engage them with exclusive VIP campaigns.
- Tiered loyalty programs: Create loyalty programs that reward higher spending and incentivize repeat purchases.
- Automated reminders: Send replenishment emails - like reminding customers to reorder consumables such as coffee beans before they run out - to encourage consistent purchases.
- Watch discount patterns: Monitor how often repeat customers rely on discounts. Heavy reliance on discounts could indicate that growth is becoming too costly, negatively impacting CLV.
- Predictive insights: Use predictive CLV models to identify at-risk customers and trigger timely win-back campaigns before they churn.
By integrating tools like Lucid Financials, startups can streamline these strategies, making it easier to optimize both acquisition spending and retention efforts.
Potential for Revenue Growth and Profitability
CLV acts as a guide for setting limits on acquisition and retention spending, ensuring profitability remains intact. Selling to an existing customer is far more effective, with a conversion likelihood of 60–70%, compared to just 5–20% for new prospects. To model profitability accurately, calculate CLV based on gross margin rather than raw revenue. For instance, if data shows that faster shipping increases CLV and shortens payback periods, offering subsidized expedited delivery for high-value customers could be a smart move. CLV ultimately helps businesses grow efficiently by reducing the financial strain of customer acquisition.
For consumer goods startups aiming to align financial insights with operational strategies, platforms like Lucid Financials provide real-time analytics to monitor CLV alongside other retention metrics, simplifying the path to sustainable growth.
Conclusion
For consumer goods startups, keeping an eye on retention metrics isn’t just a good idea - it’s a must for achieving steady growth. The seven metrics discussed earlier provide a clear picture of where customer engagement might be falling short and help shape smarter strategies. Even a small improvement in retention, like 5%, can lead to a profit increase of 25% to 95%. On top of that, retaining customers is far cheaper than acquiring new ones, which can cost 5 to 25 times more. Plus, loyal customers spend 67% more than new buyers and are 60% to 70% more likely to make repeat purchases.
Understanding these metrics is just the first step - turning them into actionable strategies is where the real impact lies. For example, cohort analysis can highlight the exact moments when customers start to disengage, allowing you to implement automated re-engagement campaigns at the right time. This method also helps you identify your most valuable customers, so you can focus extra effort on keeping them satisfied. Tools like Lucid Financials make it easier by automating these calculations and providing real-time insights into how retention impacts your bottom line.
FAQs
Which retention metric should I start with first?
The customer retention rate is a key metric that reveals the percentage of customers your business has kept over a specific time frame. It provides a clear snapshot of how well your strategies are working to maintain your customer base. Think of it as the baseline for assessing and refining your retention efforts. This metric is essential for understanding your ability to build and sustain lasting customer relationships.
How do I pick the right time window for retention metrics?
When choosing a time window, think about your business model and how your customers behave. For consumer goods startups, a 30-day window is a good starting point to identify early signs of churn. If you're aiming to understand loyalty on a deeper level, consider extending this to 60 or 90 days. The key is to match the time frame to your customer lifecycle. This approach helps you uncover meaningful trends and fine-tune your retention strategies.
How can I spot churn early using purchase timing data?
To spot churn early, track how the chances of repeat purchases shift over time after a customer's last order. This approach helps identify when customers might drop off. Pay attention to metrics like the probability of repeat orders tied to the number of months since their most recent purchase to uncover useful patterns.