If I want one cash metric that shows whether sales are turning into money in the bank, I look at operating cash flow margin.
It tells me how much cash a company brings in from day-to-day business for every $1.00 of revenue. The formula is simple: Operating Cash Flow ÷ Revenue × 100%. If revenue goes up but this margin drops, that usually points to slow customer payments, cash tied up in receivables or inventory, or spending that is outpacing cash coming in.
Here’s the short version:
- What it measures: cash generated from core business activity as a share of revenue
- Why it matters: revenue can look strong while cash gets tight
- How to calculate it: use net cash provided by operating activities from the cash flow statement and revenue from the income statement
- How to read it: a higher percentage means more sales are turning into cash
- What to watch with it: burn rate, runway, cash balance, DSO, and working capital
- How often to review it: monthly at a minimum, and weekly or daily when the business is moving fast
- What can move it: collections, invoicing, hiring pace, marketing spend, pricing, discounts, and vendor payment timing
A few examples make the point fast. At $1,000,000 in quarterly revenue and a 15% margin, the business is producing about $150,000 in cash from normal business activity. If margin moves from -2% to 10% over two quarters, that usually means cash conversion has improved. If it falls from 20% to 8%, I’d check receivables, spend, and payment timing right away.
Just as important, this KPI is not the same as operating margin, free cash flow, or the operating cash flow ratio. One looks at accounting profit, one subtracts capital spending, and one checks short-term liabilities. Operating cash flow margin answers a different question: how much of revenue turns into cash now.
So if I’m tracking startup cash health, this metric belongs on the main dashboard - right next to cash, burn, and runway.
How CFOs view EBITDA vs. OCF (Operating Cash Flow)
sbb-itb-17e8ec9
Understanding Operating Cash Flow Margin as a KPI
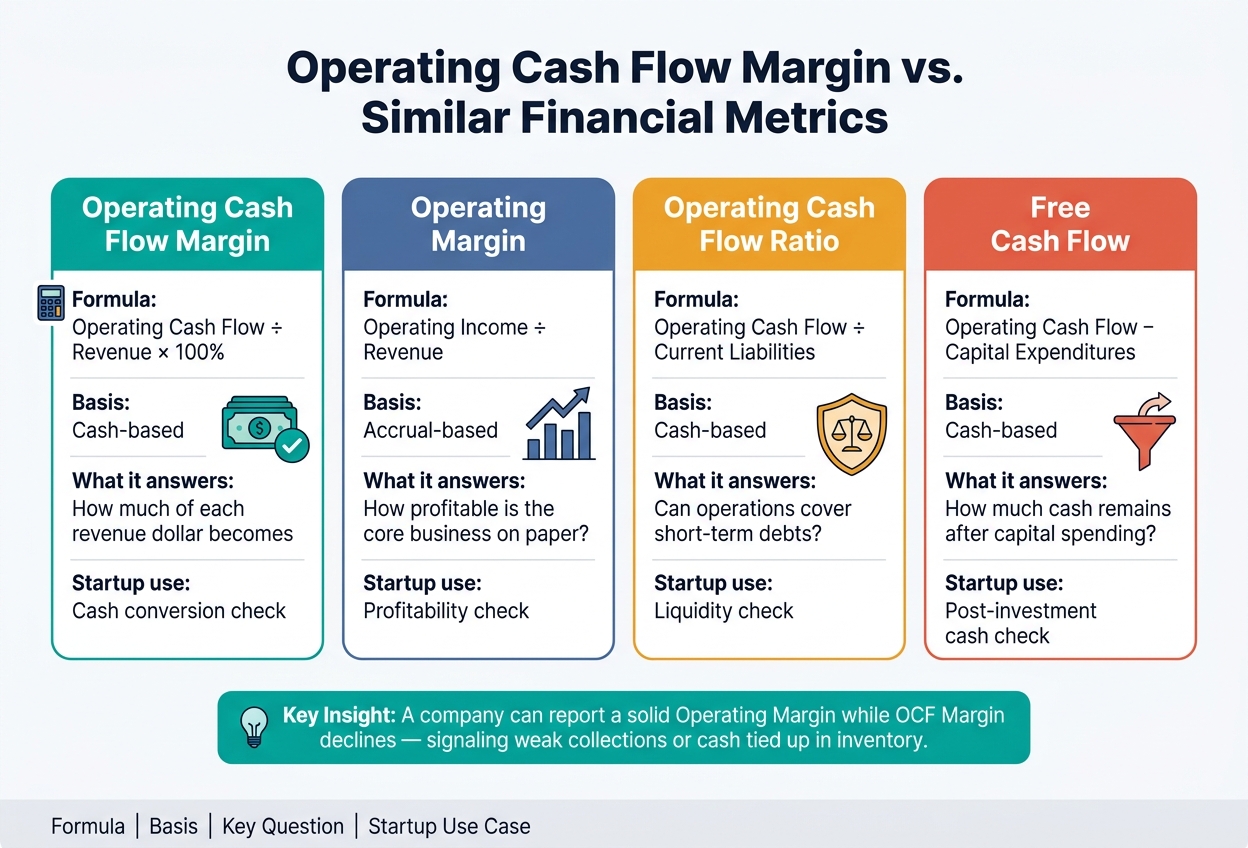
Operating Cash Flow Margin vs. Similar Metrics: Key Differences
Operating cash flow is the cash a business generates from its core operations. For startups, that matters a lot. A company can show strong growth on paper while still struggling to turn sales into cash.
That’s where operating cash flow margin comes in. It shows how much of each revenue dollar ends up as operating cash. Put simply, it tells you how well revenue turns into cash.
Formula, Meaning, and How to Read the Result
Operating Cash Flow Margin = (Operating Cash Flow ÷ Revenue) × 100%
A higher percentage means the business turns more of its sales into cash. A low or negative result can point to poor collections, heavy inventory use, or profits that aren’t turning into cash.
That’s why OCF margin works as a practical cash health metric, not just an accounting ratio.
How It Differs From Operating Margin, OCF Ratio, and Free Cash Flow
OCF margin often gets mixed up with other metrics that sound similar. But each one answers a different question. Use the wrong metric, and you can end up reading the business the wrong way.
| Metric | Formula | Meaning | Startup Use Case |
|---|---|---|---|
| Operating Cash Flow Margin | (Operating Cash Flow / Revenue) × 100% | Cash-based profitability and cash quality | Cash conversion check |
| Operating Margin | Operating Income / Revenue | Accounting profit before interest and taxes | Profitability check |
| Operating Cash Flow Ratio | Operating Cash Flow / Current Liabilities | Short-term liquidity | Liquidity check |
| Free Cash Flow (FCF) | Operating Cash Flow − Capital Expenditures | Cash left after capital spending | Post-investment cash check |
The big difference is simple: operating margin is accrual-based, while OCF margin is cash-based. A company can report a solid operating margin while its OCF margin gets worse. When that happens, it can signal weak collections or too much cash tied up in inventory.
Next, use the company’s financial statements to calculate it correctly.
How to Calculate Operating Cash Flow Margin Using U.S. Financial Statements
A calculation only helps if you can run it the same way every single period.
Where to Find the Numbers on Your Financial Statements
You only need two numbers to calculate operating cash flow margin. But the exact line items matter.
Operating Cash Flow (OCF) shows up on the Statement of Cash Flows under Operating Activities. It’s usually labeled "Net cash provided by operating activities."
Revenue comes from the top line of the Income Statement. It’s usually labeled "Total Revenue" or "Net Sales."
Use the same reporting period for both numbers: quarter with quarter, month with month, and TTM with TTM.
Once you’ve found both figures, the next job is simple: use the same setup every time so your trend line means something.
Common Calculation Mistakes Startups Make
Even when teams pull the right statements, small mix-ups can throw this KPI way off. A booking number sneaks in, a period doesn’t match, or a one-time cash event gets missed. That’s how a clean formula turns into a messy metric.
| Formula Component | Where to Find It (U.S. GAAP) | Common Pitfalls |
|---|---|---|
| Net Cash Provided by Operating Activities | Statement of Cash Flows - Operating Activities section | Using FCF instead of OCF |
| Total Revenue / Net Sales | Income Statement - top line | Using bookings instead of revenue |
| Period Matching | Header of each financial statement | Mixing periods |
| Working Capital Adjustments | Statement of Cash Flows - Adjustments section | Ignoring AR growth |
| One-Time Cash Events | Footnotes / Statement of Cash Flows | Missing one-time items |
A good gut check: if revenue looks clean but cash from operations swings hard, look at working capital first. AR growth, in particular, can change the picture fast.
How Lucid Financials Can Help Standardize the Calculation

Lucid Financials can help standardize OCF margin calculations by keeping the books current, syncing finance questions in Slack, and keeping investor-ready reporting up to date in real time.
After the formula is locked in, put it on a dashboard next to burn, runway, and AR aging.
How to Track and Analyze Operating Cash Flow Margin in Real Time
Once you’ve locked in a consistent formula, the next step is simple: make the number visible fast enough to act on it before cash gets tight. Track it at least weekly, and daily if you’re running a fast-moving startup and your books and bank feeds update that often.
Start with a dashboard that shows OCF margin alongside the cash metrics that explain why it moved.
Dashboard Setup, Review Cadence, and Supporting Metrics
Operating cash flow margin works best when you view it next to cash balance, burn rate, runway, DSO, and working capital. That mix gives you a clear read on cash position, cash speed, and near-term funding risk.
| Metric | Formula (U.S. Format) | Review Frequency | Decision Supported |
|---|---|---|---|
| Operating Cash Flow Margin | Operating Cash Flow ÷ Revenue × 100% | Weekly; daily for fast-growing startups | Whether operations generate or consume cash per $1 of revenue |
| Cash Balance | Ending cash and cash equivalents ($) | Daily | Whether current cash covers near-term obligations |
| Net Burn Rate | Monthly cash outflows − monthly operating cash inflows ($) | Weekly or monthly | How quickly the company is using cash |
| Runway | Cash Balance ÷ Monthly Net Burn (months) | Monthly | How many months of operations remain at current burn |
| Days Sales Outstanding (DSO) | Accounts Receivable ÷ Average Daily Credit Sales | Monthly | How quickly customers pay; whether collections need tightening |
| Working Capital | Current assets − current liabilities ($) | Monthly | Ability to cover short-term obligations and fund growth |
A weekly review is the default. If runway drops below six months, switch to daily. A short cash update in Slack every Monday can do the job just fine. Share margin, cash balance, burn, and runway so everyone stays on the same page without adding another meeting to the calendar.
After the dashboard is live, don’t stare at the absolute number first. Look at the direction of change.
How to Read Trend Changes Over Time
A rising margin - for example, moving from 5% to 15% over three months - usually means operations are getting better at turning revenue into cash. The usual drivers are better collections, tighter cost control, or more upfront payment terms. When that happens, dig into what changed and decide whether to keep pushing in that direction.
A falling margin - say, from 20% down to 8% - means operations are using more cash for each dollar of revenue. This often shows up when hiring gets ahead of revenue, marketing spend jumps, or customers take longer to pay. First, compare the drop with prior months and quarters. Sometimes it points to a planned investment stretch, not deeper stress.
A volatile margin, with big month-to-month swings, is common in early-stage startups with uneven deal flow or irregular billing. That usually points to a process issue. In many cases, the fix is tighter payment terms and more standardized billing cycles, not just more frequent monitoring.
A persistently negative margin across several periods means the core business is consuming cash by design or by problem. Some venture-backed companies expect this during heavy growth phases. Still, the question doesn’t change: how long can that continue with the current runway and fundraising outlook?
Benchmark the number against the last 3–6 months, the same quarter last year, and the kind of business you run.
When manual review starts to lag behind actual cash movement, automation helps.
Using AI-Driven Monitoring for Alerts and Visibility
AI monitoring can pull accounting and bank data on a continuous basis, recalculate OCF margin, and flag unusual movement on its own. That might mean alerting you when margin drops by more than 5 points month over month, DSO rises by more than 10 days quarter over quarter, or runway falls below six months.
That changes the timing of the conversation. Instead of finding a cash problem at month-end, a founder sees it midweek with a plain-language note explaining what happened - for example, a margin decline tied to a 30% jump in marketing spend and delayed collections from the top three customers.
Lucid Financials gives teams that kind of visibility through its Slack integration and real-time AI insights. It surfaces answers about runway, spend, and cash performance right in Slack, so founders can spend less time building reports and more time acting on what the numbers are saying.
Using Operating Cash Flow Margin to Make Better Decisions
Decisions This KPI Should Drive
Once this metric is on your dashboard, it should shape decisions around hiring, pricing, and fundraising. It shouldn't sit there as a nice-looking reporting number.
A good place to start is revenue quality. Say revenue is up 60% year over year, but OCF margin is hovering around 0% or still negative. That's a sign to dig deeper. In many cases, customers are paying late, discounts are cutting too far into cash, or implementation costs are consuming cash before the money comes in. Revenue growth without better margin doesn't always mean the business is getting healthier. Sometimes it just means the working capital gap is getting bigger.
Focus first on the choices that affect cash the fastest. Hiring is one of the clearest examples. At $1,000,000 in quarterly revenue and a 15% margin, the business is producing about $150,000 in operating cash. If margin falls after a burst of hiring or a bigger marketing push, that's a warning sign. It means operating costs are growing faster than cash inflows, even when top-line revenue looks good. When you look at OCF margin alongside burn rate and cash balance, you get a much better sense of how long the business can support its current headcount without going out to raise capital.
Before a fundraising round or a board meeting, OCF margin can also help pressure-test the growth plan. A base case that shows margin moving from 8% to 14% over four quarters, driven by tighter collections and controlled hiring, makes the story stronger. In the U.S., investors often look closely at burn multiple and cash conversion metrics, so a margin trend that is moving the right way matters.
Levers That Improve Operating Cash Flow Margin
These are the operating levers that affect OCF margin most directly.
| Lever | Effect on Margin | Related Action |
|---|---|---|
| Faster collections | Increases margin as more revenue converts to cash in-period | Automate payment reminders, enforce Net 15–30 terms, offer early-pay incentives |
| Cleaner invoicing | Improves margin by shrinking the receivables backlog | Standardize templates, include clear due dates, PO references, and itemized line items |
| Tighter expense controls | Raises margin by reducing cash burn per dollar of revenue without changing revenue | Run monthly expense reviews, cancel unused subscriptions, set approval thresholds |
| Pricing and discount discipline | Lifts margin as each dollar of revenue carries more cash contribution | Set discount guardrails, test modest price increases, favor annual prepay over heavy discounts |
| Better payables timing | Stabilizes or improves margin by delaying cash outflows within vendor terms | Negotiate Net 30–60 terms, batch vendor payments, tie schedules to project milestones |
Here's a simple example. A B2B startup switches from quarterly invoicing to upfront annual contracts, with no change in pricing. OCF margin can improve just because cash shows up sooner. That's a collections and contract-structure move, not a revenue move.
Conclusion: Core Habits for Tracking Cash Flow Margin
If OCF margin changes behavior, it deserves a spot on the dashboard.
Keep it consistent, current, and tied to decisions. Review it at least monthly, and check it more often when cash is moving fast. Read changes in context by comparing margin with net income margin, the OCF ratio, burn rate, runway months, and support metrics like DSO or expense categories.
Most of all, tie it back to decisions. Record when a new collections policy moved margin from −2% to +10% over two quarters. Record when rapid hiring or a larger marketing push squeezed margin, and which actions helped bring it back. That turns one KPI into an operating record of how the business actually produces cash.
FAQs
What is a good operating cash flow margin?
There’s no single benchmark for a “good” operating cash flow margin. It depends on where your company is in its growth path and the kind of market it’s in. Early-stage startups often put growth first. Later-stage companies, on the other hand, are usually expected to show operating discipline through steady cash generation.
As a rule of thumb, healthy SaaS companies often aim for free cash flow margins of 10% to 20% or more as a sign of long-term staying power.
Why can revenue grow while OCF margin falls?
Revenue can grow while OCF margin drops because revenue is based on accrual accounting, while cash flow shows the money that actually moves in and out of the business.
That gap usually shows up when cash gets stuck in working capital, like higher accounts receivable or more inventory sitting on the balance sheet. So even if sales are up, the business may be turning less of that revenue into cash it can actually use.
How should I track OCF margin over time?
Track operating cash flow (OCF) margin with the same reporting cadence each time, like monthly or quarterly snapshots, so you can see trends in cash generation more clearly. A line chart works well here. An interactive dashboard with live updates is even better than a static report because it lets you spot changes as they happen.
Lucid Financials can help keep revenue and expense categorization accurate, which cuts down on data distortions and makes it easier to show operational efficiency as you scale.