If I only look at total revenue, I can miss the part that matters most: which revenue streams actually make money.
Good reporting fixes that fast. It shows me revenue by stream, gross margin by segment, retention by cohort, and unit economics like LTV:CAC and CAC payback. That helps me decide where to spend, what to fix, and what to stop.
At a glance, here’s what strong reporting lets me see:
- Recurring vs. one-time revenue so short-term spikes do not distort forecasts
- Margin by product, channel, or customer segment so I know where profit comes from
- Churn, GRR, and NRR so I can judge whether revenue will hold
- CAC, LTV, and payback period so growth does not drain cash
- Automated reporting so numbers stay current and error risk drops
A simple example makes the point. Two streams can each bring in $50,000 in a month. But if one runs at 80% gross margin and the other at 35%, they should not get the same weight in planning. The same goes for customer cohorts: one group might reach 118% NRR, while another drops to 90% over time.
In short: better reporting turns revenue from a single top-line number into a working decision tool.
Make Revenue Reporting Actionable For Your Organization
sbb-itb-17e8ec9
The Problem: Weak Reporting Hides Revenue Stream Profitability
Most startups already have the raw data. What they don’t have is reporting that makes it plain which revenue streams make money and which ones just add noise.
Aggregated Revenue Hides Margin Differences by Stream
The main issue isn’t revenue volume. It’s hidden profit by stream.
When every dollar rolls up into one top-line figure, the economics behind each stream disappear. A $50,000 services contract and $50,000 in monthly recurring subscription revenue can look the same on a summary report. In practice, they’re not even close.
The services contract might come with a gross margin of 30%–40% after direct labor, project management, and other related costs. The $50,000 in MRR might come with 70%–85% gross margins, plus more predictable renewals and clearer lifetime value and payback visibility. If you treat both as equal revenue, you skew every decision that follows: hiring, pricing, channel spend, and runway models.
Subscription, services, and setup revenue each have different margins, different predictability, and different room to scale. They need to be reported on their own.
When those streams get blended together, total revenue can grow while actual business quality quietly deteriorates. Often, nobody spots it until a fundraise or board review puts the numbers under a microscope.
Manual Reporting Delays Insight and Adds Errors
Even if the data is there, manual reporting slows the close and makes people trust the numbers less.
Lean finance teams often pull billing, CRM, payroll, and bank data into spreadsheets by hand. That’s where reconciliation mistakes creep in. Month-end close can slip by weeks, which means teams make calls based on old information. If implementation and setup fees are classified one way in June and another way in July, those two months stop being comparable.
That creates a bad pattern during investor and board meetings. Instead of talking about strategy, people spend time checking whether the numbers are right. During a raise, that’s the last thing you want.
Poor Visibility Leads to Weak Spending Decisions
Reporting gaps don’t just cause confusion. They lead to expensive decisions.
If gross margin isn’t visible by channel or segment, teams can chase revenue growth without knowing what that growth costs. A paid acquisition campaign may look strong on lead volume alone. But if those customers churn fast or need heavy support, unit economics can slip into the red.
The same blind spot affects burn. When stream-level variable costs, like contractor hours tied to services work, aren’t tracked well, burn can be understated. And if cohort data isn’t split by stream or acquisition source, early warning signs in retention stay buried until the problem is big enough to hit revenue in a material way. At that point, fixing it takes more time and more money.
That’s why reporting needs to track revenue by stream, margin, and retention.
The Fix: Build Reporting Around Revenue, Margin, and Retention
The fix is simple in theory: make stream-level profit visible in every report. That starts with three things: the right reports, the right metrics, and a clean split between recurring and non-recurring revenue.
Use the Right Reports for Profitability Analysis
A Profit and Loss (P&L) statement, a revenue breakdown by product or customer type, and segment-level profitability reporting do most of the heavy lifting.
The P&L only works if revenue and COGS are split by stream. When you separate subscriptions, one-time fees, and services on the P&L, you can see right away whether margin is getting better or just being hidden by more volume. If Enterprise plans drive 60% of revenue but only 30% of gross profit, a well-structured P&L makes that plain. On a blended report, that signal gets lost.
Revenue breakdowns by segment - SMB, mid-market, enterprise, or vertical - show which customer groups produce the best margins and retention. That makes it easier to spot the parts of the business where growth is most repeatable. Segment-level profitability goes one step further by subtracting cost to serve. Now each stream’s true margin is out in the open, and founders can tell whether a revenue stream scales well or gets more expensive as it grows.
These reports set the structure. Then you need to fill them with metrics that tell the truth.
Track the Metrics That Show Revenue Stream Quality
Revenue by itself does not tell you much about stream quality. The metrics below show whether a revenue stream is healthy, scalable, and worth pushing harder.
| Metric | What It Measures | Format |
|---|---|---|
| MRR / ARR | Contracted recurring revenue per month / annualized recurring revenue | USD (e.g., $85,000 / $1,020,000) |
| MoM / YoY Growth | Rate of MRR or revenue change over time | Percentage (e.g., 8.5%) |
| Gross Margin | (Revenue − COGS) ÷ Revenue | Percentage (e.g., 78%) |
| Contribution Margin | Gross margin minus variable operating costs | Percentage or USD per stream |
| CAC | Sales and marketing spend ÷ new customers acquired | USD per customer (e.g., $1,200) |
| LTV | ARPU × Gross Margin % ÷ Monthly Churn Rate | USD per customer (e.g., $9,500) |
| LTV:CAC | LTV divided by CAC | Ratio (e.g., 4.0x) |
| CAC Payback Period | Months for gross profit to recover CAC | Months (e.g., 14 months) |
| Net Revenue Retention (NRR) | Revenue change from existing customers after expansion, contraction, and churn | Percentage (e.g., 118%) |
One detail matters a lot here: calculate LTV on gross margin, not raw revenue. If you use raw revenue, LTV looks better than it is. And that can push a team into bad decisions. As a rule of thumb, treat LTV:CAC below 2x and CAC payback above 18 months as warning signs.
These metrics also need fixed definitions. If MRR is calculated one way in Q1 and a different way in Q3, the trend line stops meaning anything. Write down the formula, the inputs, and any exclusions in an internal metrics handbook so the numbers don’t drift over time.
Separate Recurring Revenue From One-Time Revenue
Recurring subscription revenue is contract-based and predictable. One-time implementation fees and project-based services are not.
When those revenue types are blended together, flat MRR can hide behind one-time spikes. A jump in implementation projects may lift the top line for a month, but if those projects do not repeat, cash inflows fall the next month. Forecasts built on blended revenue tend to overstate future runway.
This also affects valuation. Investors price recurring-revenue businesses based on ARR, growth rate, and NRR. If a meaningful share of reported ARR is actually non-recurring services, due diligence can strip that out fast. The fix is direct: set up separate account codes in the chart of accounts for subscription revenue, one-time fees, and service-based revenue. Then make sure every invoice is classified the same way every time.
Once that split is clean, dashboards and forecasts can show true revenue quality in real time.
How Reporting Turns Raw Data Into Revenue Insight
Once revenue is split cleanly, reporting shows what to scale, what to fix, and what to cut. After you break revenue out by stream, the next job is to read the margin, retention, and payback behind each one.
Revenue Stream Dashboards Show Growth and Margin by Segment
A revenue stream dashboard works best when each segment - subscriptions, implementation services, and usage-based fees - has its own row with the same metrics. That setup makes comparison simple. You can scan across the table and spot healthy streams fast, instead of piecing the story together from mixed numbers.
Here’s what that can look like for a B2B startup:
| Stream Type | Monthly Revenue (USD) | Contribution Margin % | Churn Rate % (monthly) | CAC Payback Period (months) |
|---|---|---|---|---|
| Subscriptions (SaaS) | $150,000 | 72% | 3% | 8 |
| Implementation Services | $60,000 | 38% | Not recurring | 4 |
| Usage-Based Fees | $40,000 | 65% | 6% monthly revenue churn | 6 |
In this example, subscriptions lead on both revenue and contribution margin, with an 8-month CAC payback. That stream can carry more sales and product spend. The weaker streams need work on pricing, retention, or cost structure first.
That’s the big win of the dashboard. It cuts through opinion. Instead of arguing about where time and budget should go, you’re looking at numbers that point to the answer.
Cohort and Retention Reporting Shows Revenue Durability
Top-line MRR growth can look fine even while the customer base is slowly slipping away. Cohort reporting fixes that. It groups customers by the month they first paid, then tracks how much of that starting revenue is still there - or has grown - over time.
| Cohort (Start Month) | Month 0 Revenue (USD) | Month 3 Retained % | Month 6 Retained % | Month 12 Retained % | Month 24 Retained % |
|---|---|---|---|---|---|
| Jan 2025 | $50,000 | 95% | 102% | 110% | 118% |
| Feb 2025 | $55,000 | 93% | 99% | 104% | 112% |
| Mar 2025 | $60,000 | 88% | 92% | 96% | 90% |
The January 2025 cohort grows to $59,000 by month 24, or 118% NRR. That means expansion is beating churn. The March cohort tells the opposite story: retention falls to 90% by month 24, so that group is losing value over time. If a founder sees that pattern, it’s a cue to dig in. Did pricing change? Did onboarding slip? Did a product update miss the mark? Did a new acquisition channel bring in weaker-fit customers? Those are the kinds of issues to fix before pushing that segment harder.
This reporting also separates gross revenue retention (GRR) from net revenue retention (NRR). When the gap between them gets too wide, churn may be worse than it looks, with expansion covering it up for a while. That’s worth seeing early.
If a stream can hold revenue over time, the next question is simple: does that growth still make financial sense?
Unit Economics Reporting Connects Revenue to Cost to Serve
Unit economics reporting answers one question: does growing this revenue stream create value, or does it just burn more cash?
Take a B2B startup with two streams. The self-serve subscription segment has an ARPU of $80 per month, a contribution margin of $60 per month per customer, an average customer lifetime of 30 months, and a CAC of $450. That puts LTV at $1,800 and LTV:CAC at 4:1, with a CAC payback of 7.5 months. That’s well within the healthy range.
Now compare that with the enterprise implementation stream. It brings in $25,000 per project with a 40% contribution margin, or $10,000 after delivery costs, and a $5,000 CAC. If most clients buy once, LTV is $10,000 and LTV:CAC drops to 2:1. That can still be useful revenue, but it’s probably not the main growth engine.
Use 3:1 as the baseline for LTV:CAC. If a stream falls below 2:1, it needs changes to pricing, retention, or cost before you pour more money into it.
Once these numbers are reported by stream instead of blended across the company, the next move is automation.
From Manual Spreadsheets to Real-Time Reporting
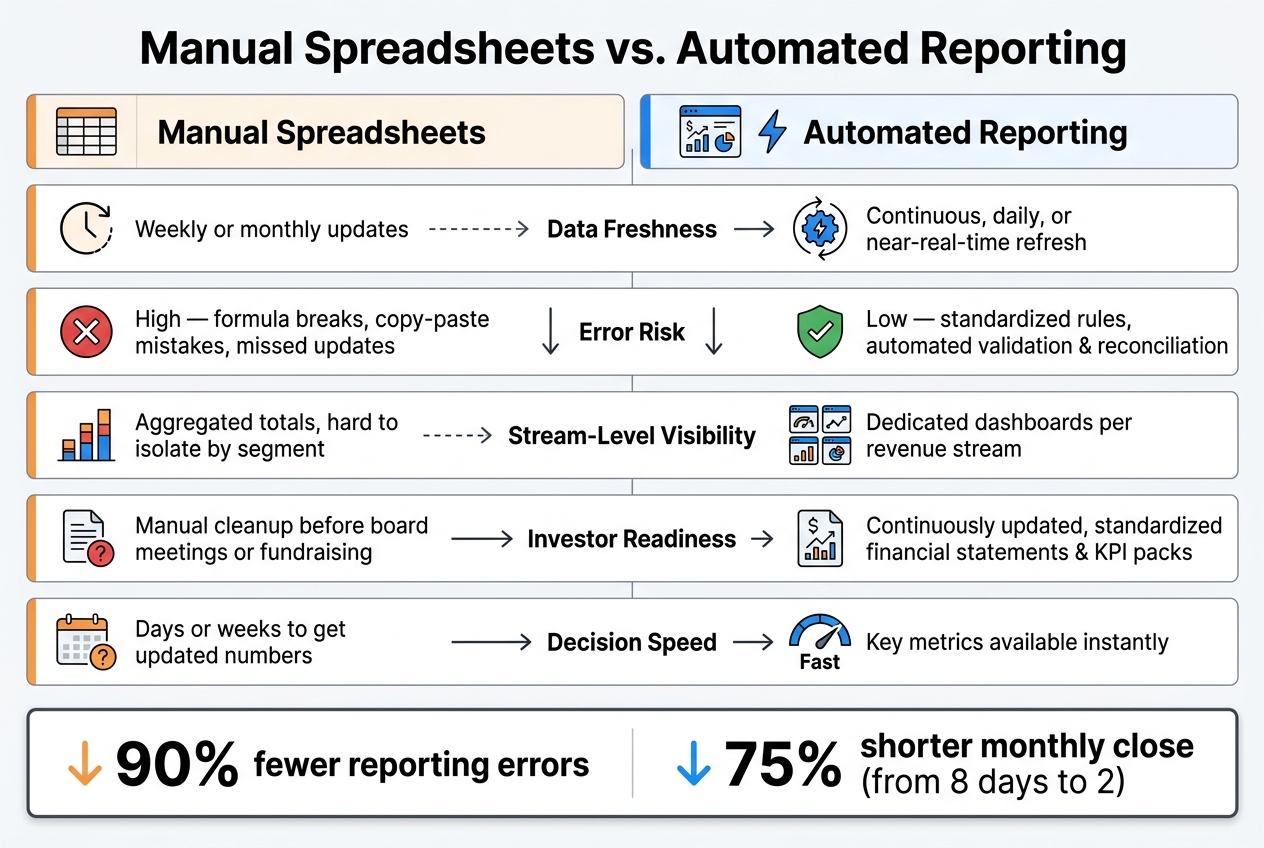
Manual vs. Automated Reporting: Key Metrics for Revenue Analysis
Why Automated Reporting Improves Speed and Accuracy
Once revenue is split by stream, the next choke point is keeping reports up to date. Early-stage startups often export data from Stripe, Shopify, billing tools, and CRM systems, then stitch it together in spreadsheets. That setup falls apart fast. By the time a founder opens the report, the numbers can already be 30 days old, which means hiring, pricing, or marketing spend may be based on data that no longer matches what’s happening in the business.
Manual work also fails in small, annoying ways that turn into big reporting problems. One broken VLOOKUP, one copied formula, or one skipped month can throw off MRR and margin. Automated reporting helps cut those risks. It can reduce reporting errors by up to 90% and shrink the monthly close by as much as 75% - from eight business days to two.
| Dimension | Manual Spreadsheets | Automated Reporting |
|---|---|---|
| Data freshness | Weekly or monthly updates, based on when someone downloads and cleans data | Continuous, daily, or near-real-time refresh |
| Error risk | High - formula breaks, copy-paste mistakes, and missed updates | Low - standardized rules, automated validation, and reconciliation |
| Stream-level visibility | Aggregated totals, hard to isolate by segment | Dedicated dashboards per revenue stream |
| Investor readiness | Manual cleanup before board meetings or fundraising | Continuously updated, standardized financial statements and KPI packs |
| Decision speed | Days or weeks to get updated numbers | Key metrics available instantly |
The big shift is simple: instead of waiting on a spreadsheet cleanup project, finance teams and founders can work from numbers that are current and easier to trust.
How AI-Powered Reporting Supports Finance Teams
AI-powered reporting tools push this further. They can classify transactions, reconcile bank data, and flag odd activity - like refund spikes or unusual charges - before those issues distort the numbers. So instead of getting a last-minute snapshot, founders get a live view of profit and loss and cash.
That matters more than it sounds. A live P&L changes the tone of decision-making. You’re not guessing from stale reports or asking someone to “pull the latest version.” You can see what changed, where it changed, and whether it needs action now.
For startups that want that kind of visibility without the spreadsheet mess, AI-enabled finance support removes the reporting bottleneck. Lucid Financials combines bookkeeping, tax services, tax credits, and CFO support in one platform. It also offers Slack-based answers on burn, gross margin, and runway, plus clean books in seven days and always-on investor-ready reporting.
Conclusion: Better Reporting Makes Revenue More Actionable
Top-line revenue growth is easy to cheer for. It’s also easy to misread. What matters more is which revenue streams make money, which customers stick around, and whether unit economics support more spend. A report that only shows the company total hides all of that.
Moving from monthly spreadsheet rollups to real-time, stream-level dashboards changes how founders put money to work, manage runway, and speak with investors. Instead of defending numbers that are weeks old, they can point to current margin by segment, cohort retention across 6 to 24 months, and LTV:CAC by product line. That gives them a cleaner story - and one that’s easier to back up.
Better reporting makes every growth decision more grounded.
FAQs
What should I track by revenue stream first?
Start by mapping out each revenue stream, whether that’s subscription fees, one-time sales, or licensing revenue. Then pull together 12 to 24 months of monthly past data for each one. That gives you a clean baseline and helps you spot seasonality instead of guessing at it.
From there, use tags to sort the analysis by product line, customer segment, or region. That way, you can see where money is coming from and how each part of the business is performing. Lucid Financials can bring this data together in real time, which makes it easier to track profitability and growth trends as they change.
How often should I review revenue and margin reports?
Don’t rely on monthly or quarterly reports alone. Update your forecasts at least once a month, or any time major new data comes in.
With Lucid Financials, you can track revenue and margin metrics in real time using dynamic dashboards and Slack integrations. That said, regular reviews still matter. They help you check the data and make sure decisions stay aligned with business performance.
When should a startup automate revenue reporting?
Startups usually need to automate revenue reporting once manual work stops scaling. That tends to happen when monthly transactions climb from the hundreds into the thousands. At that point, spreadsheets and hand-built reports start eating up time, and mistakes become a lot more likely.
Automation also matters when the business needs up-to-date visibility into cash flow. The same goes for companies dealing with more complicated revenue streams, preparing for fundraising, or getting numbers ready for board meetings. When leaders need answers fast, manual reporting often can't keep up.