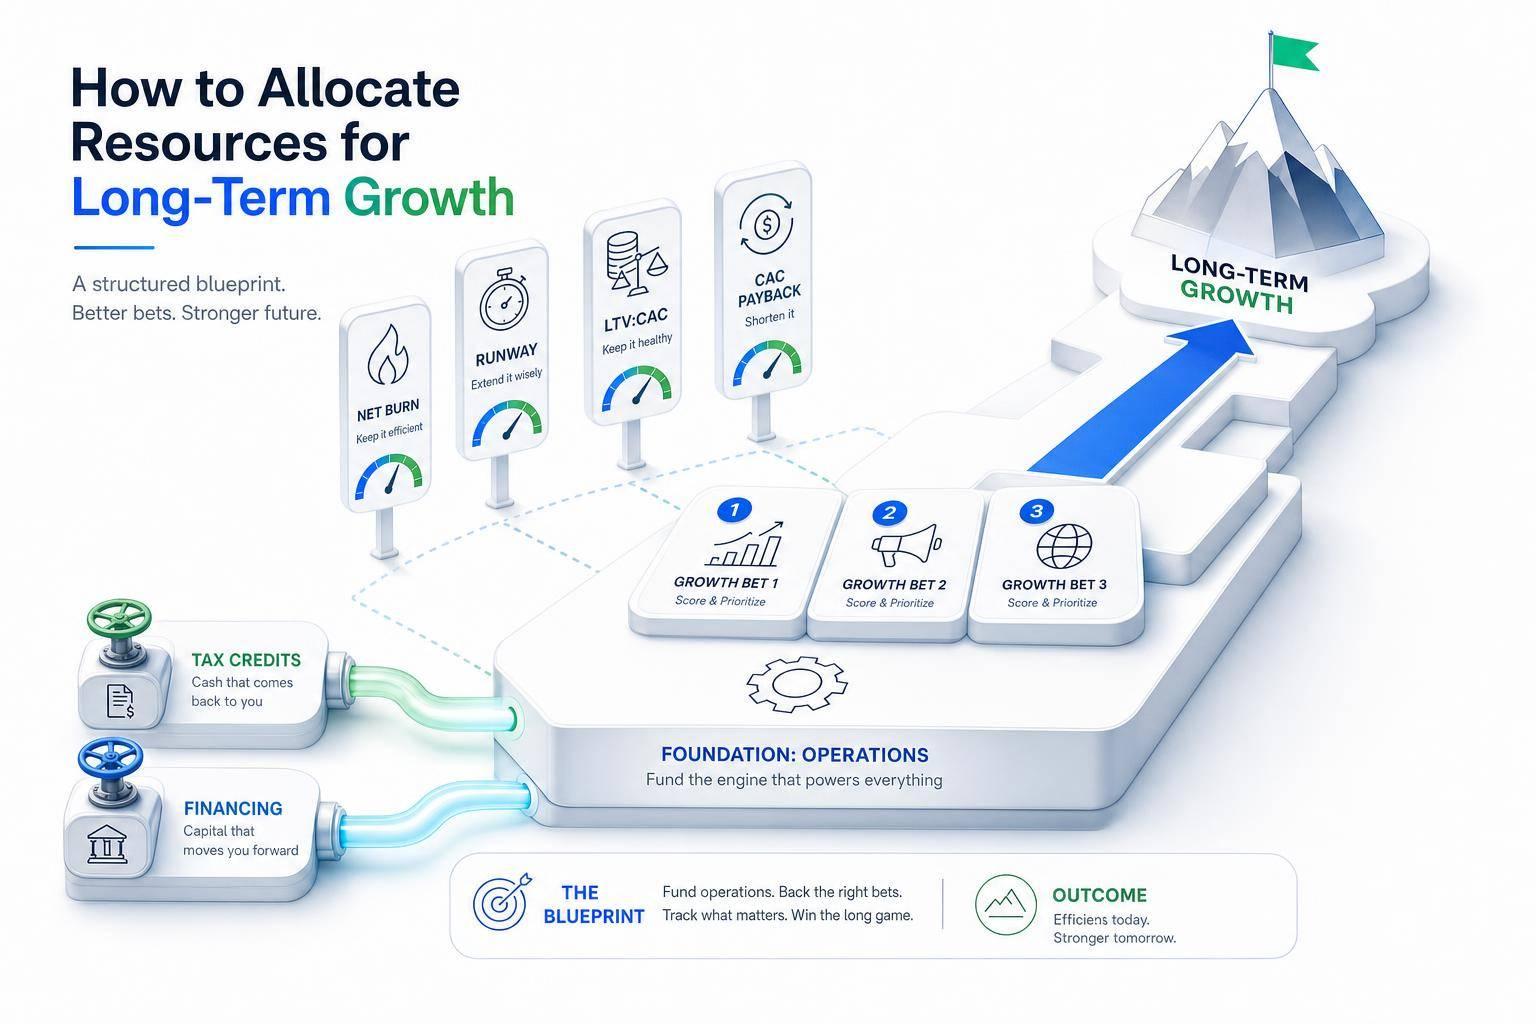
Growth can hurt your startup if each new sale adds too little cash. I’d sum up the article like this: contribution margin shows how much revenue is left after the costs that move with each customer, and that number has a direct effect on burn, runway, CAC payback, LTV, and break-even.
Here’s the short version:
- I look at contribution margin, not just revenue, to see if growth is helping or draining cash.
- A startup with a 70% contribution margin can often fund growth far better than one at 20%, even with slower revenue growth.
- Small shifts in unit economics can change runway in a big way. In the article’s example, moving from 60.0% to 25.0% contribution margin changes burn from $10,000/month to $150,000/month on the same $400,000 in monthly revenue.
- I use contribution margin to check:
- CAC payback
- LTV
- Break-even volume
- Segment profitability
- Weak spots often show up in:
- low-priced plans
- high-support customers
- usage-heavy accounts
- discount-heavy channels
- The fix usually comes down to:
- cutting variable cost per customer
- changing pricing or packaging
- improving retention
- reviewing margin by segment every week
A simple example makes the point fast: if I charge $100/month, spend $30 to serve that customer, and pay $420 to acquire them, monthly contribution is $70 and CAC payback is 6 months. If service cost climbs, payback gets longer and growth gets harder to fund.
The main takeaway: top-line growth can look good while unit economics get worse. If contribution margin slips, revenue growth can turn into a cash problem.
Contribution Margin: Analysis, Formulas, and Business Strategy
sbb-itb-17e8ec9
The Problem: Weak Contribution Margin Makes Growth More Expensive
Contribution Margin vs. Gross Margin: Startup Unit Economics Explained
When contribution margin is weak, each new dollar of growth gets harder to pay for. That’s the real issue here. Not the term itself, but what it does to the business.
Contribution Margin vs. Gross Margin in Startup Unit Economics
Gross margin and contribution margin often get treated like the same thing. They’re not.
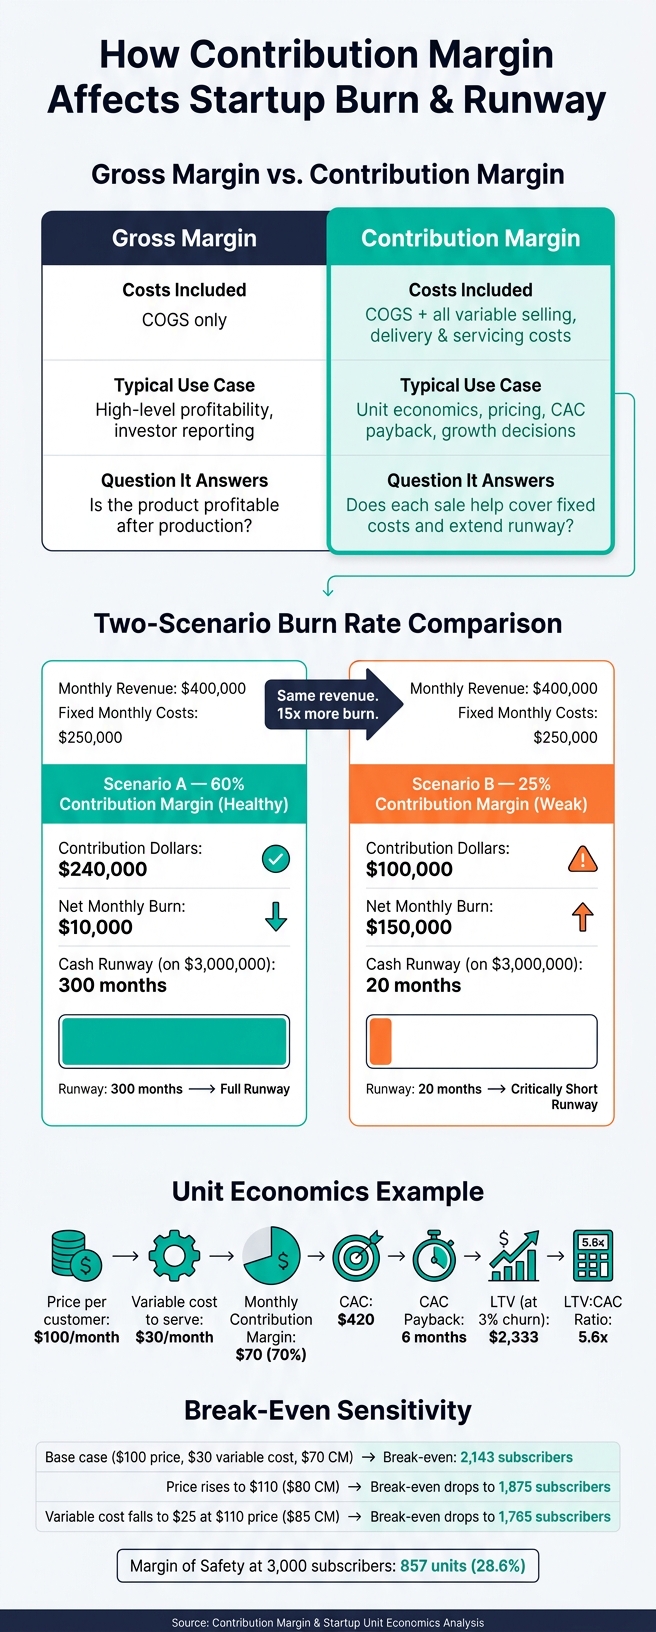
Gross margin stops at cost of goods sold (COGS), which means the direct cost to make or deliver the product. Contribution margin goes a step further. It includes all variable costs tied to each sale, like payment processing fees, usage-based cloud infrastructure, sales commissions, support time, refunds, and shipping.
| Metric | Gross Margin | Contribution Margin |
|---|---|---|
| Costs included | COGS only | COGS + all variable selling, delivery, and servicing costs |
| Typical use case | High-level profitability, investor reporting | Unit economics, pricing, CAC payback, growth decisions |
| Question it answers | Is the product profitable after production? | Does each sale help cover fixed costs and extend runway? |
That gap is where many startups get tripped up. A company can look fine on gross margin and still struggle once the rest of the variable costs show up. For startups, that difference shapes whether scale gives you more runway or burns through it faster.
How Low or Negative Contribution Margin Increases Burn
The effect on burn is direct. Say a startup brings in $400,000 in monthly revenue and has $250,000 in fixed monthly costs.
At a 60.0% contribution margin, it produces $240,000 in contribution dollars. That almost covers fixed costs, leaving net burn at only $10,000/month.
Now drop the margin to 25.0%. Contribution dollars fall to $100,000, and net burn jumps to $150,000/month.
On $3,000,000 in cash, that’s the difference between 300 months of runway and 20 months.
The drivers behind weak contribution margin are usually pretty easy to spot:
- Plans priced too low while packing in high-cost features
- Discounting that pushes price below variable cost
- Costs being tagged the wrong way, like support teams or usage-based infrastructure being treated as fixed overhead
Here’s what that can look like in practice. A B2B SaaS startup charging $49/month with $40 in average variable costs per account, including support time, API fees, and payment processing, keeps only $9 in contribution. That works out to 18.4%.
The plan may bring in customers. But it doesn’t do much to cover fixed costs.
That margin gap is what decides whether growth brings in cash or drains it.
How Contribution Margin Shapes Growth Decisions
Linking Contribution Margin to CAC Payback, LTV, and Customer Profitability
Monthly contribution margin per customer is what you should use to work out CAC payback. The formula is simple: CAC payback = CAC ÷ monthly contribution margin per customer.
Here’s what that looks like in practice. If your monthly subscription price is $100, your variable cost to serve each customer is $30 for things like payment processing, usage-based infrastructure, and support, and your CAC is $420, then your monthly contribution margin is $70. That puts payback at exactly 6 months.
That detail matters more than it may seem at first glance. If you use gross margin instead, payback can look shorter than it is. And when acquisition looks faster on paper, it’s easy to spend more than the business can safely carry.
Once payback is clear, LTV and break-even math make it easier to see how much growth the business can fund.
Contribution-margin LTV gives a cleaner view of customer value. Contribution-margin LTV = monthly contribution margin per customer ÷ monthly churn rate. With a $70 monthly contribution margin and 3% monthly churn, LTV comes out to about $2,333. Against a $420 CAC, that works out to an LTV:CAC ratio of about 5.6x - which lands in the 3–5x range many growth-stage investors look for.
That same contribution margin also sets the terms for break-even volume and shows how much room a plan has if things don’t go perfectly.
Using Break-Even and CVP Analysis to Test Growth Plans
CVP analysis is useful because it shows whether a growth plan can cover fixed costs at the volume you expect. The formula is direct: Break-even units = fixed costs ÷ contribution margin per unit. Change the price or the variable cost, and the break-even point moves right away.
Using the same numbers - $150,000 in monthly fixed costs, a $100 price, $30 in variable cost, and a $70 contribution margin - a startup needs 2,143 subscribers to break even. If the price rises to $110, break-even drops to 1,875 subscribers. If variable costs then fall to $25 per customer at that new price, break-even drops again.
Margin of safety adds another layer. It shows how much volume you can lose before you fall below break-even. If the plan calls for 3,000 subscribers and break-even is 2,143, the margin of safety is 857 subscribers, or about 28.6% of planned revenue. When that cushion is thin and contribution margin is already weak, the plan can unravel fast.
Even so, averages can smooth over problems that are hiding in plain sight.
Why Segment-Level Margin Matters More Than a Company-Wide Average
A company-wide average can hide weak spots at the segment level. The most useful cuts tend to be by:
- Pricing tier
- Acquisition channel
- Customer segment
- Cohort
Each one helps show where margin is leaking and where it scales.
Cohort-level tracking is especially helpful because it shows whether contribution margin gets better or worse over time as customers expand, churn, or change how they use the product. Investors are paying more attention to this cohort view than to company-wide averages because it shows whether each new group of customers is producing more contribution or less over time.
The next move is to use that segmented view to cut costs, rework pricing, and improve retention.
Lucid Financials can automate segmented reporting from bookkeeping, CAC, and cost data into investor-ready dashboards by plan, channel, and cohort.
Solutions: How Startups Can Improve Contribution Margin
Once you know where margin is leaking, fix the most expensive drivers first.
Cut Variable Cost-to-Serve Before Scaling Spend
Start by lowering the variable costs tied to each customer. Look closely at cloud hosting, third-party vendor fees, payment processing rates, and support labor per account before you pour more money into growth.
A simple audit of essential financial metrics can show where cash slips away. Maybe a vendor fee has crept up. Maybe support takes too many manual hours. Maybe one acquisition channel brings in customers who barely add any contribution.
A few moves can help:
- Automate onboarding and support where it makes sense, so labor per account drops
- Cut channels with weak payback or low contribution
- Review service and infra costs line by line before adding more spend
Every cut here lifts contribution per customer and shortens CAC payback.
Adjust Pricing, Packaging, and Retention to Raise Unit Contribution
After trimming variable costs, work on increasing the contribution each customer brings in.
Review pricing tiers to make sure they match the actual cost to serve each customer. If some features cost a lot to deliver, move them into higher-priced plans. That way, margin improves without stripping out value.
Retention matters too. If you reduce churn in high-contribution segments, you lift LTV without taking on more acquisition cost. That’s one of the cleanest ways to improve unit economics.
Even small pricing changes can add up fast. A $10 increase in monthly price on a plan with $30 in variable costs lifts contribution margin from 70% to 75%. It also improves break-even volume and CAC payback at the same time.
Build a Recurring Contribution Margin Review Process
Once you’ve made cost cuts and pricing changes, make sure the gains stick. Contribution margin should be part of a weekly review, not just something you check now and then.
Track it by segment, plan, and cohort. That makes it easier to spot rising costs or weak channels before they start eating into runway.
This gets much easier when your numbers update on their own. Lucid Financials supports this with AI-powered bookkeeping, real-time forecasts, and investor-ready reporting. With Slack integration, founders can check runway, spend, and performance in real time.
Conclusion: Use Contribution Margin as a Control Lever for Growth
CVP analysis only works when contribution margin stays in view as you grow. As the business scales, contribution margin needs to stay ahead of burn. Track it next to runway and burn so growth doesn’t move faster than cash coming in.
Review contribution margin on a regular basis, pressure-test growth scenarios before you spend, and use it to guide calls on hiring, pricing, and scaling. Think of it as the scoreboard for growth decisions: customer profitability, CAC payback, and break-even all depend on it. Lucid Financials can keep that data current across segments, plans, and cohorts without manual work.
If contribution margin starts to slip, growth turns into a cash problem before it looks like a revenue win.
FAQs
What is a good contribution margin for a startup?
For SaaS startups, a strong contribution margin usually falls between 70% and 85%. Top performers often land close to 80%. If the margin drops below 60%, that’s usually a warning sign.
At the end of the day, a good contribution margin does two jobs: it helps cover fixed costs, and it leaves enough profit to support long-term growth and meet investor expectations.
How often should I review contribution margin by segment?
Review contribution margin by segment monthly so it lines up with broader financial reporting and leadership reviews.
You can still watch top-line shifts day by day. But the standard cadence is a monthly 60–90 minute leadership review to compare actuals vs. forecasts, spot variances, and make adjustments.
Can a startup grow fast with a low contribution margin?
A startup can grow revenue with a low contribution margin, but that usually doesn’t last long.
Here’s the plain-English version: contribution margin is the money left after variable costs. That leftover amount helps pay for fixed expenses like operations, R&D, and marketing. If the margin is low, there’s not much left to work with.
That creates a tough situation. Each new sale adds only a small amount toward fixed costs, which means growth can lean heavily on outside capital. Revenue may go up, but the business can still struggle underneath the surface.
When contribution margin stays weak, burn rate can climb and runway can get shorter. The company keeps moving, but it has less room for mistakes and less cash to support growth.