I use AI cash forecasts to spot possible shortages before payroll, rent, taxes, or debt payments come due. Start with current bank balances and clean records, then build a 13-week forecast for each entity - not just a combined total.
The goal isn’t just to predict a balance. It’s to answer: When could cash run short, why, and what can we do?
Here’s the process I follow:
- Prepare the data: Check bank, billing, accounting, and payment records.
- Test the forecast: Compare predictions with actual cash and show uncertainty.
- Watch for risks: Track late collections, expense spikes, clustered payments, and reserve breaches.
- Plan a response: Test scenarios, such as a two-week collection delay or a 10% drop in appointments, and assign an owner to each alert.
- Check results and protect data: Review alerts before acting, limit access, and measure missed shortages and false alarms.
<u>AI supports the decision; it doesn’t make it.</u> I verify alerts against records before changing payments or spending.
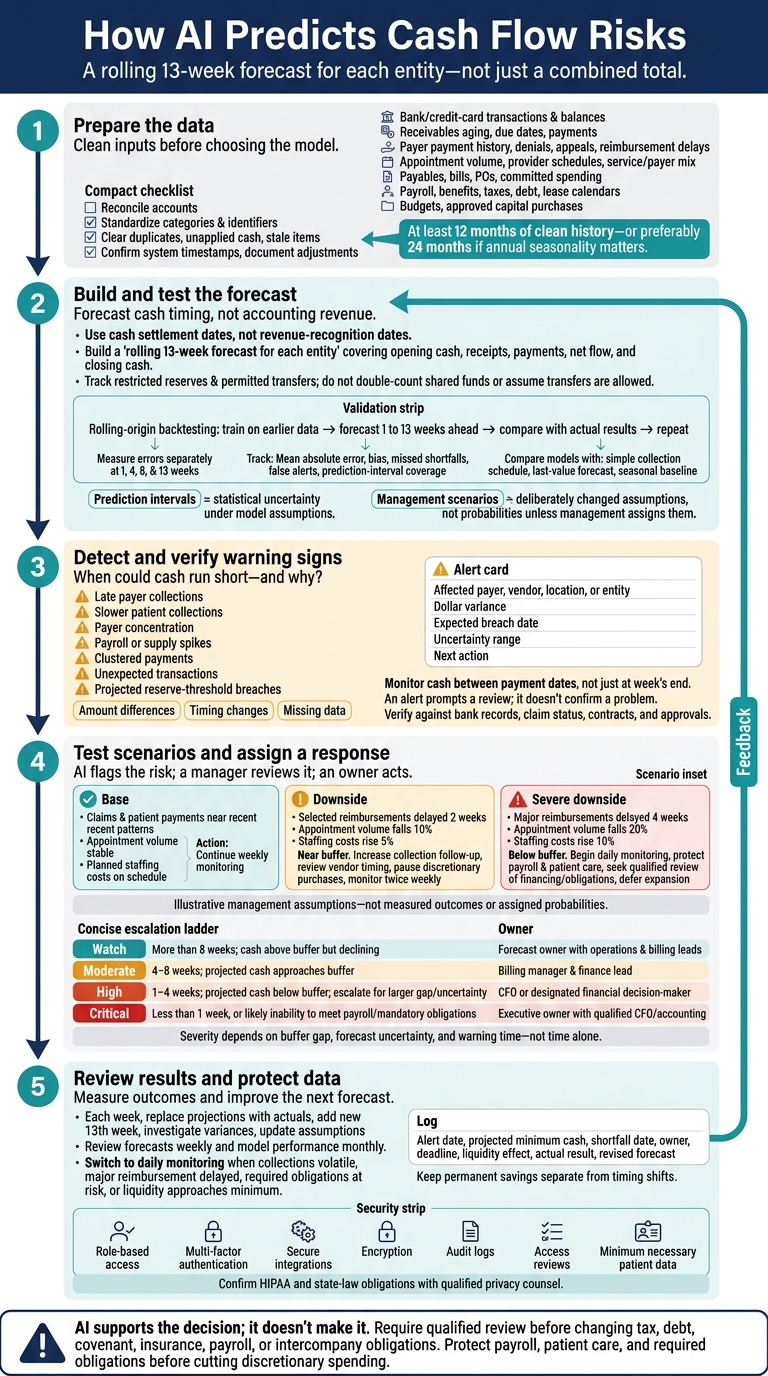
How AI Predicts Cash Flow Risks
Data and Models for AI Cash Forecasts
Prepare Financial and Practice Data
Once you’ve set the forecast structure, feed it clean, current data. AI can flag cash risk only when inputs accurately reflect timing, ownership, and obligation dates.
Clean the inputs before choosing the model. Reconcile bank and credit-card accounts through the latest close, then update bank balances. Standardize categories and identifiers for payers, vendors, locations, and entities. Apply receipts to the correct invoices or claims. Clear duplicates, unapplied cash, and stale open items. Use at least 12 months of clean history - or preferably 24 months if annual seasonality matters.
| Input checklist | Forecasting purpose | Risk from missing or stale data |
|---|---|---|
| ☐ Reconciled bank transactions and current balances | Establish opening cash | Incorrect balances distort every projected week |
| ☐ Receivables aging, due dates, and applied payments | Estimate collections | Paid or disputed items inflate receipts |
| ☐ Payer payment history, denials, appeals, and reimbursement delays | Estimate timing and collectibility | Contract terms overstate collection speed |
| ☐ Appointment volume, provider schedules, service-line mix, and payer mix | Link activity to future cash | Volume and payer-mix changes go undetected |
| ☐ Payables, approved bills, purchase orders, and committed spending | Time vendor payments | Unrecorded obligations are omitted |
| ☐ Payroll, benefits, taxes, debt, and lease calendars | Account for scheduled obligations | Payments are mistimed or omitted |
| ☐ Budgets and approved capital purchases | Include planned spending | Committed cash appears available |
| ☐ Consistent categories and separate entity records | Attribute cash and obligations | Pooled balances hide entity shortages |
| ☐ Connected-system timestamps and documented manual adjustments | Confirm data is current | Stale feeds create false precision |
Build and Update Rolling Cash Forecasts
Build the rolling forecast with the cleaned data. Identify payer-specific collection patterns, seasonal appointment changes, denial delays, payroll cycles, and location expenses. Use cash settlement dates, not revenue-recognition dates. Put known obligations on their scheduled payment dates, and use models to estimate uncertain receipts and variable spending. Retrain only when data shifts or performance slips.
The forecast should do more than project balances. It should show where cash timing could break down.
Replace each completed week with actual results, then roll the forecast forward one week. Before changing assumptions, investigate variances by payer, category, location, and entity.
Keep consolidated cash separate from entity-level cash. Track restricted reserves and permitted transfers explicitly. Don’t double-count shared funds or assume one entity’s cash can cover another’s payroll.
Choose Models and Measure Uncertainty
With clean data in place, choose the simplest model that fits the cash pattern. Base the choice on data volume, frequency, forecast horizon, seasonality, and explainability - not novelty. Compare each candidate against a simple collection schedule, last-value forecast, or seasonal baseline.
Use rolling-origin backtesting: train on earlier data, forecast 1 to 13 weeks ahead, compare predictions with actual results, and repeat. Track mean absolute error, bias, the percentage of cash-shortfall weeks correctly identified, and errors during payroll and tax weeks. Check entity-level results, not just consolidated accuracy.
Different cash patterns need different models. Favor the model that reliably predicts shortfalls and explains their drivers clearly enough to guide action.
| Method | Suitable data | Strengths | Limitations | Interpretability |
|---|---|---|---|---|
| Regression | Structured history with appointments, payer mix, payroll, and expenses | Explains business drivers; supports scenarios | Needs well-defined features; may miss sequential dependencies | High to medium |
| ARIMA/SARIMA | Stable weekly or monthly receipts, payments, or balances; SARIMA adds seasonality | Strong baseline for limited data with trends or seasonal cycles | Struggles with structural breaks, external drivers, and irregular behavior | Medium to high |
| Bayesian structural time series | Time series with explanatory variables, interventions, holidays, or policy changes | Models trends and seasonality; produces probability distributions | Complex to maintain; depends on assumptions and priors | Medium to high |
| LSTM/GRU networks | Large, frequent, clean multivariate datasets with sufficient history | Learns nonlinear and long-range relationships | Data-hungry, hard to explain, prone to overfitting; often unnecessary for small practices | Low |
Keep prediction intervals separate from management scenarios. Intervals show statistical uncertainty under the model’s assumptions. Check that actual results fall within them at the expected rate.
Base, downside, and stress scenarios deliberately change assumptions about collections, appointments, denials, or spending. They aren’t probabilities unless management assigns probabilities to them. A historical model may miss a new disruption.
sbb-itb-17e8ec9
Build a 13-Week Cash Flow Forecast in 30 Minutes Using Claude AI
How AI Detects Cash Flow Warning Signs
Once the rolling forecast is live, AI flags differences that could lead to cash shortages.
AI reviews forecast variances by payer, vendor, location, and entity to find patterns that may signal a shortfall. Each alert should distinguish amount differences, timing changes, and missing data. Check bank activity and high-value transactions daily.
Give priority to approaching reserve breaches. Each alert should identify the affected payer, vendor, location, or entity, along with the dollar variance, expected breach date, uncertainty range, and next action.
Late Collections and Payer Concentration
Track payer payment timing, denials, appeals, 60- and 90-day aging, patient balances, and payer concentration. Adjust expected collection dates based on claim status. If a major payer’s backlog grows, delayed receipts can widen the projected cash gap.
Expense Spikes and Payment Timing
Compare payroll, overtime, supplies, equipment installments, estimated taxes, rent, and debt service against approved amounts and scheduled dates. Flag duplicate invoices, unfamiliar vendors, and payments made earlier than expected.
Even routine expenses can create a cash gap when due dates cluster before expected collections. Monitor cash between payment dates, not just at week’s end. Reimbursements that arrive after payroll cannot fund payroll on its due date.
Set Cash Thresholds by Location and Entity
Link each warning sign to the cash reserve at risk. Use each location’s operating threshold, including any lender-required minimum. Project when cash will cross that threshold, the expected shortfall, and how much warning time remains.
Review location and entity forecasts alongside consolidated totals. Don’t assume transfers between them are permitted.
| Signal | Data evidence | Cash impact | Suggested management response |
|---|---|---|---|
| Late payer collections | Longer payment times; rising aging, denials, or appeals | Receipts move into later weeks | Verify claim status and revise receipt timing |
| Slower patient collections | Falling point-of-service collections; growing patient balances | Lower near-term receipts | Review statements, payment plans, and front-desk procedures to address collection gaps |
| Payer concentration | Expected receipts depend heavily on a few payers | One delay creates a larger cash gap | Test payer-specific delays to assess whether reserves are sufficient |
| Payroll or supply spike | Spending exceeds approved amounts or normal patterns | Less cash available for fixed obligations | Confirm recurring costs and update spending assumptions |
| Clustered payments | Payroll, taxes, rent, and debt payments precede receipts | Temporary liquidity shortfall | Reschedule eligible payments and accelerate collections to close the gap |
| Unexpected transaction | Duplicate invoice, new vendor, or unexpected transfer | Possible unplanned outflow or control failure | Validate approvals and pause unverified payments |
| Projected threshold breach | Forecasted balance falls below the location or entity reserve | Liquidity risk on a specific date or week | Activate the response plan with an owner and deadline |
An alert prompts a review; it doesn’t confirm a problem. Check it against bank records, claim status, contracts, and approvals. Then record the result, corrective action, and revised assumption.
Turn Cash Risk Alerts Into Action
When AI flags a likely cash shortfall, assign an owner and track the response - don’t stop at detection.
Maintain a Rolling 13-Week Cash Forecast
Bring each shortfall alert into weekly cash control. Track opening cash, receipts, payments, net flow, and closing cash for each entity. Assign one forecast owner and name contributors for collections, payroll, payables, and financing. Each week, replace projections with actuals, add a new thirteenth week, and review variances before updating the forecast.
Switch to daily monitoring when collections become volatile, a major reimbursement is delayed, payroll or required obligations are at risk, or liquidity approaches the approved minimum cash balance. Use a 12-month plan for hiring, expansion, equipment, new locations, refinancing, or acquisitions.
Use the rolling forecast to check whether the cash buffer holds under downside assumptions.
Test Base and Downside Scenarios
Test collection delays, appointment declines, and expense increases against each entity’s approved buffer. This shows whether the planned response is enough.
Scenario Assumptions Buffer status Management response Base Claims and patient payments arrive near recent patterns; appointment volume stays stable; planned staffing costs occur on schedule. Above buffer Continue weekly monitoring, confirm collections, and approve only budgeted purchases. Downside Selected reimbursements are delayed by 2 weeks; appointment volume falls 10%; staffing costs rise 5%. Near buffer Increase collection follow-up, review vendor timing, pause discretionary purchases, and monitor twice weekly. Severe downside Major reimbursements are delayed 4 weeks; appointment volume falls 20%; staffing costs rise 10%; an unexpected repair occurs. Below buffer Begin daily monitoring, protect payroll and patient care, seek qualified review of financing and mandatory-obligation timing, and defer expansion.
If the downside case falls below the buffer, assign a response based on severity and the time available to act.
Match Actions to Risk Level and Warning Time
Use this matrix to assign owners and actions, not to automate spending decisions. AI flags the risk, a manager reviews it, the assigned owner acts, and the result is logged.
| Severity | Warning horizon and buffer status | Responsible owner | Management action |
|---|---|---|---|
| Watch | More than 8 weeks; cash remains above the buffer but shows signs of decline | Forecast owner with operations and billing leads | Validate assumptions, review payer concentration, follow up on aging claims, and monitor patient collections. |
| Moderate | 4–8 weeks; projected cash approaches the buffer | Billing manager and finance lead | Escalate claim follow-up and denial resolution, review patient-collection workflows, negotiate vendor terms where appropriate, and pause discretionary purchases that aren’t required. |
| High | 1–4 weeks; projected cash falls below the buffer; escalate for a larger gap or greater uncertainty | CFO or designated financial decision-maker | Begin daily monitoring, prioritize patient care and payroll, accelerate approved collections, defer discretionary purchases, and reassess hiring or expansion timing. |
| Critical | Less than 1 week, or likely inability to meet payroll or mandatory obligations regardless of warning time | Executive owner with qualified CFO or accounting review | Execute the documented contingency plan, confirm available liquidity, protect patient care and payroll, and obtain qualified review before changing tax payments, debt obligations, or intercompany transfers. |
Set severity based on the buffer gap, forecast uncertainty, and warning time.
Log the alert date, projected minimum cash, shortfall date, owner, deadline, liquidity effect, actual result, and revised forecast. Keep permanent savings separate from timing shifts. Require qualified review before changing tax, debt, covenant, insurance, payroll, or intercompany obligations. Protect payroll, patient care, and required obligations before cutting discretionary spending.
Check Forecasts, Apply Controls, and Review Results
Validate Forecasts and Protect Financial Data
When an alert fires, check the forecast against actual records before changing payments or assumptions. Reconcile bank and card activity with the ledger, receivables, payables, payroll, debt, taxes, and intercompany balances. Backtest in time order, using only data available on the forecast date. Measure errors separately at 1, 4, 8, and 13 weeks. Track missed shortfalls, false alerts, bias, and how often actual cash lands within the forecast range.
Keep models simple when data is limited. Archive every version and record its assumptions, overrides, approver, and reason. Review forecasts weekly and model performance monthly. After changes in payer mix, staffing, reimbursement rates, or billing systems, check results again for model drift. Use ranges rather than single estimates, and require qualified review for high-impact alerts.
Protect the process with role-based access, multi-factor authentication, secure integrations, encryption, audit logs, and access reviews. Collect only the financial fields needed for forecasting, and keep patient data to the minimum necessary. Confirm HIPAA and state-law obligations with qualified privacy counsel. Slack access also requires HIPAA-compliant safeguards.
How Lucid Financials Supports Cash Management
This workflow relies on up-to-date books, clean entity-level reporting, and fast review. Lucid Financials provides AI-supported bookkeeping, tax, and CFO services for medical practices and multi-entity owners. Its clean books, entity-level reporting, and Slack access can help with the reconciliation and review process described here. These services support financial operations but do not guarantee results.
Key Takeaways for Practice Owners
Follow the verification loop: clean data → test forecasts → protect data → review alerts → corrective action → measure outcomes. Keep each entity visible, use realistic forecast ranges, define cash buffers, and assign owners to alerts.
Check whether collections, expenses, payment timing, and entity transfers matched expectations. Then adjust assumptions without hiding unfavorable results. Measure results by warning time, missed shortfalls, and fewer emergency borrowings or late payments.
FAQs
Can I forecast cash risks with less than a year of data?
Yes. AI models work better with 12 to 24 months of historical data to spot seasonal trends, but you can flag cash risks with less. For younger companies, data quality, consistency, and ease of access matter more than volume.
Keep your books reconciled, your chart of accounts stable, and your core metrics labeled correctly. Rolling 6- to 13-week forecasts can help you spot cash flow gaps as you build your financial track record.
How do I set the right cash buffer for my business?
Use predictive cash flow and burn forecasts to spot cash gaps 30–60 days ahead. Build them with reliable receivables aging, vendor payment history, and historical burn data. Set cash-balance alerts that prompt action, and use 30-day forecasts for short-term needs and 90-day forecasts to plan runway and hiring.
Size your cash buffer around base, optimistic, and worst-case scenarios, accounting for delayed revenue or cost spikes. Compare forecasts with actual results each month to recalibrate and retrain your forecasting model as patterns change.
How can I tell if an AI cash alert is reliable?
Reliable AI cash alerts need clean data, human review, and regular checks. Make sure financial data uses consistent labels and stays synced through secure, real-time API connections. Use explainable AI features to see which inputs triggered each alert.
Have someone review alerts in context, accounting for contract changes or market shifts. Regularly compare predictions with actual results to check for model drift.