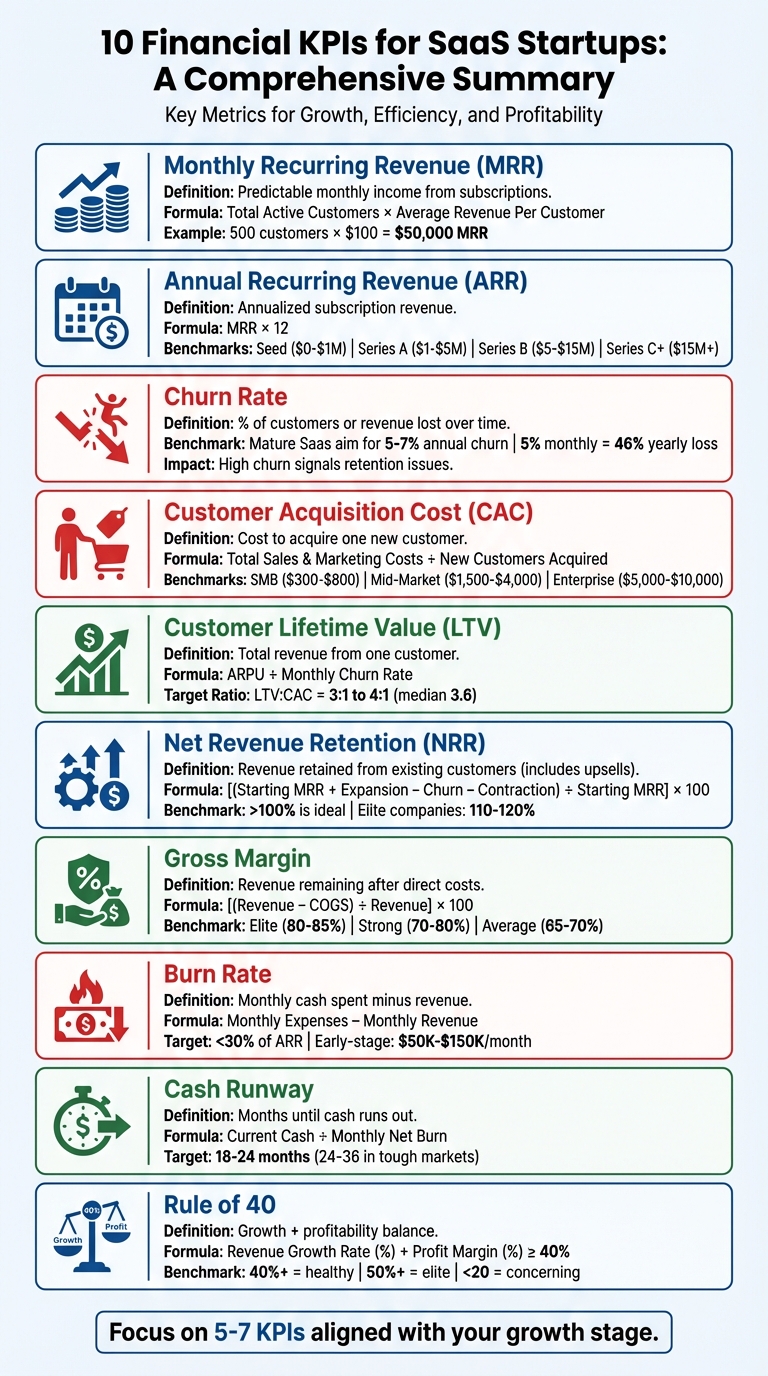
Tracking the right KPIs is critical for SaaS startups to grow efficiently and attract investors. These metrics reveal how well your business is performing, help identify areas for improvement, and guide strategic decisions. Here's a quick breakdown of the 10 most important financial KPIs every SaaS founder should know:
- Monthly Recurring Revenue (MRR): Measures predictable monthly income from subscriptions. Key for tracking growth.
- Annual Recurring Revenue (ARR): Long-term view of subscription revenue, crucial for forecasting and investor confidence.
- Churn Rate: Tracks customer or revenue loss over time. High churn signals retention issues.
- Customer Acquisition Cost (CAC): The cost of acquiring a new customer. Pair with LTV for efficiency insights.
- Customer Lifetime Value (LTV): Total revenue a customer generates. A high LTV reflects strong retention and upsell potential.
- Net Revenue Retention (NRR): Revenue retained from existing customers, factoring in upsells and churn. Over 100% is ideal.
- Gross Margin: Revenue left after covering direct costs. Healthy margins (70–85%) indicate scalability.
- Burn Rate: Monthly cash spent minus revenue. Helps manage cash flow and runway.
- Cash Runway: Months your startup can operate with current cash and burn rate. Aim for 18–24 months.
- Rule of 40: Balances growth rate and profit margin. A score of 40% or higher shows financial health.
Key Tip: Focus on 5–7 KPIs that align with your growth stage. Early-stage startups should prioritize CAC, LTV, and churn, while scaling businesses should focus on metrics like NRR and the Rule of 40. Automating calculations with tools like Lucid Financials can save time and ensure accuracy.
10 Essential Financial KPIs for SaaS Startups: Metrics, Benchmarks & Formulas
Top 10 SaaS KPIs Every Founder Must Track to Scale | Asif Masani
sbb-itb-17e8ec9
1. Monthly Recurring Revenue (MRR)
Monthly Recurring Revenue (MRR) represents the predictable income generated each month from active subscriptions. This metric excludes one-time purchases and fluctuating income sources. To calculate MRR, multiply the total number of active customers by the average revenue per customer (ARPC). For instance, if you have 500 subscribers paying an average of $100 per month, your MRR would amount to $50,000.
Why MRR Matters for SaaS Growth
"Monthly Recurring Revenue (MRR) is the heartbeat of any SaaS business." – Spendflo
A steadily increasing MRR signals a healthy and scalable business model. Breaking MRR into its key components - new customer MRR, expansion MRR (from upgrades), contraction MRR (from downgrades), and churned MRR - provides a detailed view of business performance. This breakdown helps assess the success of customer acquisition efforts, retention strategies, and product enhancements. Conversely, a declining MRR often points to rising churn or a drop in ARPC, which are critical issues to address immediately.
MRR's Role in Financial Health and Investor Confidence
MRR growth is a cornerstone for evaluating financial stability and attracting investors. Investors often look at Annual Recurring Revenue (ARR), calculated as 12× MRR, to benchmark SaaS companies. Detailed MRR data enables scenario modeling, offering insights into growth potential and customer satisfaction. Breaking MRR into its components also sheds light on product-market fit and customer loyalty - key factors for investor due diligence.
Simplifying MRR Tracking for Better Decisions
Automating MRR tracking makes it easier to identify trends and make informed decisions. This is particularly useful when evaluating the effectiveness of marketing campaigns or product updates in driving recurring revenue. Tools that automate MRR tracking also allow you to quickly spot growth opportunities or attrition patterns, helping guide strategic plans. Platforms like Lucid Financials take this a step further by offering real-time reporting, streamlining financial monitoring, and providing investor-ready insights directly within your workflow. By automating MRR tracking, businesses not only gain a clearer view of revenue trends but also improve overall financial decision-making efficiency.
2. Annual Recurring Revenue (ARR)
ARR, or Annual Recurring Revenue, extends the concept of MRR by providing a long-term view of predictable income. It represents the annualized value of all subscription contracts, excluding one-time fees and variable charges. Calculating ARR is straightforward: multiply your MRR by 12 or add up the annual contract values. For instance, if your MRR is $50,000, your ARR would total $600,000.
Why ARR Matters for SaaS Growth
ARR provides a clear picture of your company’s growth trajectory and helps forecast revenue over the next year. It’s a key metric for investors and board members, often used to benchmark company stages:
- Seed Stage: $0–$1M ARR
- Series A: $1–$5M ARR
- Series B: $5–$15M ARR
- Series C and Beyond: Over $15M ARR
For example, a company with $5 million ARR growing at 100% annually paints a much more compelling growth story than one growing at 30%. This annualized perspective not only builds investor confidence but also strengthens operational planning.
ARR and Financial Stability
The stability of ARR directly impacts investor confidence by reducing perceived risks.
"A higher ARR indicates a company is more dependable and has a lower risk profile, leading to higher valuations." – Profit.co
For example, a company with $15 million ARR is generally valued higher than one with $3 million ARR due to its perceived reliability. Breaking down ARR into components - like New ARR from fresh customers, Expansion ARR from upgrades, Renewal ARR, and deductions for Churned and Contraction ARR - reveals customer behavior patterns and helps fine-tune pricing and retention strategies. Monitoring these elements over time also provides insights into long-term revenue health and retention success.
Simplifying ARR Tracking for Better Decisions
Once your business surpasses $1 million in recurring revenue, ARR becomes the go-to metric for investor reporting. It’s essential to exclude one-time payments, such as implementation fees, to maintain accuracy. For multi-year contracts, divide the total contract value (minus one-off charges) by the number of contract years to calculate ARR correctly. Tools like Lucid Financials can automate ARR tracking, ensuring precise metrics and generating reports tailored for investors, enabling faster and more informed decision-making.
3. Churn Rate
Churn rate measures the percentage of customers or revenue lost over a specific period, providing a clear picture of customer retention and how well your product engages users. There are two main types to track: customer churn (or "logo churn"), which focuses on cancellations, and revenue churn, which captures the loss in Monthly Recurring Revenue (MRR) due to downgrades or pricing changes. Since churn directly impacts growth and operational efficiency, it's a critical metric for SaaS businesses.
Relevance to SaaS Growth and Scalability
Churn plays a big role in determining the sustainability of your business. High churn means losing a significant portion of your customer base over time. For instance, a 5% monthly churn rate translates to losing nearly 46% of your customers in a year. Startups often face higher churn rates - anywhere from 10% to 20% monthly - while more established SaaS companies aim for around 2% churn.
The stakes are even higher when you factor in customer acquisition costs, which are much higher than retention costs. High churn can eat into your marketing and sales ROI, making growth harder to sustain. Additionally, churn rates often differ by customer segment; enterprise clients tend to have lower churn due to long-term contracts and higher switching costs.
Impact on Financial Health and Investor Readiness
"Churn is the pulse of your SaaS business. It reveals how well your product solves customer problems, the strength of your onboarding, and the loyalty of your user base." – Fadi George, CEO and Co-Founder, Kalungi
Investors often view churn as a key indicator of a SaaS company's health. A high churn rate can signal poor product–market fit, making future revenue harder to predict, lowering valuations, and complicating funding efforts. For mature SaaS businesses, an annual churn rate between 5% and 7% is considered healthy. Companies growing revenue at over 75% year-over-year are much more likely to keep churn below 5%, signaling strong customer retention and scalability.
Ease of Tracking and Interpretation for Decision-Making
To make churn data actionable, segment it by customer type and combine it with metrics like Net Revenue Retention (NRR) for a fuller picture. Keep an eye on involuntary churn caused by failed payments or expired credit cards, as these issues can often be addressed quickly. Exclude trial users from churn calculations, and instead, track trial-to-paid conversion rates as a separate metric to avoid skewing your data.
Churn, much like MRR and ARR, offers insight into your company's overall health and customer loyalty. Tools like Lucid Financials can simplify churn tracking by automating calculations and segmenting data, eliminating the need for manual spreadsheets and ensuring clean, actionable insights.
4. Customer Acquisition Cost (CAC)
Customer Acquisition Cost (CAC) measures how much it costs to bring in a single new customer. To calculate it, divide your total sales and marketing costs by the number of new customers acquired during a given period. These costs can include everything from sales salaries and commissions to advertising, content creation, CRM tools, and even free trials. In short, CAC helps you understand how efficiently your growth strategy is working.
Relevance to SaaS Growth and Scalability
If you’re not tracking CAC, you’re essentially flying blind when it comes to knowing whether your sales and marketing dollars are well spent. Pairing CAC with Customer Lifetime Value (LTV) makes it even more insightful. A common benchmark is a 3:1 LTV:CAC ratio, meaning every customer should generate three times the revenue of their acquisition cost. This ratio ensures you’re covering operational costs, investing in product development, and still leaving room for growth.
"Without knowing your CAC, you're essentially guessing whether your sales and marketing spending makes financial sense." – Arron Bennett, Strategic CFO
CAC varies depending on your target audience. SMB SaaS companies in 2026 typically report CAC between $300–$800, while mid-market ranges from $1,500–$4,000, and enterprise can go as high as $5,000–$10,000. These differences stem from factors like longer sales cycles and the need for more touchpoints and personalized demos for larger clients. Another metric to watch is the SaaS Magic Number - a value above 1.0 means every dollar spent on acquiring customers generates at least one dollar in recurring revenue, signaling efficient growth.
Impact on Financial Health and Investor Readiness
Investors pay close attention to CAC because it reflects whether your business is sustainable or just burning cash. A company growing at 100% year-over-year might seem impressive - until you realize they’re spending $2 to acquire every $1 of customer value. Another key metric is the CAC payback period, which measures how long it takes to recover your acquisition costs through gross margin. For consumer SaaS, this is usually 3–5 months, while SMB aims for 6–7 months, mid-market around 12 months, and enterprise between 18–24 months.
Even a strong LTV:CAC ratio can’t offset the cash strain caused by a long payback period, especially if growth spending outpaces revenue collection. Reducing churn by just 5% can significantly boost profitability over time because it protects the value of your initial CAC investment. That’s why CAC is more than just a number - it’s a cornerstone of your unit economics and a key indicator of whether your business is ready to scale or needs fine-tuning.
Ease of Tracking and Interpretation for Decision-Making
To calculate CAC accurately, include all sales and marketing expenses, such as salaries, commissions, software, content creation, and overhead. However, exclude costs tied to retaining existing customers, like support and account management, as these can distort acquisition data. If your team handles multiple roles, only account for the portion of their time spent on acquiring new customers.
Keep in mind that marketing efforts often have delayed effects, so it’s better to track trends over time rather than focusing on short-term snapshots. Segment your CAC by channel (e.g., paid ads versus organic content) and customer type (enterprise versus SMB) to pinpoint where your growth is most efficient. This helps you allocate resources more effectively. Regularly review CAC alongside your payback period and LTV - monthly or quarterly check-ins can help you catch rising costs early and adjust your strategies before they impact cash flow. Tools like Lucid Financials can simplify this process by automating calculations and offering real-time insights, saving you from tedious spreadsheet work.
5. Customer Lifetime Value (CLV or LTV)
Customer Lifetime Value (CLV or LTV) represents the total revenue - or ideally, gross profit - that a single customer brings in throughout their relationship with your product. While Customer Acquisition Cost (CAC) tells you how much it costs to acquire a customer, LTV shows the long-term value they contribute. This difference is essential because two companies with the same revenue can have vastly different long-term potential if one has a higher LTV. A higher LTV often signals stronger investor appeal and greater business resilience.
Relevance to SaaS Growth and Scalability
A strong LTV allows companies to spend more on acquiring customers, recover costs faster, and enjoy compounding profits over time. It’s also a clear indicator of product-market fit - if customers continue using and even increasing their engagement with your product, it’s a sign that your solution addresses a real need. SaaS companies actively improve LTV by focusing on better onboarding experiences, adopting usage-based pricing models, and boosting revenue through upsells and add-ons. Top-performing companies often see 30–40% of their revenue coming from existing customers via expansion strategies, which increases LTV without requiring additional acquisition costs.
"Two companies can have the same revenue, but the one with higher LTV will always be more valuable. High LTV signals strong retention, pricing power, product stickiness, and customer loyalty." – Lior Ronen, Founder, Finro Financial Consulting
LTV becomes even more impactful when paired with CAC to create a comprehensive financial strategy. The LTV:CAC ratio is a pivotal metric here, with a healthy range typically falling between 3:1 and 4:1. In 2023, the median LTV:CAC ratio for B2B SaaS companies was 3.6. Ratios under 1:1 indicate that you're losing money on each customer, while anything above 5:1 might suggest you're not spending enough to grow.
Impact on Financial Health and Investor Readiness
For investors, LTV is often more telling than top-line revenue because it highlights whether a company’s growth is sustainable. A business growing at 100% year-over-year might seem impressive, but if customers are leaving as fast as they’re being acquired, that growth isn’t stable. A high LTV demonstrates scalability and profitability in each customer relationship, which is crucial for long-term success. Companies with LTV:CAC ratios above 3:1 tend to secure higher valuation multiples, and those using advanced LTV modeling are 28% more likely to hit their revenue growth targets.
LTV also helps prioritize resources. For example, if the top 20% of your customers account for over 80% of your total LTV, it makes sense to focus your sales and customer success efforts on attracting and retaining similar high-value clients. Even small improvements in retention - like increasing it by just 5% - can boost profits by 25% to 95%, making LTV-focused strategies one of the most effective ways to strengthen your business.
Ease of Tracking and Interpretation for Decision-Making
The simplest way to calculate LTV is by dividing Average Revenue Per User (ARPU) by the monthly churn rate. For a more precise figure, you can adjust for gross margin: multiply Average Revenue Per Account (ARPA) by your gross margin percentage, then divide by the churn rate. This method gives a clearer picture of profitability, particularly for AI SaaS companies with high infrastructure costs. As with Monthly Recurring Revenue (MRR), breaking down LTV by cohort or acquisition channel provides deeper insights and avoids misleading averages that could hide potential risks.
To maintain and grow LTV, focus on reducing early churn by helping users achieve their first success within the first week. Encourage annual plans to secure upfront revenue and extend customer lifespans. Regularly review your LTV:CAC ratio - if it starts to decline, take action by reducing churn, increasing ARPU through upsells, or lowering CAC with optimized marketing strategies. Tools like Lucid Financials can simplify this process by automating calculations and offering real-time dashboards, eliminating the need for manual updates in spreadsheets.
6. Net Revenue Retention (NRR)
Net Revenue Retention (NRR) goes beyond customer lifetime value by highlighting how effectively your existing customer base drives revenue growth.
NRR measures the percentage of recurring revenue retained from current customers, factoring in upsells, downgrades, and cancellations. The calculation is straightforward: start with your beginning Monthly Recurring Revenue (MRR), add expansion revenue, subtract contractions and churn, divide by the starting MRR, and multiply by 100. An NRR above 100% means "negative churn", where revenue growth from existing customers outweighs losses from cancellations.
Why NRR Matters for SaaS Growth
NRR is a key indicator of whether a company’s growth is sustainable without constant new customer acquisition. For instance, a 120% NRR means your revenue cohort will grow by 73% over three years - even without adding new customers. Companies with high NRR, like Snowflake (158%) and Twilio (155%), showcase how expansion revenue can fuel rapid growth. In fact, for SaaS businesses generating $15M–$30M+ in Annual Recurring Revenue (ARR), around 40% of growth now comes from expansion revenue rather than new customers.
"NRR shows whether your growth is self-sustaining or acquisition-dependent." – Lior Ronen, Founder, Finro Financial Consulting
The focus on NRR reflects a shift away from "growth at all costs" to a more cost-efficient approach. Retaining and expanding existing customers costs about five times less than acquiring new ones, making NRR a vital metric for capital-efficient growth. Companies are now using AI tools to predict churn 6–12 months in advance and employing product-led strategies like in-app upgrade options and usage-based pricing to boost NRR.
Financial Impacts and Investor Appeal
For investors, NRR is often the most critical metric for assessing long-term viability and product-market fit. Companies with 120% NRR can secure 2–3x higher valuation multiples compared to those with 95% NRR. Private SaaS companies typically see median NRR between 101% and 106%, while public SaaS companies average 110% to 114%. Falling below 100% NRR signals potential issues with product quality, pricing, or customer satisfaction that might not be apparent from basic MRR or ARR metrics.
| Stage | Median NRR | Top Quartile NRR |
|---|---|---|
| Early Stage ($1M–$3M ARR) | 94–98% | 99–104% |
| Growth Stage ($3M–$15M ARR) | 99–104% | 106–110% |
| Scale Stage ($15M–$30M ARR) | 104–106% | 110–115% |
| Mature ($30M+ ARR) | 106–110% | 115–120% |
To get a complete picture, track NRR alongside Gross Revenue Retention (GRR), which excludes expansion revenue. A high NRR paired with low GRR could mean expansion revenue is masking churn issues. Segmenting NRR by customer size or industry can also reveal hidden trends, such as success in one area offsetting struggles in another.
Tracking NRR for Better Decisions
Since NRR is a lagging metric, it’s essential to monitor leading indicators like daily or monthly active users (DAU/MAU), feature adoption rates, and customer health scores to anticipate changes. Cohort analysis helps tie NRR to specific customer behaviors over time, offering clearer insights than aggregate data. Declining product usage can signal churn risks, allowing for proactive intervention. Pricing strategies like usage-based models or modular add-ons can align customer spending with the value they gain, encouraging natural revenue growth.
Tools like Lucid Financials simplify NRR tracking by automating calculations and providing real-time dashboards. This eliminates the need for manual updates and gives instant visibility into retention risks and growth opportunities.
7. Gross Margin
Gross margin shows how much of your revenue remains after covering direct delivery costs, also called the Cost of Goods Sold (COGS). You can calculate it using this formula:
(Revenue - COGS) / Revenue × 100.
For SaaS startups, COGS typically includes expenses like cloud hosting (e.g., AWS or Azure), key third-party APIs (such as Twilio or Plaid), payment processing fees (e.g., Stripe), and salaries for Customer Success or Support teams focused on retention and troubleshooting. To keep the calculation accurate, exclude costs related to Sales & Marketing, R&D, and General & Administrative (G&A) expenses. Beyond its role in gauging profitability, gross margin helps guide decisions on reinvestment and pricing adjustments.
Relevance to SaaS Growth and Scalability
High gross margins - usually between 70% and 85% - are a hallmark of scalable SaaS companies. These margins mean that most of the revenue generated contributes to profit without significantly increasing service costs. For perspective, companies with gross margins above 75% often need 30–40% less funding to achieve profitability compared to those with margins under 65%. Elite SaaS businesses typically maintain margins around 80%, while the median for companies with $5–50M in Annual Recurring Revenue (ARR) hovers between 72% and 78%.
| Performance Tier | Gross Margin Range |
|---|---|
| Elite | 80–85% |
| Strong | 70–80% |
| Average | 65–70% |
| Concerning | Below 65% |
Impact on Financial Health and Investor Readiness
Gross margin plays a pivotal role in both day-to-day operations and investor evaluations, much like metrics such as MRR and CAC. Investors often see gross margin as a measure of a SaaS company’s business model strength. For example, a 10% difference in gross margin can lead to a 12–15% difference in valuation multiples among comparable companies. Private equity investors, in particular, usually expect SaaS businesses to maintain gross margins of at least 70% when considering acquisitions. Healthy margins also give companies the ability to reinvest in growth areas like R&D or Sales and Marketing without quickly burning through cash. Additionally, gross margin is crucial for accurate Customer Lifetime Value (LTV) calculations - using raw revenue instead of margin-adjusted revenue can inflate perceived customer value.
Ease of Tracking and Interpretation for Decision-Making
Tracking gross margin monthly helps businesses spot trends early and make timely adjustments to pricing or infrastructure. Breaking down margins by customer segment - such as Self-Serve versus Enterprise - can offer sharper insights than using a single blended figure. For instance, one startup analyzed its $12,000 monthly AWS bill by distributing costs across active projects. With 1,000 projects from Self-Serve customers and 2,000 from Enterprise customers, the per-project cost came out to $4. This revealed a Self-Serve gross margin of 84% (from $25,000 in revenue minus $4,000 in COGS) and an Enterprise gross margin of 80% (from $40,000 in revenue minus $8,000 in COGS). This segmented approach provided a clearer picture of unit economics than a blended margin would. Tools like Lucid Financials simplify this process by automating calculations and offering real-time dashboards, making it easier to track profitability across different segments without manual updates.
8. Burn Rate (Net Burn)
Burn rate tracks how quickly your startup is spending cash each month. Net burn, specifically, is the difference between your monthly cash outflows (like operating expenses) and cash inflows (revenue). For instance, if you’re spending $200,000 on expenses but only bringing in $80,000 in revenue, your net burn is $120,000. This is a key metric for SaaS startups that haven’t reached profitability yet, as it shows how long you can keep operating before needing more funding.
Relevance to SaaS Growth and Scalability
Keeping a controlled burn rate reflects disciplined management and careful growth planning. Ideally, your burn rate should stay under 30% of your Annual Recurring Revenue (ARR) to support better long-term results. The goal is to lower the burn rate as a percentage of revenue as your business scales. For example, if you’re burning $500,000 each month with $2 million in ARR, your burn-to-ARR ratio is 25%. This suggests efficient growth. Tomasz Tunguz of Redpoint Ventures advises:
"SaaS companies should aim to grow headcount at or slightly below their revenue growth rate to maintain healthy financial dynamics."
On the flip side, a high burn rate without matching growth might point to problems like weak product-market fit, pricing missteps, or high customer acquisition costs. Keeping your burn rate in check doesn’t just improve operational efficiency - it also builds trust with investors.
Impact on Financial Health and Investor Readiness
Investors pay close attention to burn rate because it shows how well you’re managing cash and whether you’re being fiscally responsible. Burn rate directly impacts your runway - the number of months your startup can keep running before needing more funding. To calculate runway, divide your current cash reserves by your monthly net burn rate. Ideally, startups should aim for 18–24 months of runway to handle any market shifts.
Benchmarks vary depending on your stage of growth:
- Early-stage startups often burn $50,000 to $150,000 monthly and aim for 12–18 months of runway.
- Growth-stage startups might burn $200,000 to $1 million monthly, targeting 18–24 months of runway.
Ease of Tracking and Interpretation for Decision-Making
To manage burn rate effectively, keep a close eye on your cash balance and justify every expense using zero-based budgeting. Pair this with strong unit economics, like maintaining an LTV:CAC ratio of at least 3:1, to ensure your spending supports sustainable growth. Just as metrics like MRR (Monthly Recurring Revenue) and CAC (Customer Acquisition Cost) guide strategic decisions, monitoring burn rate in real time helps you stay ahead of cash flow challenges.
Tools like Lucid Financials simplify burn rate tracking by automatically categorizing transactions and generating AI-driven forecasts based on your historical data. This allows you to make quick budget adjustments and identify areas to cut costs without stalling growth. Ultimately, these insights ensure every dollar spent fuels scalability and maintains financial stability.
9. Cash Runway
Cash runway measures how many months your startup can keep operating based on its current burn rate. For instance, if your startup has $600,000 in the bank and spends $50,000 monthly, you’ve got 12 months of runway.
Relevance to SaaS Growth and Scalability
Building on the concept of burn rate, cash runway offers a bigger picture of your liquidity after accounting for expenses. For SaaS startups, managing runway can be tricky due to the delay between upfront customer acquisition costs and the time it takes to recover them through subscription payments. While 12–18 months of runway is a common target, many SaaS companies find it beneficial to aim for 18–24 months. In tougher fundraising climates, experts suggest extending that to 24–36 months to ensure financial stability.
A longer runway gives you what investors often call "optionality" - the flexibility to try different pricing strategies, shift your business model, or wait for better market conditions before seeking additional funding. For example, iOPEX, an IT management services provider, used revenue-based financing from Lighter Capital to maintain its runway during a period of fast growth and the challenges of the COVID-19 pandemic. CFO Archana Srinivasan noted:
"Surviving a downturn and being able to grow again when it turns around is going to be the new measure of success".
Impact on Financial Health and Investor Readiness
Just as metrics like MRR and CAC highlight growth efficiency, having a solid cash runway reassures investors about your financial management. Investors pay close attention to runway because it shows whether you’re handling cash responsibly and if your business is a viable investment. Falling below 6 months of runway can seriously hurt your bargaining power during funding discussions.
"Too little runway weakens negotiating power, while more runway gives founders flexibility to grow revenue and refine their strategy" – First Round Review.
The importance of runway became especially clear during the Great Recession when startup valuations dropped by 27.3%.
Ease of Tracking and Interpretation for Decision-Making
Although the basic formula for calculating runway is straightforward, tracking it accurately requires adjustments for factors like delayed accounts receivable or seasonal revenue spikes, such as end-of-year upgrades. These variables can distort your actual cash position. Scenario modeling can help you understand the impact of potential delays or unexpected expenses. Aligning your runway estimates with critical milestones - like a product launch or profitability goals - ensures you’re not just watching the clock but actively working to extend your runway.
Tools like Lucid Financials can simplify this process. Their AI-powered forecasts adjust for variables like seasonality and provide real-time cash position updates via Slack. This allows you to optimize collections, negotiate better vendor terms, and make proactive budget changes before your cash flow becomes an issue.
10. Rule of 40
The Rule of 40 is a financial guideline that combines your revenue growth rate and profit margin into a single score. If the total is 40% or higher, it suggests strong structural and financial health [43, 44]. The formula is simple:
Revenue Growth Rate (%) + Profit Margin (%) = Rule of 40 Score [43, 45].
For accuracy, use year-over-year (YoY) ARR growth for revenue and either EBITDA or free cash flow (FCF) margin for profitability [43, 44].
Relevance to SaaS Growth and Scalability
This metric highlights whether you're effectively balancing rapid growth with financial discipline. For instance, a company growing at 60% with a –20% margin hits the same 40% score as one growing at 30% with a 10% margin. These scenarios reflect different stages of maturity: early-stage startups often accept negative margins to fuel growth, while more established companies tend to focus on profitability [44, 45].
The Rule of 40 becomes particularly important when a company reaches scale - typically defined as achieving at least $1 million in Monthly Recurring Revenue (MRR) or $15–$20 million in Annual Recurring Revenue (ARR). It complements earlier-stage KPIs by assessing the balance between aggressive growth and financial stability. Maxim Atanassov of Future Ventures explains:
"The goal is not simply to reach a score of 40. The goal is to build a durable engine that can fund growth without constant rescue capital".
Impact on Financial Health and Investor Readiness
Only about one-third of software companies achieve a Rule of 40 score of 40% or higher. Companies that consistently surpass this threshold often enjoy revenue multiples around 10.7x. Additionally, a 10-point increase in the Rule of 40 score is linked to a 1–2x rise in EV/Revenue multiples. Like metrics such as MRR and churn, a strong Rule of 40 score signals sound financial health and strategic foresight.
Investor preferences have shifted toward "efficient growth" over "growth at any cost." Companies with scores above 50 are considered "elite" and find it easier to raise capital, while those scoring below 20 often struggle to secure funding. With the median Rule of 40 score for public SaaS companies hovering in the low-to-mid 20s, hitting 40% places your company in an enviable position.
Ease of Tracking and Interpretation for Decision-Making
Calculating the Rule of 40 is straightforward if you have accurate financial data. Simply pull your ARR growth rate and EBITDA margin from your income statement. Consistency is key - stick to one profitability metric (either EBITDA or FCF) to maintain credibility with investors.
Avoid cutting essential expenses just to boost your score, as this could weaken your sales pipeline in the long run. Instead, treat the Rule of 40 as a diagnostic tool. If your score falls below 40%, look for underlying issues like high customer acquisition costs (CAC) or bloated operational expenses [43, 44]. Running scenario models - such as evaluating whether a 5% growth increase or a 5% margin improvement is more feasible - can help you decide on the best strategy [43, 45].
For real-time tracking, tools like Lucid Financials offer Slack integration, giving you instant updates on your growth rate and margin trends. This allows you to make timely adjustments and maintain a healthy Rule of 40 score.
Conclusion
Tracking these ten KPIs can completely change the way your SaaS startup approaches its financial strategy. Instead of scrambling to fix problems after they happen, these metrics act as an early warning system, giving you a clear picture of what’s ahead over the next 12 months. As Accounting Wise aptly puts it:
"Running a SaaS company without tracking the right metrics is like flying blind in a storm. You might stay airborne for a while, but eventually, you're going to crash".
By keeping a close eye on these KPIs, you can avoid overspending, refine your pricing strategies, and identify upselling opportunities. These aren’t just numbers - they’re tools that directly support the strategic decisions behind every KPI mentioned here.
For SaaS founders, clear KPI reporting is a game-changer when it comes to attracting investors. Since SaaS businesses are often valued as a multiple of ARR, having accurate, up-to-date metrics is essential for both fundraising and valuation discussions. Gene Godick, Founder of G-Squared Partners, emphasizes this point perfectly:
"What gets measured gets managed".
Relying on manual spreadsheets leads to inconsistencies and delays. Automated systems, on the other hand, offer real-time visibility, eliminating the need for outdated reports that arrive weeks too late.
This is where Lucid Financials steps in. It takes the hassle out of manual tracking by automating KPI calculations and delivering real-time insights directly to tools like Slack. Whether you’re monitoring MRR, burn rate, or the Rule of 40, Lucid ensures your numbers are always up-to-date and actionable. Plus, with clean books ready in just seven days, AI-powered forecasts, and investor-ready reporting, you’ll have everything you need to focus on growing your business - all reviewed by finance professionals for accuracy.
To make the most of these insights, narrow your focus to the 5–7 KPIs that align with your startup’s stage of growth. For early-stage companies, unit economics like CAC and LTV are crucial for sustainable growth. Scaling businesses, however, need to balance growth with profitability by focusing on metrics like the Rule of 40. Even small improvements can make a big difference - reducing churn by just 5% can double profitability over time. Similarly, maintaining a healthy CAC-to-LTV ratio of 1:3 or 1:4 is key to ensuring long-term success.
With automated tracking and real-time insights, every decision - from gross margins to CAC payback - becomes more informed and impactful. Top-performing SaaS companies typically maintain gross margins around 81% and achieve CAC payback within 12–15 months. Meanwhile, the Rule of 40 serves as a reliable benchmark for balancing growth and profitability. This kind of visibility allows you to build a growth engine that doesn’t depend on constant infusions of rescue capital.
FAQs
Which 5–7 SaaS KPIs should I track at my stage?
At this point, it’s crucial to keep an eye on 5–7 key SaaS KPIs to measure your business's performance and health. These include:
- Monthly Recurring Revenue (MRR): Tracks the predictable revenue your business generates each month.
- Churn Rate: Measures the percentage of customers or revenue lost over a specific period.
- Customer Acquisition Cost (CAC): Calculates how much it costs to acquire a new customer.
- Customer Lifetime Value (LTV): Estimates the total revenue a customer will bring during their relationship with your business.
- Revenue Growth Rate: Shows how quickly your revenue is increasing over time.
- Gross Margin: Reflects the profitability of your core operations by subtracting costs from revenue.
- Cash Runway: Indicates how long your business can operate with its current cash reserves.
These metrics provide a clear picture of your growth, retention, efficiency, and overall financial stability.
How do I calculate LTV correctly with gross margin and churn?
To figure out Customer Lifetime Value (LTV) accurately, use this formula: LTV = (ARPU × Gross Margin) / Churn Rate.
Here’s a quick breakdown:
- ARPU: Average Revenue Per Customer
- Gross Margin: Expressed as a decimal (e.g., 0.65 for 65%)
- Churn Rate: Also expressed as a decimal (e.g., 0.05 for 5%)
This formula takes into account both profitability and customer retention, giving you a clear estimate of the revenue a customer is likely to generate over their lifetime.
What’s a “good” CAC payback period for my customer type?
A "good" CAC payback period typically falls between 5 to 12 months, with 5 months being the sweet spot for maintaining steady growth. This timeframe allows businesses to recover their customer acquisition costs swiftly, enabling quicker reinvestment to support scaling efforts.