If your CPG brand funds growth with the wrong money, more sales can make cash problems worse.
I’d boil this case down to one point: Verdant Provisions cut its cost of capital by fixing its funding mix, tightening cash control, and delaying equity until the business looked less risky. In the example, WACC drops from about 20% to 15%, monthly burn falls from about $280,000 to $220,000, and runway moves from roughly 7–8 months to 10–12 months.
Here’s what matters most:
- Equity was the biggest cost drag: about 53% of the capital base at an estimated 24% cost
- Short-term debt was small but expensive: a working-capital line and cards still added heavy cost at about 15% after tax
- Cheaper funding helped: inventory and receivables-backed lending, net 60 supplier terms, and the R&D tax credit
- Better cash control mattered too: lower inventory, tighter forecasting, and close tracking of DIO, DPO, and DSO
- Timing mattered: waiting 6 more months for the next equity round reduced expected dilution from about 25%–30% to 15%–20%
A simple way to look at it: when your blended capital cost sits near 20%, your inventory and promo spend need to earn more than that just to keep up. If returns are closer to 12%–15%, growth may look good on paper while the business gets weaker underneath.
| Area | Before | After |
|---|---|---|
| WACC | ~20% | ~15% |
| Monthly net burn | ~$280,000 | ~$220,000 |
| Runway | ~7–8 months | ~10–12 months |
| Cash conversion cycle | ~80 days | ~55–60 days |
| Next-round dilution | ~25%–30% | ~15%–20% |
So if I were a founder or finance lead reading this, my takeaway would be simple: watch the cost of each dollar you use, not just revenue growth. The brands that keep cash moving, lower inventory pressure, and rely less on high-cost funding usually give themselves more time and better options.
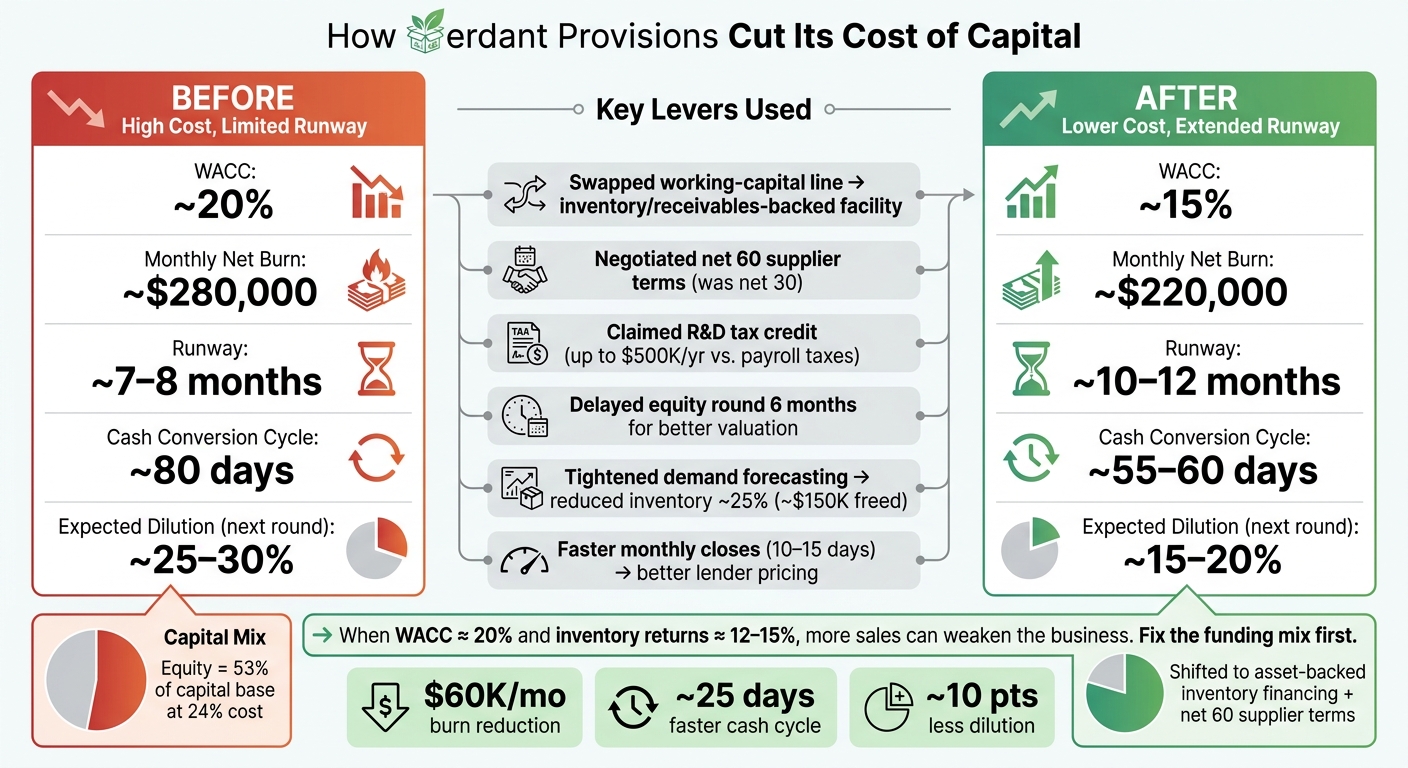
CPG Brand Cost of Capital: Before vs. After Optimization
Investor Spotlight: How to Raise Capital for CPG Brands with Habitat Partners | Podcast

sbb-itb-17e8ec9
Case Overview: A Hypothetical CPG Brand and Its Starting Capital Structure
To make the cost of capital feel concrete, this case study uses a hypothetical brand: Verdant Provisions, a U.S. plant-based snack company. All figures are illustrative, but they reflect conditions that are common for brands at this stage.
Brand profile, growth stage, and cash demands
Verdant Provisions sells a plant-based snack line through an omnichannel mix of direct-to-consumer, Amazon, and retail wholesale. Annual revenue is $8 million, which is enough to create pressure on cash but not enough to fund growth comfortably from operations alone. At this point, the brand needs outside capital to support manufacturing scale and marketing spend.
Gross margin is 44%, which is common for an early CPG brand dealing with high launch costs and limited scale. That sounds solid on paper. But in practice, cash often goes out long before revenue comes in.
Opening capital mix and the core financial problem
Verdant Provisions begins with a mix of founder equity and short-term financing to pay for inventory, manufacturing, and trade spend. That starting mix matters because each source of funding has a price tag. And together, those funding costs shape the brand’s cost of capital.
That tension sets up the WACC analysis in the next section.
Measuring Cost of Capital: WACC, Assumptions, and a Brand-Level Breakdown
Here, WACC shows which parts of Verdant Provisions' capital mix are dragging returns down. The formula is simple: WACC = (E/V × Re) + (D/V × Rd × (1 - T)). For Verdant Provisions, the key issue is plain enough: which sources of capital lower the cost base, and which ones push it up? You can see that pressure right in the mix. Before any fixes, the current setup is expensive.
Estimating cost of equity and cost of debt for a CPG startup
Cost of equity doesn’t arrive as an invoice, so it has to be estimated. A practical method starts with the 10-year U.S. Treasury rate as the risk-free base, then adds a broad equity risk premium of 5%–6%. From there, you layer on a startup risk premium of 8%–12% for illiquidity and execution risk, plus another 3%–5% for CPG headwinds such as retailer power and slotting fees. Using that approach, Verdant Provisions lands at a working estimate of 24%.
Cost of debt is easier to spot, but founders often miss the full picture. Fees matter. Repayment structure matters too. At a 25% tax rate, a 9.2% term loan comes out to 6.9% after tax, a 14.0% revenue-based facility comes out to 10.5%, and a 20.0% working-capital line comes out to 15.0%. That’s a big spread, and it helps explain why the capital structure needs to change before growth picks up.
What the WACC calculation shows
Using $2,850,000 of equity and interest-bearing debt, the mix looks like this:
| Capital Component | Amount (USD) | Weight | Pre-Tax Cost | Tax Rate | After-Tax Cost | WACC Contribution |
|---|---|---|---|---|---|---|
| Founder & Angel Equity | $1,500,000 | 53% | 24.0% | - | 24.0% | 12.7 pts |
| Bank / SBA Term Loan | $600,000 | 21% | 9.2% | 25% | 6.9% | 1.4 pts |
| Revenue-Based Inventory Financing | $450,000 | 16% | 14.0% | 25% | 10.5% | 1.7 pts |
| Short-Term Working Capital Line & Cards | $300,000 | 11% | 20.0% | 25% | 15.0% | 1.6 pts |
| Total / Blended WACC | $2,850,000 | 100% | - | - | - | 17.5% |
Trade credit adds $150,000 of low-cost operating capital and sits outside the interest-bearing capital base.
A 17.5% WACC means each dollar the company puts to work needs to earn about $0.18 per year just to break even with lender and investor demands.
Equity does most of the damage here. It makes up about 53% of the capital base, and at a 24% cost, it adds about 12.7 percentage points to WACC by itself. That’s the kind of drag you feel fast. Using equity to pay for inventory cycles and promotional spend isn’t just pricey - it also dilutes ownership.
The short-term working capital line and cards tell a different story, but it’s still not a good one. They account for only about 11% of the capital base, yet they still add about 1.6 percentage points to WACC because their after-tax cost is so steep. That usually points to repeated cash shortfalls, not a one-off squeeze.
Trade credit, by contrast, sits at 5% of total operating capital at near-zero cost. That makes it one of the few cheap tools on the table, and it has plenty of room to do more work. The next section gets into that directly.
Verdant Provisions’ issue isn’t just growth. It’s paying for growth with too much high-cost capital. The next section shows how the brand lowered that burden.
Capital Structure Changes: How the Brand Cut Its Effective Cost of Capital
Verdant Provisions didn’t overhaul its capital structure in one shot. It made a set of focused changes, each aimed at a different cost issue. Put together, those moves brought its blended WACC down in a meaningful way.
Financing moves that shifted the capital mix
The first move was swapping its working-capital line for a facility backed by inventory and receivables. In CPG, asset-based inventory lines often cost about 8% to 15% APR, while other working-capital facilities can land closer to 10% to 14%, depending on the brand and the quality of the collateral. That refinance cut the brand’s dependence on expensive short-term capital and gave it more room to fund inventory without leaning on high-cost cards.
The second lever came from supplier terms. Verdant Provisions started on net 30 with its main co-manufacturer. After showing a steady payment record and signing a multi-year volume agreement, it negotiated net 60 terms. Moving payables from net 30 to net 60 effectively finances an extra month of inventory at no cash cost if the supplier agrees to the terms, which reduced how much the brand had to draw from its revolving line.
The third move was non-dilutive. Verdant Provisions claimed the R&D tax credit against payroll taxes. In the U.S., startups that qualify as small businesses can offset up to $500,000 per year in R&D credits against payroll taxes for up to five years. That lowered the amount the brand needed to pull from its revolving line, which then reduced the share of higher-cost debt in its WACC.
The last move was about timing. The brand pushed its next priced equity round back by six months. Instead of raising at a lower valuation while margins were still unproven, it used better operations and cleaner financials to raise later at a higher valuation. That sequence preserved more founder ownership and lowered the implied cost of equity, since later-stage investors saw less risk.
Those changes worked because the brand also tightened reporting and cash management.
Day-to-day discipline that supported lower capital costs
Lower-cost capital only works if the finance team can see cash clearly, day by day. At first, Verdant Provisions’ lender priced the revolving facility near the top of its range because monthly closes came in late and gross margin reporting varied by channel. Once the brand got to consistent monthly closes within 10 to 15 days and began producing SKU- and channel-level margin reports, the lender cut the interest spread at the next annual review.
Demand forecasting also got tighter. By matching purchase orders to POS data and retailer sell-through reports instead of production minimums, the brand reduced average inventory by about 25%, which freed up roughly $150,000 in working capital. That cash took the place of a similar draw on the revolving line. Put simply, internal cash replaced borrowed money.
The finance lead kept a close eye on three metrics:
- Days inventory outstanding (DIO)
- Days payables outstanding (DPO)
- Days sales outstanding (DSO)
Tracking those each month made it easier to see where cash was getting stuck and where the capital stack was under pressure for no good reason.
Where Lucid Financials fits into this workflow

That kind of discipline depends on faster closes and cleaner reporting. That’s where Lucid Financials comes in. Lucid helps startups keep clean books fast and track runway, debt, and WACC in one place.
Because Lucid connects with Slack, founders can get real-time answers on cash position, runway, and financing questions without waiting on a formal report. That makes scenario modeling much easier. For example, a team can compare the cost of keeping a high-cost short-term line versus moving to a better-structured asset-based facility, then bring those numbers into lender talks and equity planning.
Results and Conclusion: What Founders Should Take From This Case Study
Before-and-after outcomes
The financing changes led to clear gains in cash flow, runway, and dilution. By lowering the cost of capital, cutting burn, and speeding up cash movement, the business put itself in a much better spot.
| Metric | Before Changes | After Changes |
|---|---|---|
| WACC | ~20% | ~15% |
| Monthly Net Burn | ~$280,000 | ~$220,000 |
| Runway (on available capital) | ~7–8 months | ~10–12 months |
| Cash Conversion Cycle | ~80 days | ~55–60 days |
| Expected Next-Round Dilution | ~25–30% | ~15–20% |
WACC dropped from about 20% to 15% because the brand shifted toward lower-cost inventory financing and leaned less on short-term draws. Monthly burn fell by roughly $60,000 after the company stopped using the wrong kind of capital to fund inventory and matched purchasing more closely to demand.
The Cash Conversion Cycle also improved. CCC moved from about 80 days to 55–60 days, which meant cash came back into the business sooner. Later fundraising also reduced expected dilution by about 10 points.
Key points for founders and finance leads
There’s a bigger lesson here for founders, especially in CPG.
Growth can hurt the business when capital costs are higher than returns. If WACC sits near 20% and the return on incremental inventory is closer to 12%–15%, more sales may look good at first glance, but they don’t add much value. Revenue goes up. The business doesn’t get stronger.
That’s why WACC shouldn’t be reviewed on its own. It needs to sit next to inventory turns, CCC, and retailer payment terms, since those are the levers that decide how long cash stays tied up. A brand can seem fine in a deck and still run straight into a cash squeeze if CCC drifts toward 90 days and retailers pay on net 90 terms.
Clean reporting also matters more than many founders think. Lenders price risk based on what they can see, and better books can help a brand renegotiate facilities and get better terms. Lucid Financials supports that process by keeping books current, producing investor-ready reporting, and giving founders faster visibility into runway and working capital needs.
The day-to-day priorities are pretty simple:
- Reduce DIO
- Extend DPO
- Shorten DSO
- Keep books current
- Treat inventory as a financing asset and show it clearly in reporting
FAQs
How do I know if growth is destroying cash?
Growth can drain cash when your burn rate cuts runway faster than revenue climbs. That’s usually the point where growth stops looking like momentum and starts looking expensive.
A few warning signs tend to show up early:
- CAC payback period is over 12 months
- Debt service is more than 25% of net burn
- Debt-to-equity ratio is above 1.0
If expenses keep rising faster than income, or you don’t have 12–18 months of runway, your growth is likely moving faster than your capital can support.
When should a CPG brand use debt instead of equity?
A CPG brand should use debt when cash flow is steady and easy to forecast, and the money is going toward things that are already working. Think equipment, confirmed inventory orders, or adding more reps to a sales team that already knows how to sell.
It should stay away from debt when revenue is hard to predict, the brand is still in its early stage, or the bet itself is risky, like testing a new market. In those cases, equity is the safer path because there’s no required repayment.
Which cash metrics matter most for lowering WACC?
Focus on steady cash flow and an efficient capital structure. A sensible amount of low-cost debt can lower WACC because interest is tax-deductible, as long as interest coverage holds at 3x or higher.
The main metrics to watch are debt-to-equity ratio, burn rate, and runway. Keeping debt-to-equity below 1.0 and using tax credits to cut capital needs can help lower financing costs.