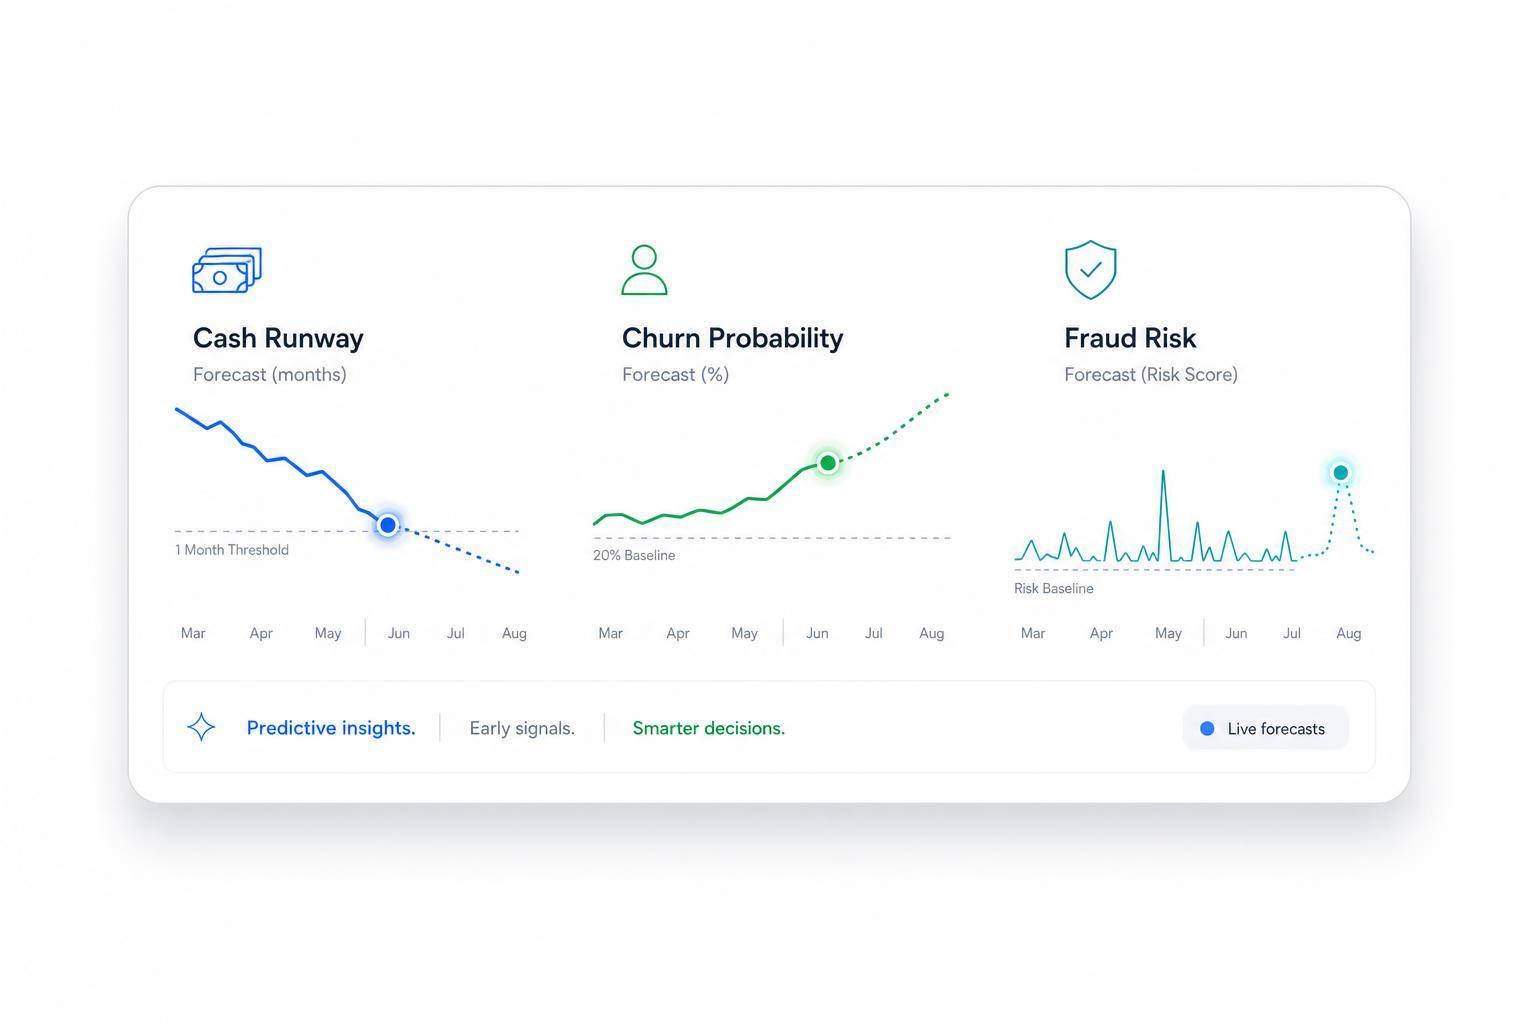
AI can’t tell you your exact exit. But it can estimate what investor returns may look like across different scenarios.
If I had to boil this down, I’d say this: AI is most useful when I feed it clean financials, a current cap table, and market benchmarks, then use it to model IRR, MOIC, ROI, and cash-on-cash returns across downside, base, and upside cases. That helps me answer a simple investor question: “If I invest now, what might I get back, and when?”
Here’s the short version:
- I use ranges, not one number
- I track ownership, dilution, and exit timing
- I build from monthly data, not rough guesses
- I test scenarios with Monte Carlo runs, often 5,000+ simulations
- I present outputs as decision support, not promises
A few numbers from the article show why this matters:
- A 20% seed stake can fall to 8% by Series B after dilution
- A $100,000,000 exit in 4 years can beat a $150,000,000 exit in 9 years on IRR
- Early-stage SaaS exit values may sit around 5x to 12x forward ARR
- Scenario outputs might show something like 1.2x, 3.5x, or 7.0x MOIC depending on the path
If I’m building this kind of forecast, I focus on four things:
- Pick the return metrics
- Collect clean company and market data
- Run scenario models and simulations
- Show the output in a simple investor format
| Area | What I focus on | Why it matters |
|---|---|---|
| Return metrics | IRR, MOIC, ROI, cash-on-cash | Each shows a different part of investor outcome |
| Inputs | Revenue, burn, runway, cap table, round terms | Bad inputs lead to bad return math |
| Modeling | Downside, base, upside, Monte Carlo | Startups don’t follow one clean path |
| Output | Percentiles, assumptions, sensitivities | Investors want range, timing, and drivers |
Bottom line: I’d use AI to pressure-test return outcomes before a fundraise, board meeting, or hiring plan - not to act like the future is fixed.
Step 1: Choose the investor return metrics your model needs to predict
After you set the forecast range, the next move is picking the return metrics your model should output. That choice matters more than it may seem. The mix of metrics changes how investors interpret the forecast.
IRR, MOIC, ROI, and cash-on-cash returns explained
IRR (Internal Rate of Return) is the annualized return, adjusted for when cash flows happen. Venture funds lean on it to compare deals and report results to LPs because it rewards fast exits and penalizes slow ones.
MOIC (Multiple on Invested Capital) is total cash returned divided by the original investment. If a $1,000,000 stake comes back as $4,000,000, that's a 4.0x MOIC.
ROI is net gain divided by invested capital, shown as a percentage. It's useful for board comparisons, but not the best fit for fund benchmarking.
Cash-on-cash measures distributions divided by invested cash. This is a good fit for angels and family offices that care most about realized liquidity.
| Metric | What it measures | Best used for |
|---|---|---|
| IRR | Annualized, time-adjusted return | Fund benchmarking, LP reporting |
| MOIC | Total cash returned as a multiple | Scenario tables, investor decks |
| ROI | Net gain as a percentage | Board materials, round comparisons |
| Cash-on-cash | Actual distributions vs. invested cash | Angel updates, LP distributions |
How ownership, dilution, and exit timing affect returns
Every financing event changes the cap table. Option pool increases, SAFEs with valuation caps, convertible notes with discounts, and new priced rounds all dilute current shareholders. A 20% seed stake can shrink to 8% fully diluted by Series B after dilution and pool top-ups. And once ownership drops, both MOIC and IRR drop with it.
Liquidation preferences also affect how exit proceeds get split across investor classes. So the model should track each financing event, apply SAFE and note conversion logic, and then turn company outcomes into investor returns.
Exit timing matters just as much. IRR is time-sensitive, so a $100 million exit in 4 years can lead to a much higher IRR than a $150 million exit in 9 years, even though the second outcome is larger in raw dollars.
Point estimates versus probability ranges
For an early-stage company, a single number usually doesn't hold up. There is too much uncertainty around revenue growth, market conditions, and exit timing to pretend the model can be that precise.
A better output is a range across scenarios. For example, you might show a base case MOIC of 3.5x, an upside case of 7.0x, and a downside case of 1.2x. Each one should tie back to assumptions about growth rate, exit multiple, and timing.
At pre-seed and seed, where past data is limited, MOIC ranges and ownership changes often tell investors more than a precise IRR estimate. By Series A and B, with more revenue history and cohort data, IRR becomes easier to defend and more expected.
Even small changes can swing the result. A one-year delay or a one-turn shift in revenue multiple can move IRR and MOIC sharply. That sets up the next step: gathering the inputs your model needs.
Those ranges only work if the inputs are sound, so the next step is collecting the data the model needs.
sbb-itb-17e8ec9
Step 2: Collect the data AI uses to estimate returns
Before you model scenarios, build a clean monthly data set. You need one source of truth, a standard chart of accounts, and steady updates. AI can only estimate returns after it has the company’s operating data, ownership data, and market inputs. That dependency shapes how much you can trust the output. Start with financials, then add cap table data, then bring in market benchmarks.
Financial and operating inputs
Start with monthly financial data. Collect revenue by product, channel, or customer segment, along with cost of goods sold, operating expenses across R&D, sales and marketing, and G&A, cash burn, cash balance, runway, and cash flow from operating, investing, and financing activities. Use USD, U.S. number formatting, and accrual accounting so revenue and expenses land in the correct periods.
Gross burn is total monthly operating costs. Net burn is gross burn minus monthly revenue. Runway is current unrestricted cash divided by average monthly net burn, shown in months. These metrics feed the forward-looking cash flow and valuation scenarios the model uses to estimate investor returns.
Operating data matters just as much as the books. Track monthly headcount, hiring plans, customer count, new customers versus churned customers, CAC, LTV, and payback period in a format that ties financial results back to the drivers behind them. If your books say one thing and your CRM says another about customer count, the model will carry that mismatch forward. Those inputs shape the company path that the cap table later turns into investor returns.
Cap table and financing history
The model also needs a dated cap table and financing history. That includes round dates in MM/DD/YYYY format, pre-money and post-money valuations in USD, total capital raised in each round, security type - preferred, common, SAFE, or convertible note - ownership percentages for each investor after the round, and option pool size and vesting. These fields let the model translate future company value into investor payouts.
For SAFEs and convertible notes, include valuation caps, discount rates, and conversion mechanics. That way, the model can simulate how those instruments convert in later priced rounds or at exit. It also needs liquidation preference multiples, participation rights, pro rata rights, and anti-dilution provisions, since these terms can change investor payouts in a big way.
A few common mistakes can throw off return predictions fast:
- Mixing fully diluted and basic ownership without clear labels
- Failing to update the cap table after option grants or secondaries
- Entering pre-money and post-money valuations incorrectly
Any one of those errors can lead the model to misstate ownership at exit and spit out misleading IRR and MOIC figures.
Market benchmarks and data quality checks
Internal data isn’t enough on its own. AI models also need external benchmarks to calibrate valuation scenarios. That usually means historical revenue and EBITDA multiples by sector and stage, exit values for comparable startups, average time to exit from the first institutional round, typical dilution patterns by round, and macro indicators such as interest rates, inflation, and public market valuations. These benchmarks keep valuation assumptions within realistic bounds.
Benchmark data should be refreshed quarterly or annually. Macro data may need updates more often during volatile periods. Once the inputs are clean and the benchmark set is current, Step 3 can turn them into scenarios.
This is also where a lot of models quietly go off the rails: data quality. Messy books - unreconciled transactions, inconsistent revenue classification, delayed financial closes - add noise that can skew burn trends and push exit scenarios too high. For example, if deferred revenue is recorded as recognized revenue, the model may overstate sustainable ARR, inflate exit valuations, and overpromise investor returns.
A monthly data quality check should cover:
- Bank and credit card reconciliation
- Revenue recognition review
- Headcount verification against payroll
- Spot-checks of customer counts against CRM data
Once those inputs are reconciled, the model can turn them into return scenarios.
Step 3: Build the model and generate investor return scenarios
Now it’s time to build the model. Do it in order: start with the operating forecast, then estimate exit value, then map investor returns.
The drivers need to match the business. For SaaS, that usually means new customer acquisition, expansion, and churn. For marketplaces, the core inputs are GMV, take rate, and liquidity. That part matters more than people think. If you use the wrong drivers, your exit-value scenarios can look neat in a spreadsheet and still point you in the wrong direction.
Once the operating forecast is stable, turn it into projected exit values with stage-fit valuation multiples. Early-stage SaaS companies are often priced at 5–12x forward ARR, depending on growth and net revenue retention. A company with strong retention and faster growth will land in a very different part of that range than one with weaker retention and slowing growth. Apply those multiples across the full forecast horizon - monthly or quarterly for the first 24–36 months, then annually for years 4–10. The goal is a valuation range, not one neat number.
Run scenario analysis and Monte Carlo simulations
At a minimum, run three scenarios: base case, downside, and upside.
- The base case reflects the current plan.
- The downside assumes slower growth, higher churn, delayed fundraising, or lower exit multiples.
- The upside assumes faster adoption, stronger unit economics, and on-time rounds.
Each scenario should set ranges for the variables the simulation will sample from: growth rates, exit multiples, fundraising timing, dilution per round, and exit year.
Monte Carlo simulation pushes those variables through thousands of runs, so you get a distribution of outcomes instead of just three point estimates. Start with 5,000 simulations. Move to 10,000 only if median MOIC and 90th-percentile IRR are still moving around. The output should show a spread of investor outcomes, including median MOIC, IRR, and probability bands - not a single return figure.
Validate the model before sharing it with investors
An untested model is just a spreadsheet. Backtest it against historical data to catch assumptions that don’t hold up. Rolling validation takes that one step further by re-fitting the model at each time step and testing it on the next period. That mirrors how the model will be used in practice.
Before you share anything with investors, document each scenario’s assumptions, top sensitivities, and failure points. Also say where the model starts to break. That kind of honesty saves time and makes the work easier to trust. With current books, Lucid Financials keeps investor-ready reporting synchronized as actuals change.
Step 4: Present AI predictions in an investor-ready format
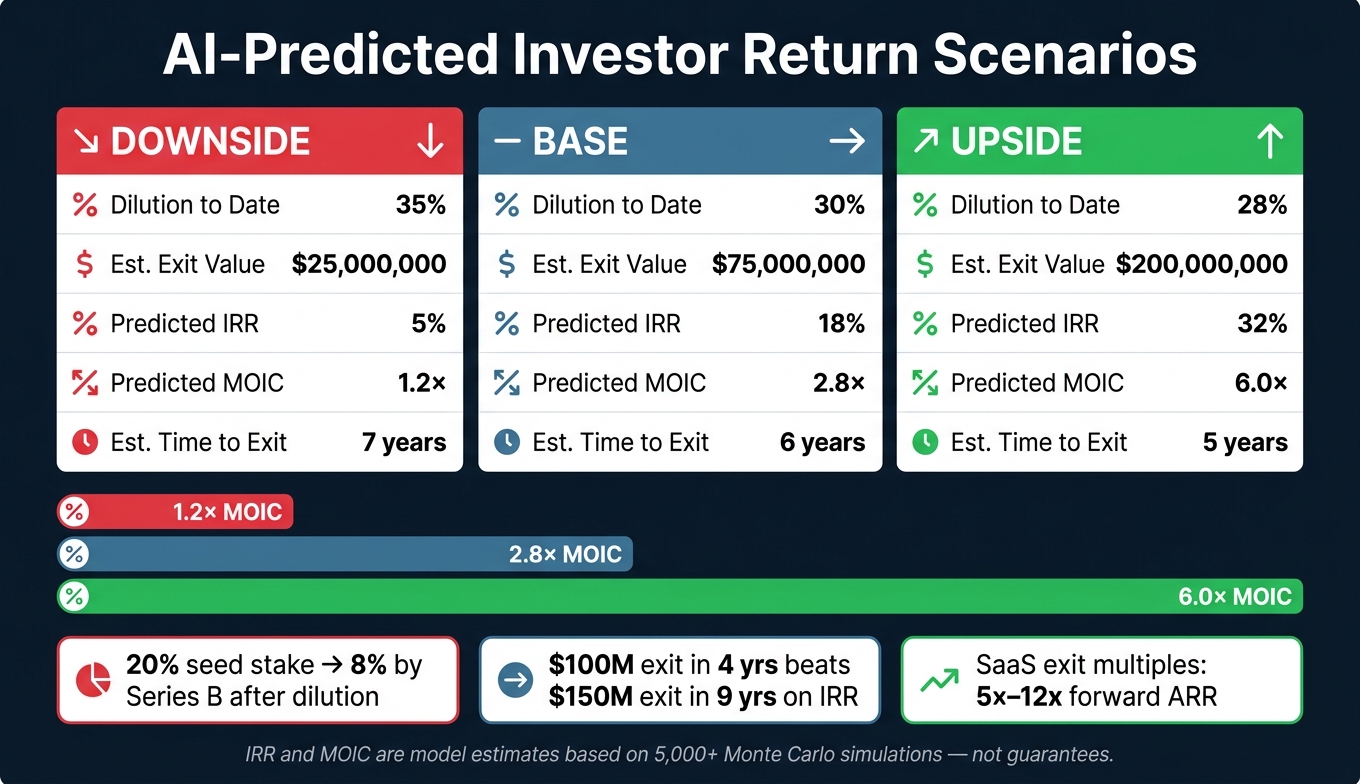
AI Startup Investor Return Scenarios: Downside vs Base vs Upside
After validation, turn the model into something investors can scan in seconds. A validated model only goes so far if the output looks like a data dump. Put the results into a simple deck you can use again and again. And in a board deck, skip the raw simulation output.
Stick to a fixed three-slide flow: summary, forecast, returns. Use U.S. formatting, round numbers, and place actuals next to forecasts so investors can see how close the model is tracking.
Show ranges, assumptions, and key sensitivities
Investors need a quick read on the range of outcomes first. Label scenarios as downside, base, and upside, and map them to the 10th, 50th, and 90th percentiles.
Spell out the assumptions behind each case. A short sensitivity panel can do a lot of work here. For example, show how IRR and MOIC change if CAC rises 20% or churn increases by 5 percentage points. That makes it easy to see where risk sits.
Include a scenario comparison table
Use one table to compare scenarios side by side. Keep the columns the same in every reporting period so investors can track changes over time.
| Scenario | Dilution to Date (%) | Est. Exit Value ($) | Predicted IRR (%) | Predicted MOIC (x) | Est. Time to Exit (yrs) |
|---|---|---|---|---|---|
| Downside | 35% | $25,000,000 | 5% | 1.2x | 7 |
| Base | 30% | $75,000,000 | 18% | 2.8x | 6 |
| Upside | 28% | $200,000,000 | 32% | 6.0x | 5 |
Add a one-line note saying that IRR and MOIC are model estimates, not guarantees. Also, define each scenario with specific drivers. Don’t leave it at broad labels alone.
Conclusion: Use AI forecasts as decision support, not certainty
AI return forecasts work best as a planning tool, not a promise. The workflow is pretty simple: define the right return metric, build from clean financial and cap table data, model multiple scenarios, and state assumptions clearly.
Then keep the deck current as actuals change. Update the model every month as new numbers come in - revenue, cash, cap table changes, and market benchmarks - and flag shifts in the scenario table with a short change log. Lucid Financials keeps books and investor reporting current so the forecast stays tied to actuals.
FAQs
How accurate are AI return forecasts for startups?
AI-powered startup return forecasts are often more precise than manual methods. Traditional models tend to land in the 60%–75% accuracy range. AI-driven methods can reach 90%–98% by using real-time data, machine learning, and Monte Carlo simulation.
That edge doesn’t come from magic. It comes from data.
The reliability of any forecast still depends on data quality. If the historical data is clean, standardized, and reconciled, the forecast is more likely to be accurate. If the data is messy or inconsistent, even a smart model can go off track.
What data do I need before modeling investor returns?
Start with clean, standardized, integrated data pulled from your financial and operating systems.
That means bringing together historical financials like MRR/ARR, bookings, the income statement, balance sheet, cash flow statement, and cap table. You’ll also want pipeline and sales metrics, customer acquisition and retention data, plus any qualitative or external inputs that may shape the model.
Once the data is in one place, clean it up. Remove duplicates, standardize labels, and validate records so the model has data it can trust.
Why can a smaller, faster exit produce a better IRR?
A smaller, faster exit can lead to a better IRR because IRR is highly sensitive to time. The sooner invested capital comes back, the stronger the return can look on an annualized basis.
A shorter holding period also gives investors liquidity sooner. That can improve returns while cutting exposure to market volatility and displacement risk. In many cases, it also creates a clearer path to the target 3–5x return range.