AI makes ESG monitoring simpler by turning scattered records into a repeatable review process. Instead of chasing spreadsheets every quarter, I’d set up a system that pulls data from bills, HR tools, supplier files, safety logs, and accounting records, checks it on a set schedule, flags issues, and sends them to the right person.
Here’s the short version:
- “Real time” usually means regular review, not second-by-second updates
- AI helps with collection, unit cleanup, anomaly flags, and emissions math
- People still own scope, legal review, material calls, and final sign-off
- A clean data setup matters first: source records, naming rules, formulas, timestamps, and approval history
- Each metric needs an owner, reviewer, cadence, and evidence trail
- Before reporting, numbers should be tied back to source files and accounting records
A few points stand out. The article notes one case where anomaly detection cut management time by 50%. It also gives a simple emissions example: 10,000 kWh × 0.4 kg CO2e per kWh = 4 metric tons CO2e. Those examples show the main point: AI is best at repetitive checks, while people handle review and approval.
If I were boiling the full piece down to its core, it would be this:
- Set the scope: decide what you track, why you track it, and who owns it
- Centralize the data: bring records into one system and standardize units, dates, and IDs
- Use AI for checks: find gaps, duplicates, odd swings, and factor issues
- Route alerts: send each issue to finance, HR, procurement, compliance, or leadership
- Reconcile before release: match reported figures to source support and keep sign-off records
The article also makes one practical point that many teams miss: ESG reporting is tied closely to finance. If expense data, invoices, and vendor records are messy, ESG review gets messy too.
In short, this is not about replacing people. It is about cutting manual work, tightening review steps, and making reports easier to defend when investors, customers, lenders, or board members ask questions.
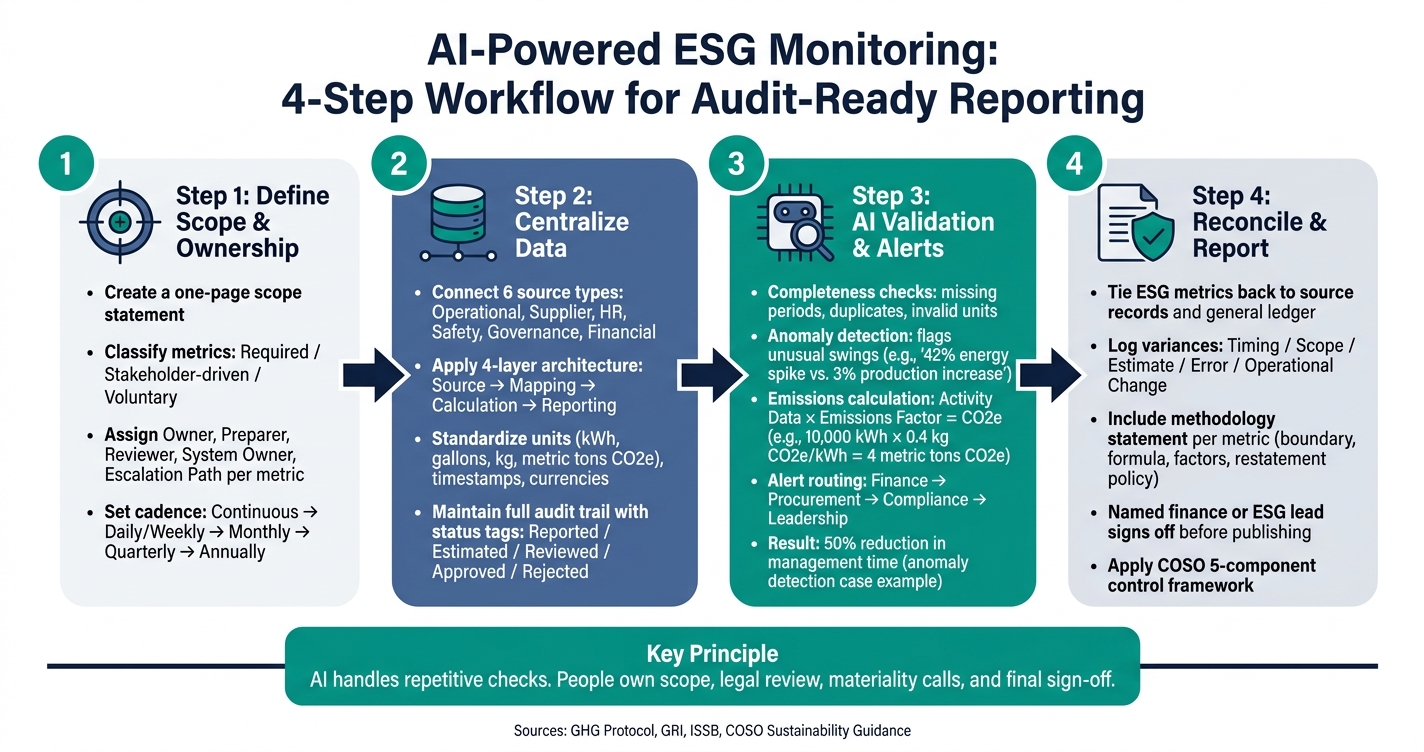
AI-Powered ESG Monitoring: 4-Step Workflow for Audit-Ready Reporting
AI-Powered ESG Intelligence | Machine Learning Project by Alyssa Assilbekova
sbb-itb-17e8ec9
Step 1: Define your ESG scope, obligations, and owners
Start with a one-page scope statement. It should spell out your entities, locations, products, workforce, supply chain, audiences, and what's excluded and why. Review it once a year and again after any major business change. A tighter scope gives AI cleaner inputs and cuts down on false alerts.
Next, sort each topic into one of three buckets: required, stakeholder-driven, or voluntary. Then document the definition, boundary, source, unit, formula, owner, reviewer, evidence, and cadence for each one. AI can help with checks, but only after every metric has a named owner and a clear rule set.
Map material ESG metrics to reporting requirements
Use a practical materiality assessment that weighs business impact, stakeholder demand, reporting relevance, data availability, and risk. For many U.S. startups, a solid starting list includes Scope 1 and Scope 2 greenhouse-gas emissions, relevant Scope 3 categories, electricity use, business travel, workforce headcount and turnover, health and safety, supplier risk, ethics incidents, and governance oversight.
Use the Greenhouse Gas Protocol to classify emissions as Scope 1, 2, or 3. Then map them separately to GRI, ISSB, customer requests, and financing terms.
Rules change. Customer pressure changes too. So your scope statement needs to match today's requirements, not last year's assumptions. Treat legal thresholds as outside inputs, and check them with counsel before calling any metric mandatory.
Set review frequency and internal ownership
Give each metric:
- one owner
- one preparer
- one reviewer
- one system owner
- one escalation path
For example, facilities may own utility and energy data. Procurement may own supplier information. Human resources may own workforce metrics. Finance may reconcile real-time financial insights with reporting periods. Legal or compliance may interpret obligations.
The owner should be accountable for the definition, source data, quality checks, explanations for changes, and on-time sign-off. A separate reviewer should check unusual movements, estimates, methodology changes, and supporting documentation. Small startups can combine roles, but for high-risk metrics, it's smart to keep some separation of duties and record who prepared and approved each reporting period. That gives AI a clear set of rules to monitor.
Use the register to match review cadence to risk and control needs.
| Metric category | Typical update frequency | Primary owner |
|---|---|---|
| Safety events, ethics reports, energy telemetry, critical compliance alerts | Continuous / near real time | Legal or compliance; facilities or operations |
| Operational exceptions and data-quality issues | Daily or weekly | Metric owner and reviewer |
| Energy, emissions activity data, headcount, supplier incidents, financial reconciliations | Monthly | Facilities or operations, HR, procurement, finance |
| Management review, risk assessment, board reporting, investor-oriented dashboards | Quarterly | Executive leadership or the board |
| Selected disclosures, methodology review, boundary confirmation, external assurance preparation | Annually | Finance, sustainability, legal, or compliance |
Step 2: Build a Centralized ESG Data Foundation
With scope and ownership in place, the next job is the data layer that supports both. After metrics have owners and rules, pull the data into one place. Connect the source systems, document each calculation, and make sure every reported number can be traced back to where it came from. That’s what shifts ESG reporting from a once-in-a-while cleanup project to steady, month-by-month monitoring.
Connect Operational, Supplier, HR, and Financial Data Sources
A simple way to organize ESG data is to split it into six source types.
- Operational sources: utility data, fleet records, travel platforms, and waste logs
- Supplier and procurement sources: vendor records, purchase orders, supplier questionnaires, and logistics data
- HR sources: payroll, headcount, workforce demographics, and training records
- Safety sources: incident logs, workers' compensation records, and near-miss reports
- Governance sources: board minutes, ethics hotline cases, policy acknowledgments, and risk-register entries
- Financial sources: the general ledger, accounts payable, purchasing cards, and fixed-asset records
That last group matters a lot because it gives you a strong cross-check.
Use financial records to confirm that supplier invoices, travel expenses, and facility purchases landed in the right reporting period. Compare accounts payable against meter readings, or fuel-card spend against fleet mileage. When the numbers don’t line up, dig in. In many cases, the gap comes from timing, prepaids, or shared facilities. If the difference is material, send it to the right owner in finance, operations, procurement, or HR to sort out.
Standardize Units, Timestamps, and Audit Trails
Once the sources are connected, standardize how data is stored and how calculations are applied. Different systems speak in different formats, which is where things can get messy fast. A four-layer setup helps keep order:
- a source layer that keeps original records unchanged
- a mapping layer that fixes naming issues, so "NY office", "New York HQ", and "NYC-01" all point to one approved facility ID
- a calculation layer that applies documented formulas, emissions factors, allocation rules, and currency conversions
- a reporting layer that shows approved metrics by month, quarter, facility, business unit, supplier, and ESG category
Some fields cause more trouble than others, so standardize them early. Record electricity in kilowatt-hours, fuel in gallons, mass in pounds or kilograms, distance in miles, and emissions in metric tons of carbon dioxide equivalent. Use one time zone and one reporting-period rule, whether that’s a calendar year or fiscal year. Store financial values in U.S. dollars, such as $125,000.00. Give every data point a status: reported, estimated, reviewed, approved, or rejected.
The GHG Protocol states that activity data is multiplied by an emissions factor to derive emissions, so the activity unit and emissions-factor unit must be compatible - for example, kilowatt-hours multiplied by kilograms of carbon dioxide equivalent per kilowatt-hour.
For each metric, keep the original source record, source-system name, record identifier, reporting period, applicable location or business unit, the original and normalized values, the unit conversion, and the formula or emissions factor used, including its version date. Also keep any assumptions, exclusions, or judgments, plus a log of who created, reviewed, and approved the value. Add timestamps and a history of later changes.
That audit trail lets a reviewer - or an external assurance provider - rebuild your reported number from scratch. It also gives finance and compliance teams what they need before a report is released.
With the data foundation in place, AI can check completeness, flag anomalies, and trigger corrective action.
Step 3: Use AI to Validate Data, Detect Issues, and Trigger Action
Once your data base is set up, AI can handle the repetitive checks that come up every reporting cycle.
Automate Completeness Checks, Anomaly Detection, and Emissions Calculations
The first job is simple: make sure every required data point showed up.
That includes checking for missing reporting periods, duplicate records, invalid units, and timestamps outside the reporting window. In utility data, for example, the system might flag a missing July 2026 electricity bill, two identical invoices uploaded for August, or energy reported in kilowatt-hours one month and megawatt-hours the next. Every exception should keep the original source record, ingestion time, responsible data owner, and resolution history so a reviewer can trace the issue back to its source.
Baselines matter here. Use month over month, year over year, or per unit of output or headcount, depending on what fits the metric. Otherwise, normal business changes can set off bad alerts. A good alert explains the comparison in plain English, like this: electricity consumption increased 42% from the prior month while production increased 3%. That extra context helps the owner decide whether to investigate or close the exception.
The calculation engine also needs a clear audit trail. Each activity record should connect to a documented emissions factor, unit conversion, boundary, reporting period, and methodology version. At the most basic level, the workflow multiplies activity data by the right emissions factor and, when needed, applies global-warming-potential values to express the result in CO2e.
For instance, 10,000 kWh multiplied by an approved factor of 0.4 kg CO2e per kWh equals 4 metric tons CO2e. AI can suggest the likely factor, flag missing factors, and calculate estimates. But a qualified owner should approve any material change, boundary update, supplier-specific factor, or estimate before it goes into the report.
After the checks pass, exceptions should go straight to the right owner so the fix happens before reporting.
Route Alerts to the Right Teams and Close the Issue
An alert only helps if it lands with the right person and includes enough detail to act.
Each alert should spell out the affected metric, reporting period, source record, detected condition, severity, owner, deadline, and next step. For example: Scope 2 electricity emissions for August 2026 increased 28% versus the rolling six-month baseline; source: Chicago facility utility invoice; estimated impact: 12.4 metric tons CO2e; next step: verify the invoice and confirm whether a production or meter change occurred.
From there, the workflow should follow a controlled path: detect → validate → assign → investigate → remediate → approve → retain evidence. Finance handles alerts tied to utility invoices or accruals. Procurement deals with supplier-data exceptions. Compliance takes control failures or reporting gaps. Leadership monitors unresolved high-severity issues through a dashboard or scheduled briefing.
Escalation rules should notify a manager when an issue is overdue, financially material, or still open after a set number of review cycles. And the corrected invoice, supplier email, calculation file, or sign-off should be stored as evidence.
That’s how you move from detection to correction, and from spot checks to continuous monitoring.
Different AI tools support different controls, so it helps to match the tool to the job.
Comparison Table: Automation vs. Anomaly Detection vs. Forecasting vs. Generative AI
| AI Capability | Appropriate ESG Use Cases | Typical Inputs | Required Review Control |
|---|---|---|---|
| Automation | Collecting utility bills, checking required fields, converting units, applying approved emissions factors, and producing recurring dashboards | Structured invoices, meter data, HR records, supplier forms, emissions-factor libraries | Validate workflow rules, unit conversions, factor versions, and sample outputs |
| Anomaly detection | Flagging duplicate invoices, missing periods, unusual energy or water usage, emissions-intensity shifts, safety-incident spikes, or inconsistent supplier responses | Historical metrics, facility or peer baselines, production data, headcount, timestamps, source records | Owner investigates, documents explanation, and approves closure |
| Forecasting | Estimating expected energy demand, emissions trajectory, supplier completion rates, or likely reporting gaps before period close | Historical ESG data, seasonality, production plans, headcount, facility changes, business plans | Review assumptions and forecast error; label projections clearly |
| Generative AI | Summarizing exceptions, drafting investigation notes, explaining metric changes, and locating supporting evidence | Approved ESG records, policies, calculation notes, tickets, evidence files | Human fact-checking and approval; final evidence-backed version retained |
A smart place to start is with automation and anomaly detection for a small group of high-value metrics. Once that process is steady, you can expand into reconciliation and audit-ready reporting.
Step 4: Produce Audit-Ready Reports and Strengthen Financial Controls
Reconcile ESG Metrics Before Reporting
Once AI has flagged and closed exceptions, the last step is to reconcile ESG metrics to the books before anything goes out the door.
Collecting and checking ESG data isn't enough. Before a metric is shared with investors, lenders, customers, or your board, tie it back to the source records that support it. If there's a variance, log it as timing, scope, estimate, error, or operational change. Include the source amount, reported amount, reason, and resolution date.
Each material metric also needs a short methodology statement. That statement should cover:
- boundary
- included activities
- measurement units
- reporting frequency
- source data
- formula
- factors
- estimation rules
- restatement policy
For example, Scope 2 data may use utility-bill kWh and a documented conversion factor.
Before publishing, a named finance or ESG lead should sign off that the metric has an owner, boundary, methodology, source data, calculation logic, review evidence, and an explanation for major changes. COSO's sustainability guidance applies the same control framework used for financial reporting, using the same five components: control environment, risk assessment, control activities, information and communication, and monitoring activities. Even if your startup isn't subject to public-company disclosure rules today, this kind of rigor improves the reliability of voluntary reports, lender or customer questionnaires, board materials, and investor diligence.
Where Lucid Financials Fits in the Workflow
That financial control layer is where Lucid Financials comes in.
ESG monitoring doesn't sit apart from your books. Lucid Financials supports the financial-control layer by keeping vendor and expense data organized and current, and by keeping tax-credit documentation aligned with the books. In plain English, that makes it easier to match procurement spend with supplier emissions data or tie utility invoices to energy consumption figures. Cleaner books also make ESG reconciliations faster and easier to trace.
Lucid does not replace operational ESG data owners, emissions methodologies, legal or compliance review, third-party assurance, or management's duty to approve disclosures. Its role is narrower: keep the financial base in good shape so the numbers feeding ESG reconciliations stay current and traceable.
Conclusion: A Practical Rollout Plan for Startup Teams
With the financial base aligned, the last step is putting the report package together for review and sign-off.
Follow this sequence: define scope → build the data foundation → run AI checks → complete reconciliations → produce the report package. For most small startups, a quarterly cadence is enough. Some metrics need closer attention, though, especially high-risk ones like environmental spending tied to cash flow, contractual sustainability targets, or data used in external filings. The process should match your obligations and risk profile.
That is the core promise of AI-assisted ESG monitoring: less manual work, stronger financial controls, and a repeatable path for a small team to produce audit-ready reporting.
FAQs
What does real-time ESG monitoring mean?
Real-time ESG monitoring shifts teams away from static annual reporting and toward a continuous, automated way to track sustainability data.
AI-powered systems pull data from sources like ERP systems, HRIS platforms, and IoT sensors. They then validate that data, flag missing values or unusual patterns, and alert teams when regulations change.
The payoff is pretty simple: disclosures stay accurate, audit-ready, and in line with current standards.
What ESG data should we centralize first?
Start with the core data: Scope 1–3 emissions, utility usage, and invoices. At the same time, pull in key financial sources like bank accounts, credit cards, payroll systems, and payment platforms.
Then add operational logs and HR data, including diversity and pay equity metrics. That gives you a clearer link between sustainability reporting and financial oversight.
Lucid Financials brings all of these inputs into one platform for real-time, audit-ready reporting.
How do we know when AI flags need human review?
AI flags anomalies, inconsistencies, missing values, and deviations from normal business patterns in real time.
But AI summaries can get things wrong. That’s why human review matters for every flagged item. People need to confirm accuracy, check the evidence, cut down on false positives, and make tougher compliance calls that need expert judgment.