AI-powered portfolio benchmarking tools are transforming how investors evaluate performance and manage risk across various asset classes. These tools leverage advanced metrics, real-time data, and machine learning to provide deeper insights into portfolio performance. Here's what you need to know:
- Core Features: Tools integrate metrics like Sharpe Ratio, Sortino Ratio, and VaR to assess risk-adjusted returns.
- AI Capabilities: Include automated data ingestion, scenario modeling, anomaly detection, and natural language processing for faster decision-making.
- Popular Platforms:
- Lucid Financials: Tailored for startups, offering real-time financial insights and investor-ready reports.
- AlphaSense: Combines generative AI search and smart alerts for institutional investors.
- Aladdin by BlackRock: Comprehensive for multi-asset portfolios, with advanced risk modeling.
- Morningstar Direct: Focuses on long-term historical data and AI-assisted portfolio analysis.
- QuantConnect LEAN: Open-source platform for developers, supporting algorithmic trading and risk management.
Quick Comparison
| Tool | Best For | Key Features |
|---|---|---|
| Lucid Financials | Startups | Real-time metrics, Slack integration, scenario modeling |
| AlphaSense | Institutional investors | AI-driven search, smart alerts, ESG screening |
| Aladdin by BlackRock | Large asset managers | Multi-asset coverage, advanced risk metrics, machine learning optimization |
| Morningstar Direct | Wealth advisors | Historical data since 1975, AI assistant for portfolio reviews |
| QuantConnect LEAN | Developers, hedge funds | Open-source, algorithmic trading, ML integration, customizable strategies |
These tools cater to a range of users, from startups to institutional investors, offering tailored solutions for benchmarking and risk management. Choose based on your portfolio needs, asset coverage, and desired level of customization.
Portfolio Optimization With AI-Powered Spreadsheet: Maximizing Risk-Adjusted Returns
sbb-itb-17e8ec9
1. Lucid Financials

Lucid Financials is an AI-powered accounting platform designed specifically for startups and rapidly growing companies. It offers a full suite of services, including bookkeeping, tax support, and CFO-level assistance, while also providing portfolio benchmarking tailored to the needs of private company founders.
One of its standout features is industry-specific benchmarking. Lucid Financials provides metrics like Customer Acquisition Cost (CAC), company valuation, and competitor insights, all customized to your sector. This is especially helpful for founders who need to measure their performance against peers or manage the complexities of multi-entity structures. The platform also incorporates advanced risk-adjusted evaluations, ensuring a more nuanced financial analysis.
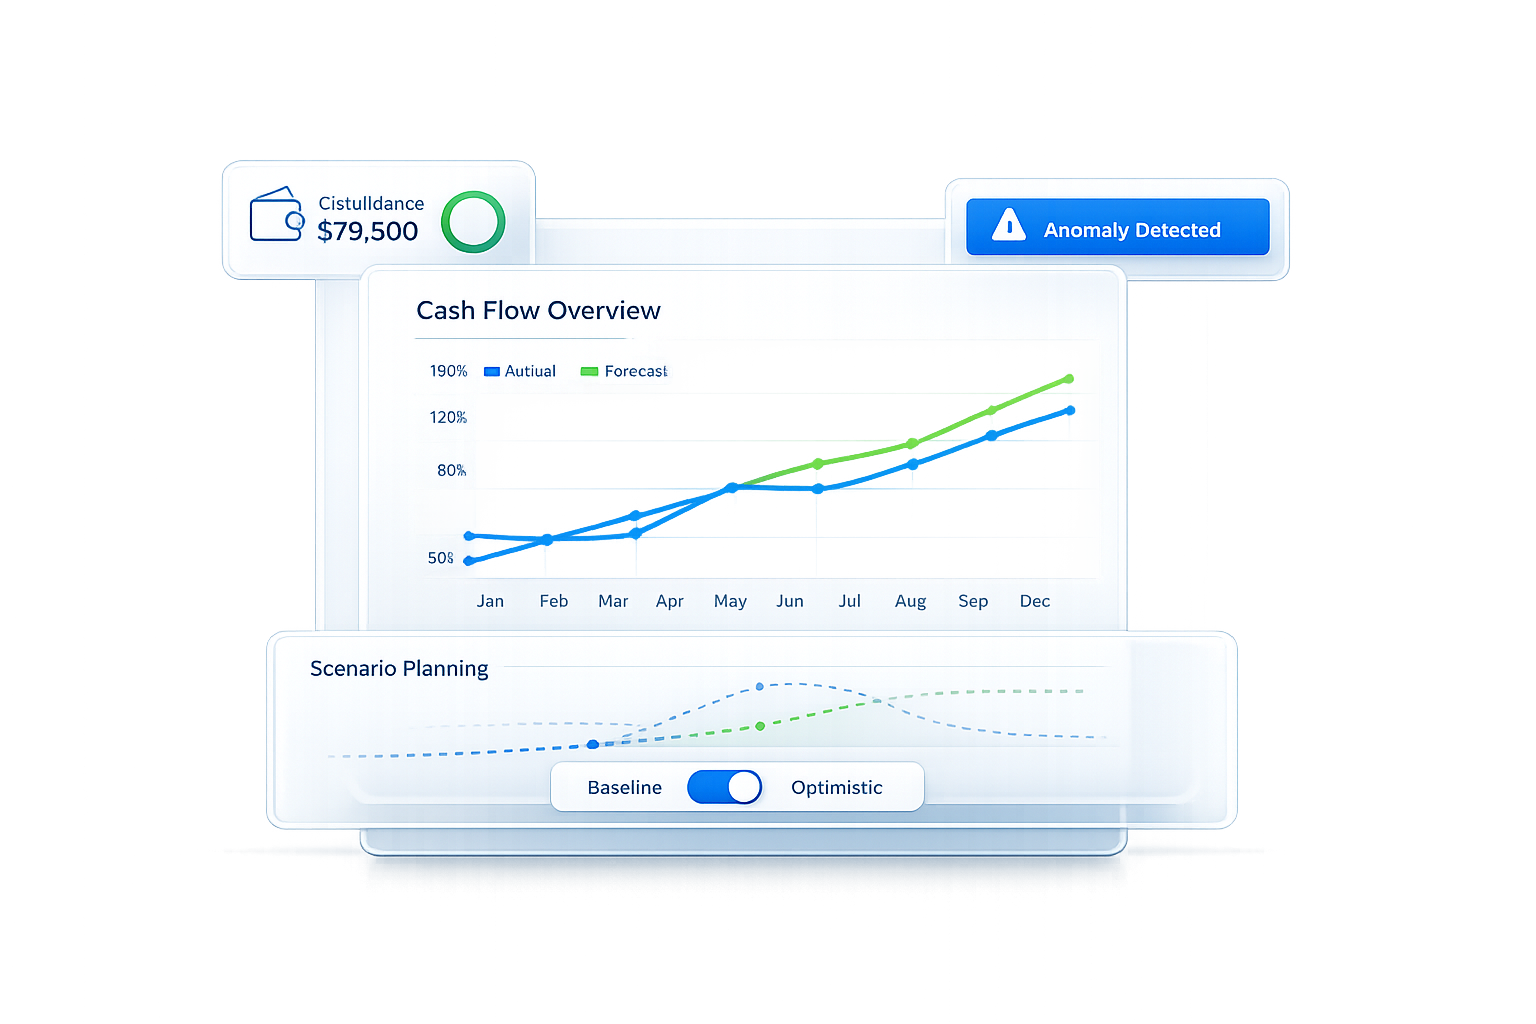
When it comes to risk assessment, Lucid Financials goes the extra mile by calculating key metrics such as the Sharpe ratio, Sortino ratio, alpha, and beta. These tools help investors evaluate portfolio performance while keeping an eye on potential risks. Additionally, its AI-powered scenario modeling offers clear insights into best-case, worst-case, and actual outcomes, providing a balanced view of both risks and opportunities.
The platform doesn't stop there. It integrates seamlessly with tools like QuickBooks and Slack, enabling users to monitor burn rates and runway in real time. It also simplifies the process of creating investor-ready reports, making financial management more efficient and transparent.
With a track record of serving 60,000 small businesses - including companies like Lumino Technologies, which handles over $200 million in payments - Lucid Financials has proven itself across industries such as fintech, healthcare, and e-commerce. Its consistent 5-star rating speaks volumes about its reliability and effectiveness.
Here’s a quick overview of Lucid Financials' key features:
| Feature | Details |
|---|---|
| Risk-Adjusted Metrics | Sharpe, Sortino, alpha, beta |
| Benchmarking Scope | CAC, valuation, competitor insights by sector |
| Integrations | QuickBooks, Slack |
| Scenario Modeling | Best-case, worst-case, actual |
| Pricing | Starting at $150/month |
| Compliance | SOC 2 aligned |
2. AlphaSense Portfolio Intelligence
AlphaSense Portfolio Intelligence simplifies the complex task of overseeing diverse asset classes for institutional investors. It covers a broad spectrum, including public equities, private equity, venture capital, ETFs, and M&A, with data on over 19,000 public companies and 1 million private companies - helping to eliminate potential blind spots.
The platform's Generative Search feature lets analysts ask plain-English questions and receive synthesized, citation-backed answers. These answers pull from sources like earnings calls, expert transcripts, and broker research, reducing the time spent preparing for quarterly earnings by 60%.
AlphaSense takes this a step further with Smart Alerts, which track watchlists in real time. The system flags key developments like earnings surprises, rating changes, and shifts in management sentiment - often before the market reacts. This proactive approach supports better risk-adjusted decision-making. For risk management, the tool also provides AI-powered ESG screening and automated detection of regulatory or litigation risks. One portfolio manager highlighted how AlphaSense spotted a competitive threat three weeks before it became public knowledge, giving them time to adjust positions and safeguard client assets.
When it comes to integration, AlphaSense offers an Excel Add-In that allows users to import financial statements, ratios, and KPIs with a single click. It also provides access to over 4,500 pre-built Canalyst financial models and industry comparables across 115+ sectors. These include sector-specific metrics like the Rule of 40 for SaaS companies and RevPAR for the hospitality industry.
Trusted by 90% of the top asset management firms and used by 88% of the S&P 100, AlphaSense stands out as a go-to tool for institutional investors.
| Feature | Capability |
|---|---|
| Asset Class Coverage | Public equities, private equity, venture capital, ETFs, M&A |
| Generative Search | Natural language queries with citation-backed answers |
| Smart Alerts | Real-time notifications for earnings surprises and sentiment changes |
| Industry Comps | Over 115 pre-built peer sets with sector-specific KPIs |
| Excel Add-In | One-click data updates into custom models |
| Security | SOC 2 certified; does not use customer data for training |
3. Aladdin by BlackRock
BlackRock's Aladdin platform is a powerhouse for institutional investors, overseeing an impressive $21.6 trillion across 30,000+ portfolios. Supported by a team of over 5,500 professionals, Aladdin provides a comprehensive, risk-aware view of portfolios, spanning a wide range of asset classes.
Aladdin's coverage is extensive, including equities, fixed income, derivatives, structured products, ETFs, and alternative investments like private credit and infrastructure. Through integrations with tools like eFront and Preqin, the platform consolidates both public and private market data, offering a "Whole Portfolio" perspective. This unified approach enables precise risk-adjusted benchmarking, leveraging over 5,000 multi-asset risk factors and analyzing more than 300 risk and exposure metrics daily. These include advanced techniques like Value at Risk (VaR), Monte Carlo simulations, and factor risk decomposition.
The platform's risk engine is designed to identify vulnerabilities through detailed holdings-based analysis and stress testing, simulating scenarios such as global pandemics or financial crises. On top of this, its AI component, Aladdin Copilot, uses machine learning to detect anomalies, optimize portfolios, and even generate alpha.
"Technology, as you'd expect, pretty much underpins the investment process. So, technology is critical for us in leveraging the data that's available, allowing people to run their simulations around risk and returns in developing quantitative investment strategies to support where we are allocating the money, as well." - Peter Curtis, Chief Operating Officer, AustralianSuper
Aladdin also excels in integration, simplifying data management and enabling custom analytics. It offers three key integration tools:
- Aladdin Studio: A developer-friendly environment with APIs for Python, Java, and C++, allowing teams to create tailored applications.
- Aladdin Data Cloud: Built on Snowflake, this tool centralizes internal and external data into one warehouse and seamlessly connects with business intelligence tools.
- Aladdin Tools for Excel (ATX): A plugin for direct, programmatic data retrieval, ideal for generating custom reports.
Given its capabilities, Aladdin is tailored for firms managing substantial assets, with enterprise licensing costs potentially reaching hundreds of thousands of dollars annually.
| Feature | Aladdin Capability |
|---|---|
| Asset Coverage | Equities, fixed income, derivatives, private credit, infrastructure, ETFs |
| Private Market Data | Integrated via eFront and Preqin |
| Risk Metrics | VaR, stress testing, Monte Carlo scenarios, factor risk decomposition |
| AI Features | Aladdin Copilot, ML-driven alpha generation, AI-driven exception handling |
| Integration Options | Aladdin Studio (APIs), Aladdin Data Cloud (Snowflake), ATX (Excel plugin) |
4. Morningstar Direct

Morningstar Direct is a go-to platform for institutional investors who need dependable historical data for benchmarking. It offers monthly performance data stretching back to 1975 and portfolio holdings for U.S. Open-End Mutual Funds starting in early 1997. This extensive historical range makes it ideal for analyzing long-term trends and conducting in-depth benchmarking.
For risk-adjusted performance, the platform provides a robust set of metrics, including the Sharpe ratio, Sortino ratio, Treynor ratio, information ratio, tracking error, beta, and upside/downside measures. Users can perform time series calculations across 150 data points and leverage confidence zones for better statistical clarity.
Morningstar Direct also boasts comprehensive asset class coverage. It includes U.S. and European mutual funds, ETFs, separate accounts, variable annuities, closed-end funds, and market indexes. Users can create blended benchmarks to evaluate manager performance based on criteria aligned with specific portfolio strategies. To enhance its offerings further, the platform has integrated advanced AI features.
A standout addition is the AI assistant in the Direct Advisory Suite. This tool lets advisors handle natural-language requests for tasks like client setup, portfolio analysis, and report generation - all without switching modules. It simplifies portfolio reviews and report creation, making risk analysis more efficient.
"Our AI assistant delivers outcome-orientated support so advisors can walk into client conversations better prepared to deliver high-quality guidance." - Thomas Aviles, Head of Advisor Software, Morningstar
For tech-savvy users, the platform offers the morningstar_data Python library, which delivers investment data in Pandas DataFrames. This library supports seamless integration into financial modeling workflows and includes functions like get_investment_data, get_returns, and get_excess_returns for automated data retrieval. Pricing is customized based on institutional requirements.
| Feature | Details |
|---|---|
| Risk-Adjusted Metrics | Sharpe, Sortino, Treynor, information ratio, tracking error, beta, and upside/downside measures |
| Historical Data Depth | Monthly performance data since 1975; portfolio holdings for U.S. Open-End Mutual Funds from 1997 |
| Asset Class Coverage | U.S. & European mutual funds, ETFs, separate accounts, variable annuities, closed-end funds, indexes |
| AI Capability | Natural-language AI assistant in Direct Advisory Suite (launched March 2026) |
| Integration | Python SDK (morningstar_data), Pandas DataFrames, MCP connections |
5. MSCI Barra Portfolio Manager
MSCI Barra Portfolio Manager is a cloud-based platform designed for equity investors, with capabilities that extend across multiple asset classes through MSCI's ecosystem. This includes coverage of fixed income, private equity, hedge funds, real estate, and private credit. The platform calculates essential risk-adjusted metrics such as alpha, total risk, active risk (tracking error), and factor-based risk attribution. It also helps distinguish true managerial skill from systematic exposures.
"Evaluate manager skill by separating true alpha from systematic exposures." - MSCI
The platform’s GenAI-powered portfolio insights simplify complex risk data into actionable summaries, enabling investors to identify true alpha while understanding systematic risks. These AI-driven insights enhance decision-making efficiency, speed, and team collaboration.
MSCI offers flexible integration options, making analytics accessible through APIs, Snowflake, data cloud providers, and OMS partnerships. Automated ETL processes streamline data loading, while the Formula Builder tool allows users to integrate proprietary factors and custom attributes for tailored analysis.
| Feature | Details |
|---|---|
| Risk Metrics | Alpha, total risk, active risk (tracking error), factor-based attribution |
| Attribution Frameworks | Traditional (Brinson), factor-based, and hybrid |
| AI Capabilities | GenAI-powered summaries, anomaly detection, and limits monitoring via AI Portfolio Insights |
| Asset Coverage | Equities (primary), fixed income, private equity, hedge funds, real estate, private credit |
| Integration Options | APIs, Snowflake, data cloud providers, and OMS partnerships |
The platform's integration with MSCI's ecosystem and its extensive risk metrics make it a powerful tool for precise risk-adjusted benchmarking. Notably, MSCI's models cover over 90,000 securities across 49 industries and more than 85 countries, with reference data sourced from nearly 80 vendors. With over five decades of factor modeling expertise, this extensive coverage provides a reliable foundation for benchmarking portfolios on a global scale.
6. Bloomberg PORT
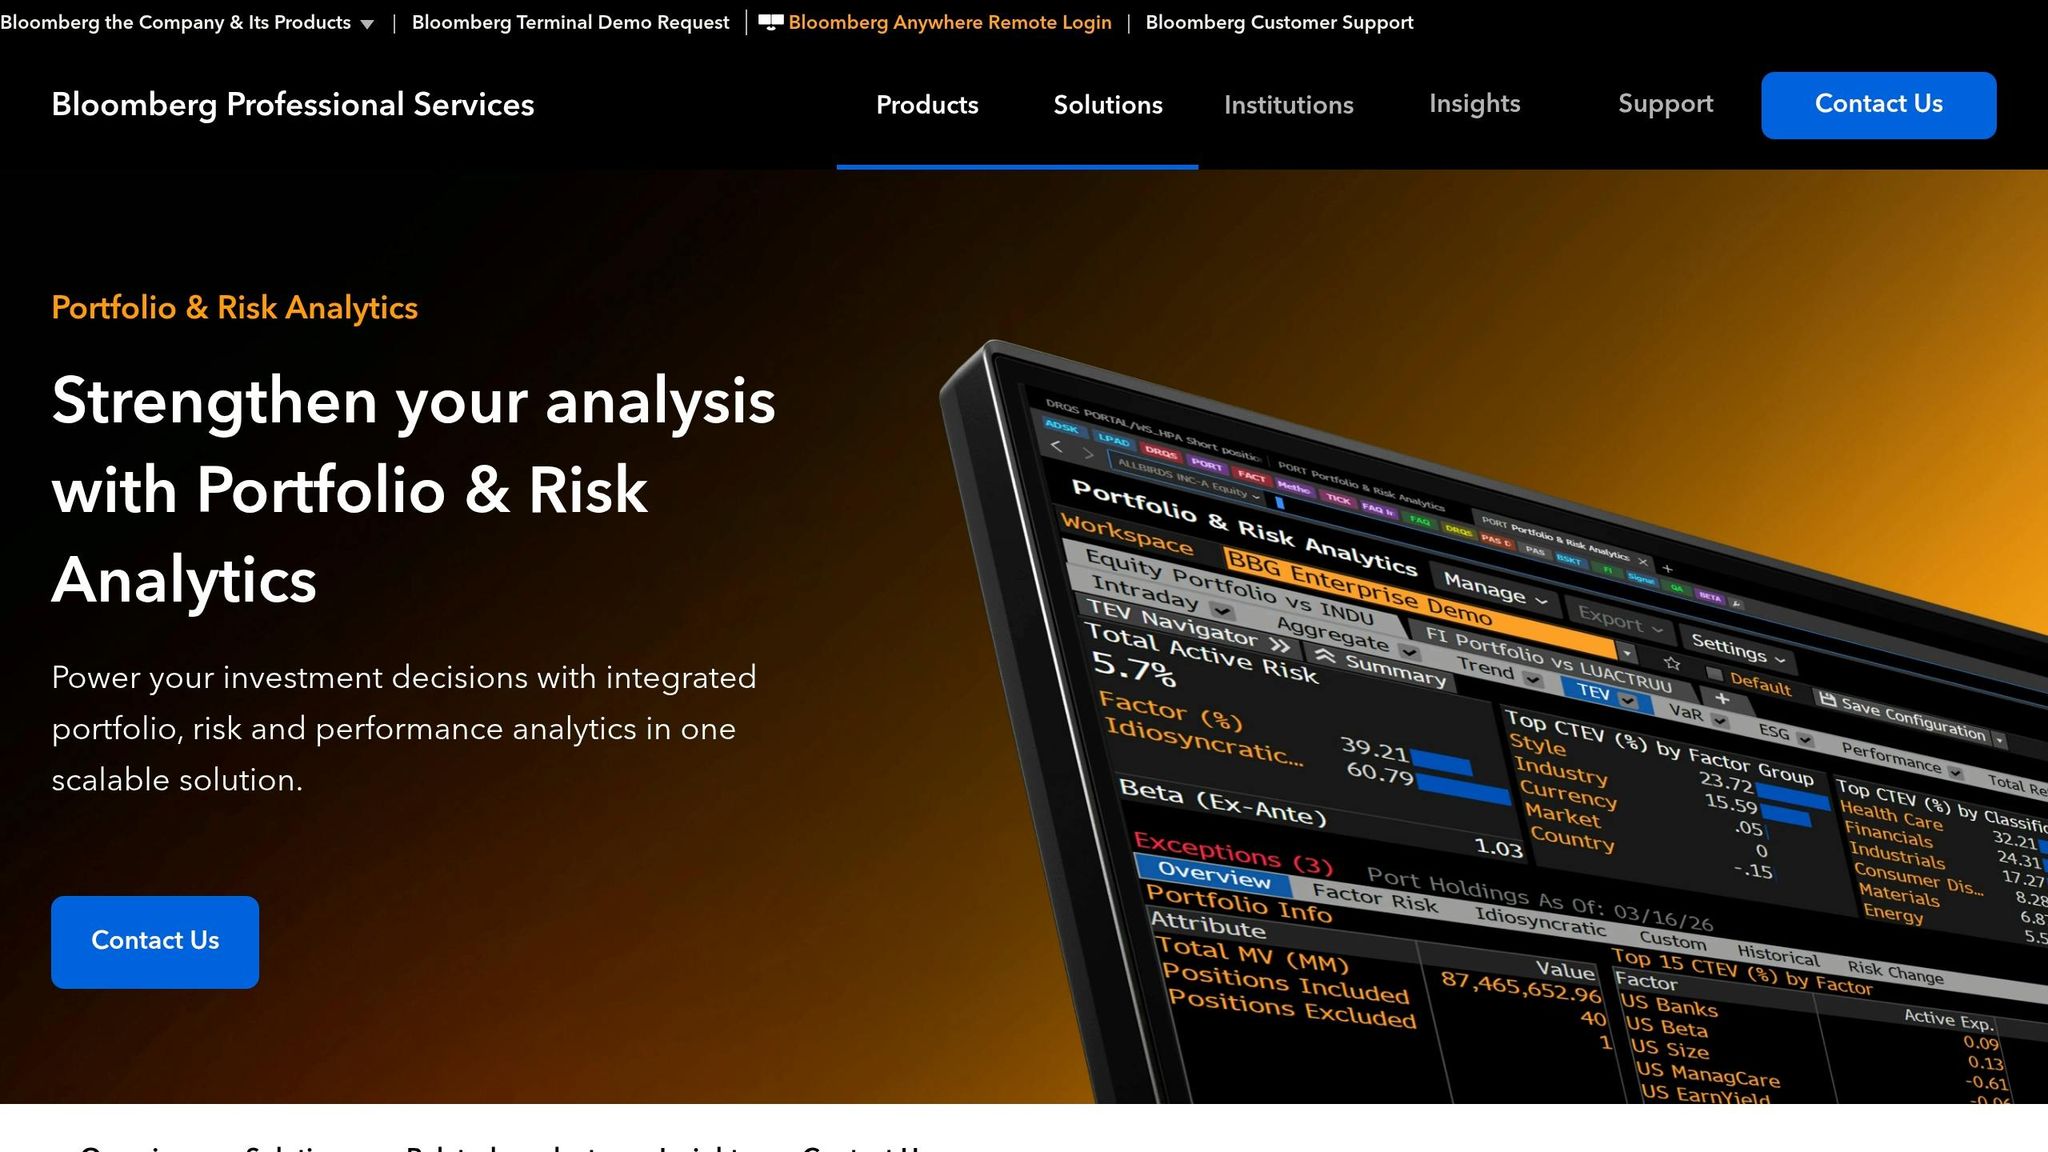
Bloomberg PORT is a portfolio analytics tool centered on the MAC3 (Multi-Asset Class Factor Risk) framework. This system offers a unified approach to risk measurement across various asset classes, including equities, fixed income, commodities, currencies, and private markets. With a robust library of over 3,000 risk factors - spanning 700+ equity, 1,000+ fixed income, 300+ commodity, and 340+ currency factors - it provides comprehensive risk analysis capabilities.
MAC3 goes further by incorporating specialized models tailored for private equity, credit, real estate, infrastructure, and hedge funds, covering approximately 50,000 funds. This approach addresses the challenge of fragmented risk measurement between public and private holdings, offering a consistent framework for institutional investors.
"Institutional investors are increasingly allocating across both public and private markets, yet risk is often measured in silos. With these new models, MAC3 delivers a consistent, cross-asset factor framework..." - Jose Menchero, Head of Portfolio Analytics Research, Bloomberg
PORT Enterprise also integrates AI to enhance portfolio insights. Two standout features include:
- AI Portfolio Commentary: This tool automatically generates narrative summaries of portfolio performance, combining attribution data with real-time Bloomberg News, which publishes over 5,000 stories daily.
- ASKB: A conversational AI interface (beta launched in April 2026) that allows users to query portfolio data in plain language. It can identify volatility drivers, analyze active bets, and explain historical performance trends.
| Feature | Details |
|---|---|
| Risk Metrics | Factor exposures, Key Rate Risk, Greeks (Delta, Vega), VaR, volatility forecasting |
| AI Capabilities | AI Portfolio Commentary; ASKB conversational AI interface |
| Asset Coverage | Equities, Fixed Income, Commodities, Currencies, Private Equity, Private Credit, Real Estate, Infrastructure, Hedge Funds |
| Integration Options | AIM, RMS, MARS, API access, CSV risk model files, Third Bridge, Second Measure |
| MAC3 Model Horizons | Six horizons - from responsive daily models to stable long-term models |
These tools provide precise risk-adjusted performance tracking across a wide range of asset classes. PORT seamlessly integrates with Bloomberg's broader ecosystem, including AIM for order management, RMS for research, and MARS for multi-asset risk. The PORT Enterprise tier, available as an upgrade to the standard Terminal subscription, unlocks advanced features like performance attribution, batch reporting, and AI-driven tools.
7. FactSet Portfolio Analytics
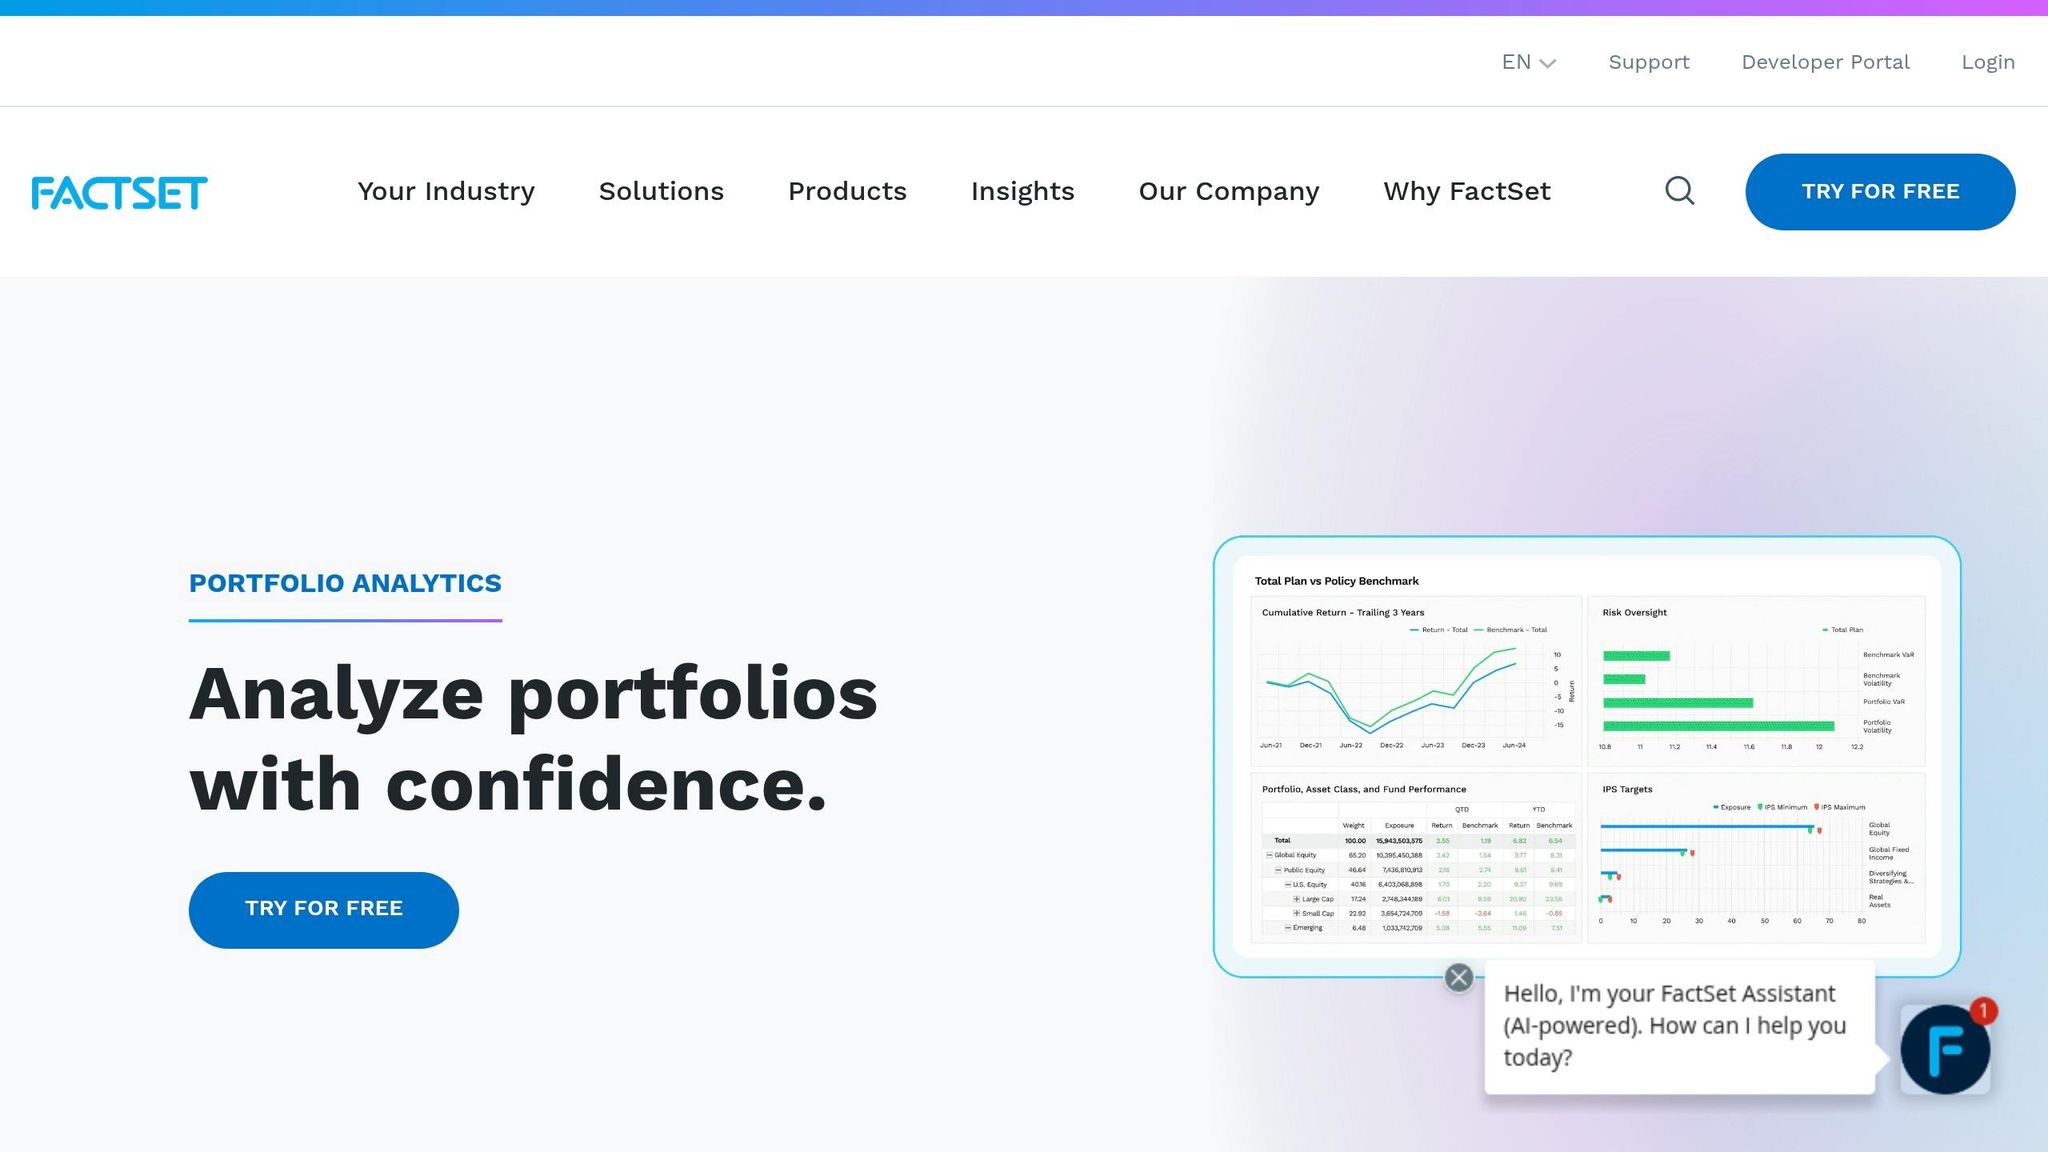
FactSet Portfolio Analytics provides in-depth, returns-based analysis and detailed attribution, helping portfolio managers conduct precise risk-adjusted benchmarking. Its Style Performance and Risk Analysis (SPAR) engine delivers over 70 risk and regression statistics, including key metrics like alpha, beta, standard deviation, r-squared, and tracking error. This gives portfolio managers a comprehensive view of performance adjusted for risk. Peer benchmarking capabilities allow comparisons against databases such as Lipper, Morningstar, eVestment, Mercer, Investment Metrics, and PSN.
The platform includes more than 10 attribution models, such as Fixed Income Attribution and Investment Process Attribution, to identify the specific factors driving returns relative to benchmarks. These tools lay the groundwork for advanced, AI-powered solutions that elevate analysis further.
One standout feature is the GenAI-powered Portfolio Commentary tool, which generates source-linked attribution summaries in just 30–60 seconds. These summaries cover executive overviews, sub-period analyses, benchmark comparisons, and security-level impacts, cutting commentary drafting time by up to eight times.
"We anticipate this enhancement will enable asset managers... to reduce the time spent writing portfolio commentary by a factor of eight and thus focus on the more high-value, strategic priorities of improving performance." - Chris Ellis, Executive Vice President, Head of Strategic Initiatives, FactSet
FactSet also ensures smooth data integration to support performance tracking. It connects seamlessly with platforms like Snowflake, Databricks, Amazon Redshift, Power BI, and QlikSense. For developers, APIs for the SPAR Engine and PA Engine are available through SDKs in Python, Java, and .NET. Additionally, firms using Addepar benefit from a standardized OAuth-based API integration, enabling daily synchronization of client holdings into FactSet's tools. FactSet’s excellence in multi-asset analytics and data connectivity earned it the title of "Best Data Platform for Risk & Portfolio Analytics".
| Feature | Details |
|---|---|
| Core Risk Metrics | Alpha, Beta, Standard Deviation, R-Squared, Tracking Error |
| Total Risk Stats | 70+ regression and risk statistics |
| Attribution Models | 10+ models, including Fixed Income and Investment Process Attribution |
| AI Capabilities | GenAI portfolio commentary; natural language queries via FactSet Mercury |
| Peer Benchmarking | Lipper, Morningstar, eVestment, Mercer, Investment Metrics, PSN |
| Data Integrations | Snowflake, Databricks, Amazon Redshift, Power BI, QlikSense, Addepar |
8. StyleAnalytics Factor Analytics
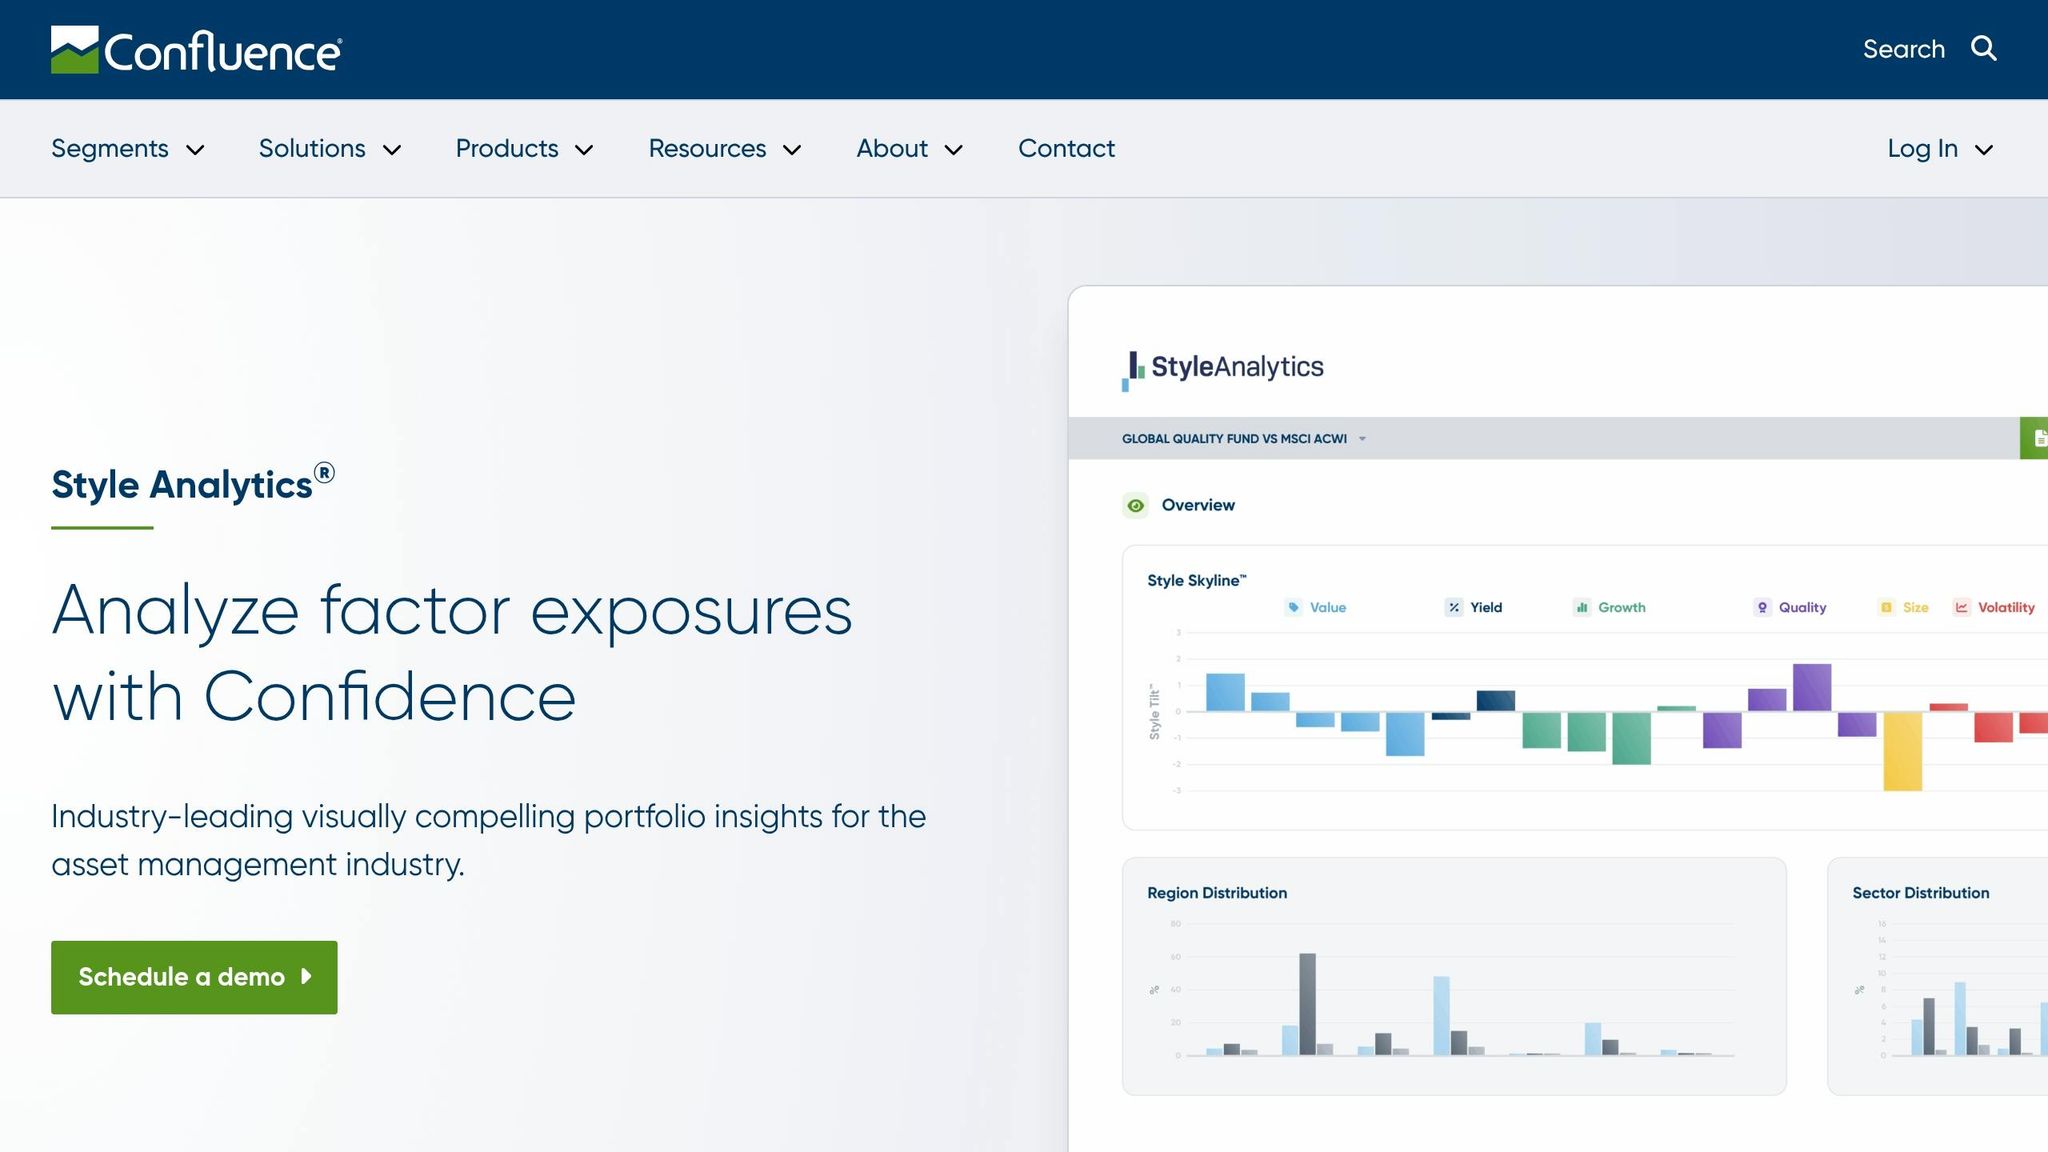
StyleAnalytics Factor Analytics, integrated into MSCI's platform through FaCS®, offers a structured way to analyze factor exposures across portfolios. Instead of dealing with inconsistent definitions from different providers, it categorizes factor analysis into 16 factor characteristics grouped into eight main factor groups. This gives portfolio managers a consistent framework for comparison. It also reflects a growing emphasis on achieving greater precision in risk-adjusted portfolio benchmarking.
The platform supports a massive dataset, covering 80,000+ equities, 7,000+ mutual funds, and 1,600+ global equity ETFs, which makes it especially useful for managers overseeing diversified portfolios. One of its standout features is its ability to measure style drift, screen funds for alignment with specific factor exposures, and provide a unified language for comparing exposures across a wide range of investments. By pinpointing style drift, the tool enhances the accuracy of benchmarking, helping users detect genuine shifts in exposure.
Methodologically, StyleAnalytics employs Sharpe's returns-based style analysis framework to monitor and identify changes in portfolio style over time. This approach is particularly effective for catching gradual shifts in a fund's factor profile - changes that might otherwise go unnoticed without systematic analysis.
The platform also integrates seamlessly with various tools and systems. It connects via the SPAR Engine API (v3) and offers SDK support for Python, Java, and .NET. Additionally, it provides native connectors for Power BI and QlikSense, enabling teams to incorporate factor data into custom dashboards. However, it's worth noting that the previously available Tableau connector has been discontinued. These integrations make it easier for portfolio managers to incorporate factor analysis into broader, AI-driven benchmarking workflows.
| Integration Type | Supported Tools | Function |
|---|---|---|
| API | SPAR Engine API v3 | Programmatic data retrieval and syncing |
| SDKs | Python, Java, .NET | Custom application development |
| BI Connectors | Power BI, QlikSense | Custom dashboards and data blending |
| Data Ecosystems | Snowflake, Databricks | Data workflows and storage |
9. Axioma Risk from Qontigo
Axioma Risk, now a part of SimCorp's Qontigo platform, tackles the shortcomings of traditional risk models by blending fundamental, statistical, and macroeconomic approaches. Updated daily, it provides portfolio managers with a broad and detailed view of risk sources, making it suitable for various market segments.
The platform's reach spans global equities, covering emerging markets, Europe, Asia, and individual countries. With historical data going back to 1982, it facilitates robust stress testing. Additionally, its models align with the Global Industry Classification Standard (GICS), ensuring consistent factor definitions across portfolios and benchmarks.
Using machine learning, Axioma identifies complex factor interactions that standard linear models might overlook. For instance, its Non-linear Residual Factor uncovers higher-order relationships, and the Dynamic Volatility Adjustment enhances risk forecasts during volatile periods. These features provide portfolio managers with sharper insights, enabling more accurate benchmarking and better decision-making.
"The difference between success and struggle often comes down to how well and quickly you understand and manage your risk. While conventional factor risk models may miss critical exposures affecting portfolio performance, the Axioma Worldwide Equity Factor Risk Model is designed to help portfolio managers construct better and more resilient portfolios." - Melissa Brown, Head of Investment Decision Research, SimCorp
Axioma offers flexible integration options, supporting deployment through Microsoft Azure, Snowflake, and on-premise systems. It delivers data in SQL format and provides API documentation, including Reuters Instrument Code (RIC) mapping, via the LSEG Developer Portal to streamline custom integrations. By incorporating parallel processing tools, end-of-day processing times can be cut by 5 to 30 times, significantly improving efficiency. Impressively, more than half of the world's top 100 financial firms rely on Axioma analytics through SimCorp's integrated platform.
10. QuantConnect Lean Platform
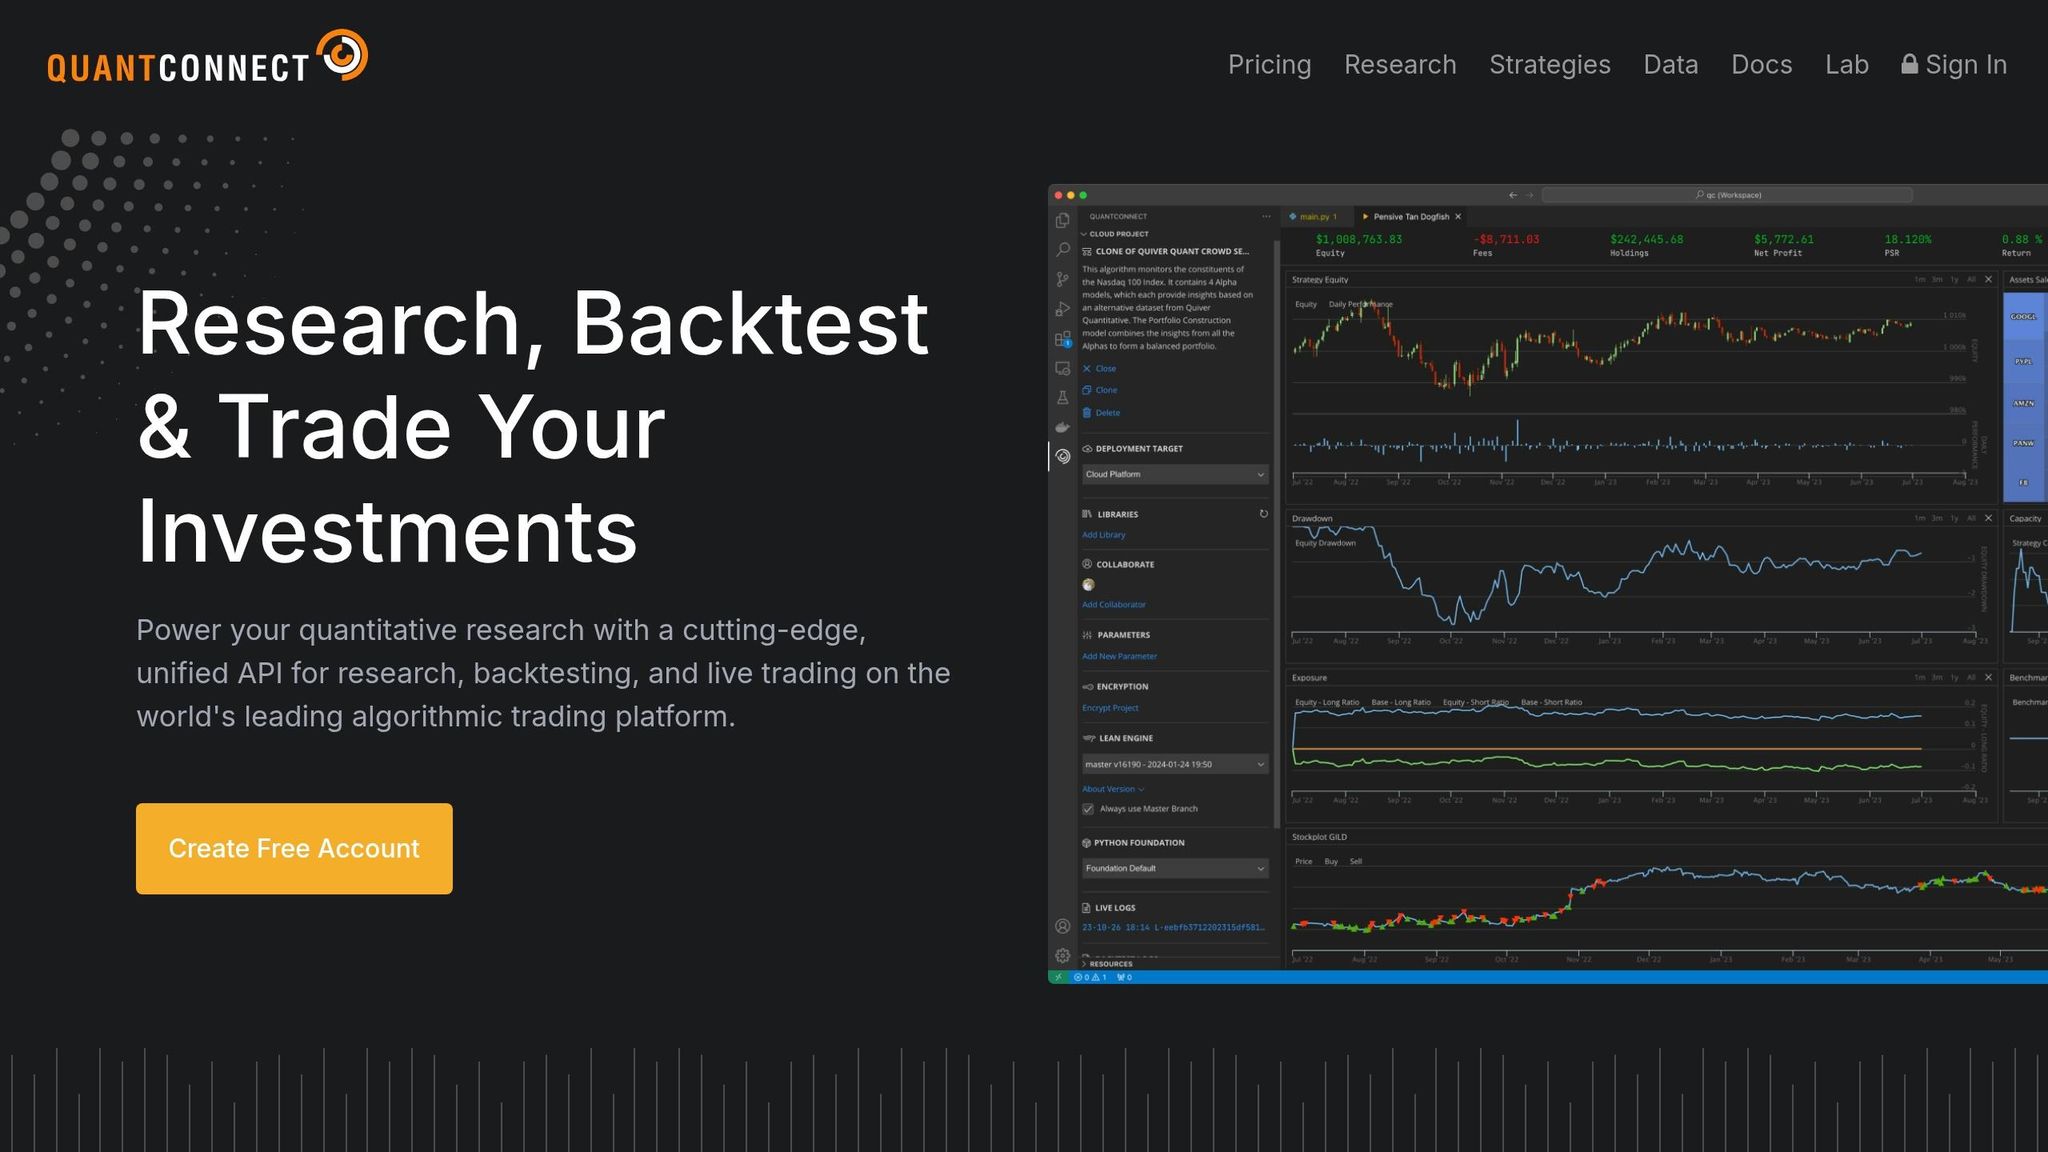
QuantConnect LEAN stands out as a developer-focused platform designed for algorithmic trading and portfolio analysis, with a strong emphasis on managing risk-adjusted performance. This open-source tool is tailored for developers and quantitative analysts, supporting nine asset classes - Equities, Forex, Options, Futures, Future Options, Indexes, Index Options, Crypto, and CFDs. With LEAN, portfolio managers can oversee performance, profit and loss (P&L), and holdings through a single, unified engine. Since its launch in 2015, it has powered over 300 hedge funds, processed around $45 billion in monthly trading volume, and deployed more than 375,000 live algorithms. These figures highlight its focus on precision and risk management, which are key in advanced benchmarking tools.
LEAN’s statistics engine automatically calculates a range of performance metrics such as Sharpe Ratio, Probabilistic Sharpe Ratio (PSR), Treynor Ratio, Sortino Ratio, Information Ratio, Alpha, Beta, and Tracking Error. Among these, the Probabilistic Sharpe Ratio is particularly useful as it accounts for skewness and kurtosis, helping to minimize the risk of overfitting strategies to historical data.
The platform operates through a modular framework consisting of five key components: Universe Selection, Alpha Creation, Portfolio Construction, Execution, and Risk Management. It includes pre-built portfolio models like Mean-Variance Optimization, Black-Litterman, and Risk Parity. LEAN supports Python for machine learning integration with libraries like PyTorch, TensorFlow, scikit-learn, and XGBoost, while C# is available for high-speed execution. Its optimization engine uses Grid and Euler Search to maximize objectives such as Sharpe Ratio or minimize drawdowns, while discarding strategies that breach specific risk thresholds (e.g., Drawdown <= 0.25).
The platform integrates with over 40 data providers, including Bloomberg Terminal Link, FactSet, Polygon, and Alpha Vantage, as well as 21+ brokerages like Interactive Brokers, Oanda, and Binance. Developers can work locally using tools like VS Code, Jupyter Lab, or the Lean CLI, which enables backtesting in Docker containers and syncs with the QuantConnect cloud. The lean report command simplifies the process of creating detailed tearsheets, complete with equity curves and risk metrics benchmarked to the S&P 500.
The core LEAN engine is available for free under the Apache 2.0 license. Cloud features are priced on a pay-as-you-go basis, with compute nodes starting at $0.15 per hour for a 2-core, 8 GB RAM instance. The platform’s open-source community is highly active, with contributions from over 180 engineers and more than 4,800 forks on GitHub.
Comparison Table
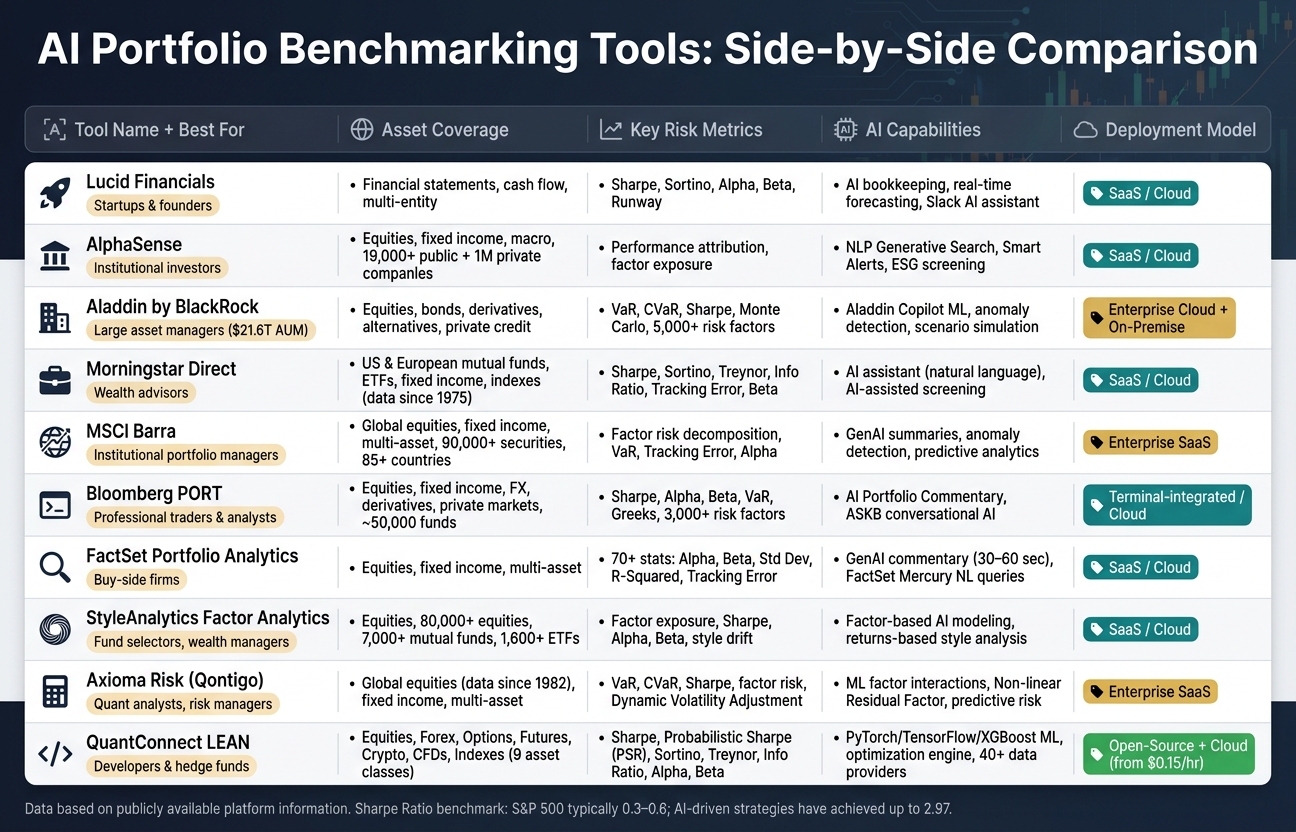
AI Portfolio Benchmarking Tools Compared: Features, Users & Capabilities
Below is a detailed comparison of ten AI portfolio benchmarking tools, showcasing their strengths and features.
| Tool | Best For | Asset Coverage | Risk-Adjusted Metrics | AI Capabilities | Deployment Model |
|---|---|---|---|---|---|
| Lucid Financials | Startups, founders, fast-growing companies | Financial statements, cash flow, multi-entity | Runway analysis, cash flow forecasting, investor-ready reporting | AI-powered bookkeeping, real-time forecasting, Slack-based AI assistant | SaaS, cloud-based |
| AlphaSense Portfolio Intelligence | Institutional investors, research analysts | Equities, fixed income, macro data | Performance attribution, factor exposure | NLP-driven search, AI document analysis | SaaS, cloud-based |
| Aladdin by BlackRock | Large asset managers, insurers, pension funds | Multi-asset (equities, bonds, derivatives, alternatives) | VaR, CVaR, Sharpe Ratio, stress testing | Advanced risk modeling and scenario simulation | Enterprise, cloud + on-premise |
| Morningstar Direct | Asset managers, wealth advisors | Equities, funds, ETFs, fixed income | Sharpe Ratio, Alpha, Beta, Tracking Error | AI-assisted screening, performance attribution | SaaS, cloud-based |
| MSCI Barra Portfolio Manager | Institutional portfolio managers | Global equities, fixed income, multi-asset | Factor risk decomposition, VaR, Tracking Error | Factor model AI, predictive analytics | Enterprise SaaS |
| Bloomberg PORT | Professional traders, institutional analysts | Equities, fixed income, FX, derivatives | Sharpe Ratio, Alpha, Beta, VaR, Attribution | AI-enhanced analytics via Bloomberg Terminal | Terminal-integrated, cloud |
| FactSet Portfolio Analytics | Buy-side firms, portfolio managers | Equities, fixed income, multi-asset | Performance attribution, Sharpe Ratio, Tracking Error | AI data aggregation, natural language queries | SaaS, cloud-based |
| StyleAnalytics Factor Analytics | Fund selectors, wealth managers | Equities, multi-factor portfolios | Factor exposure, Sharpe Ratio, Alpha, Beta | Factor-based AI modeling | SaaS, cloud-based |
| Axioma Risk (Qontigo) | Quantitative analysts, risk managers | Equities, fixed income, multi-asset | VaR, CVaR, Sharpe Ratio, factor risk | Predictive risk modeling, scenario analysis | Enterprise SaaS |
| QuantConnect LEAN | Developers, quant analysts, hedge funds | Equities, Forex, Options, Futures, Crypto, CFDs, Indexes | Sharpe Ratio, Sortino, Treynor, Information Ratio, Alpha, Beta, Tracking Error | ML integration (PyTorch, TensorFlow, XGBoost), optimization engine | Open-source with cloud options |
Each tool caters to specific needs, from startups seeking financial clarity to large institutions requiring robust risk modeling. SaaS platforms stand out for their ease of deployment and institutional-grade capabilities, while open-source options like QuantConnect LEAN offer unparalleled flexibility for developers. Lucid Financials is particularly noteworthy for startups, delivering real-time insights and investor-ready reporting at competitive pricing.
Conclusion
AI has reshaped how portfolio benchmarking is done. Traditional methods, which depend on periodic manual updates and straightforward index tracking, now stand in stark contrast to AI-powered tools. These modern tools provide real-time analysis, integrate machine learning, and incorporate risk-adjusted metrics. For context, while the S&P 500 usually achieves a Sharpe Ratio between 0.3 and 0.6, AI-driven quantitative strategies have reached a Sharpe Ratio of 2.97. That’s a massive leap, highlighting the clear edge AI brings to benchmarking.
Choosing the right tool depends on your specific needs. For institutional managers handling complex, multi-asset portfolios, enterprise-focused platforms may be ideal. Quantitative analysts and developers, on the other hand, might prefer open frameworks like QuantConnect LEAN, offering complete control over their models. Startups, especially those needing real-time cash flow insights and polished investor reports, could benefit from solutions like Lucid Financials, which cater to their unique requirements.
When weighing your options, look for platforms that excel in scenario modeling (covering best-case, worst-case, and actual scenarios), rely on integrated machine learning rather than a single algorithm, and use point-in-time data to avoid look-ahead bias during backtesting. These features separate tools that perform well in real-world conditions from those that only shine in controlled demos. The goal is to find tools that not only monitor risk but also provide actionable insights.
Ultimately, the best choice will align with your user profile, asset coverage, and decision-making style - whether you prefer real-time updates via Slack or a more detailed, all-in-one dashboard.
FAQs
Which risk-adjusted metrics matter most for my portfolio?
When managing your portfolio, some crucial metrics to keep an eye on include market volatility, liquidity risk, credit risk, and economic risk. These factors can significantly impact your investments, and staying on top of them is essential for informed decision-making.
AI tools can play a big role here. They’re capable of analyzing these risks in real time, giving you the insights needed to fine-tune your approach. This means you can better manage potential downsides while working toward improved returns.
How do these tools prevent look-ahead bias in backtests?
These tools are designed to avoid look-ahead bias by strictly using data that was available at the time decisions were made. They work with point-in-time data, complete with precise timestamps, and ensure that trades are executed on the next available bar. This method prevents any influence from future information, preserving the accuracy and reliability of backtesting outcomes.
What should I check before trusting AI scenario modeling?
Before relying on AI scenario modeling, it's crucial to check its accuracy. Start by comparing the model's predictions to actual financial outcomes over a period of time. Also, consistently review the inputs, making sure they align with historical data and reflect current realities. Ensuring the forecasts can adjust to new information is key. Keeping an eye on these factors helps maintain both reliability and relevance.