If you wait for month-end to spot a cash problem, you’re often too late.
I’d sum up the research like this: AI-based KPI trend review helps finance teams catch changes in essential financial metrics like burn, runway, MRR/ARR, cash flow, CAC, LTV, and gross margin earlier than spreadsheet-only review. Across the studies cited, forecast accuracy improved by 15% to 18.5%, forecast error fell by 12% to 20%, and some anomaly systems reached 91.7% accuracy with alerts in 0.02 to 45 milliseconds.
Here’s the short version of what matters most:
- I see the biggest gains in forecasting revenue, cash flow, and runway
- AI is also strong at flagging spend spikes, payment delays, and margin pressure
- The main edge is timing: teams can act in hours or days instead of waiting for a monthly review
- This only works well when data is clean and people check the output before decisions are made
- For startups from pre-seed to Series B, this can help with hiring plans, cost control, board reporting, and investor prep
Quick Comparison
| Area | AI-driven review | Manual review |
|---|---|---|
| Forecasting | Lower error rates; better with shifting KPI patterns | More likely to miss pattern changes |
| Alerts | Near real-time monitoring | Usually monthly or quarterly |
| Anomalies | Flags weak signals early | Often caught later |
| Workflow | Pulls from billing, banking, payroll, and accounting data | Heavy spreadsheet work |
| Decision use | Helps teams react before issues grow | Often explains problems after they happen |
So if I had to put the article into one plain takeaway, it’s this: AI is most useful when it tracks KPI direction, not just current numbers, and when finance teams review the alerts before acting on them.
INBOX INSIGHTS: Using AI for KPIs, Which AI Models to Use Part 2 (2025-07-23)
sbb-itb-17e8ec9
How Studies Compare AI and Manual KPI Analysis
Studies usually compare a manual baseline against an AI model using the same historical KPI data and the same scoring methods. That matters. If both sides work from the same input, you can see not just which model scores better, but whether it saves time and effort in day-to-day work.
Manual baselines often include spreadsheet modeling, rule-based anomaly checks, and standard methods like linear regression or ARIMA. AI models often include XGBoost, random forests, LSTMs, and Isolation Forest. Put simply, the setup is built to test both model quality and day-to-day business impact.
A systematic review of 78 studies from 2015 to 2025 found that ML and deep learning improved forecast accuracy and decision speed in SME financial forecasting.
Which Startup KPIs Appear Most in the Research
The KPIs that show up most often are MRR, ARR, churn, burn rate, runway, CAC, and LTV because they recur over time and tie straight to cash results. MRR and ARR track growth. Burn rate and runway track survival. CAC and LTV track efficiency.
For SaaS startups, MRR and ARR are the main revenue time series used to forecast growth and contraction. Churn, including both logo churn and revenue churn, matters because it directly affects LTV and future cash flow. CAC and LTV pull data from several sources, such as marketing spend, sales compensation, billing, and margin. That makes them easy to get wrong when handled by hand and a strong fit for AI-driven reconciliation. For the same reason, they also work well as a test case for forecasting and anomaly detection.
Models, Data Sources, and Evaluation Methods Used
Studies usually draw from four main data groups:
- accounting records
- billing and subscription data
- payroll and HR data
- operational logs
These sources are combined into a time-aligned monthly or weekly dataset in USD before the model runs.
For evaluation, forecast accuracy is usually measured with RMSE, MAE, and MAPE. Anomaly detection is scored with precision, recall, and F1. Speed is measured through processing time or end-to-end cycle time.
One study reported MAPE dropping from 13.4% with baseline forecasts to 5.7% after AI implementation, along with a 47% drop in RMSE. On the anomaly side, a hybrid deep-learning model achieved precision of about 95.6% and recall of about 93.9% on financial transaction streams. With that setup in place, the next step is to look at where those gains show up most clearly.
What the Research Shows About Accuracy and Speed
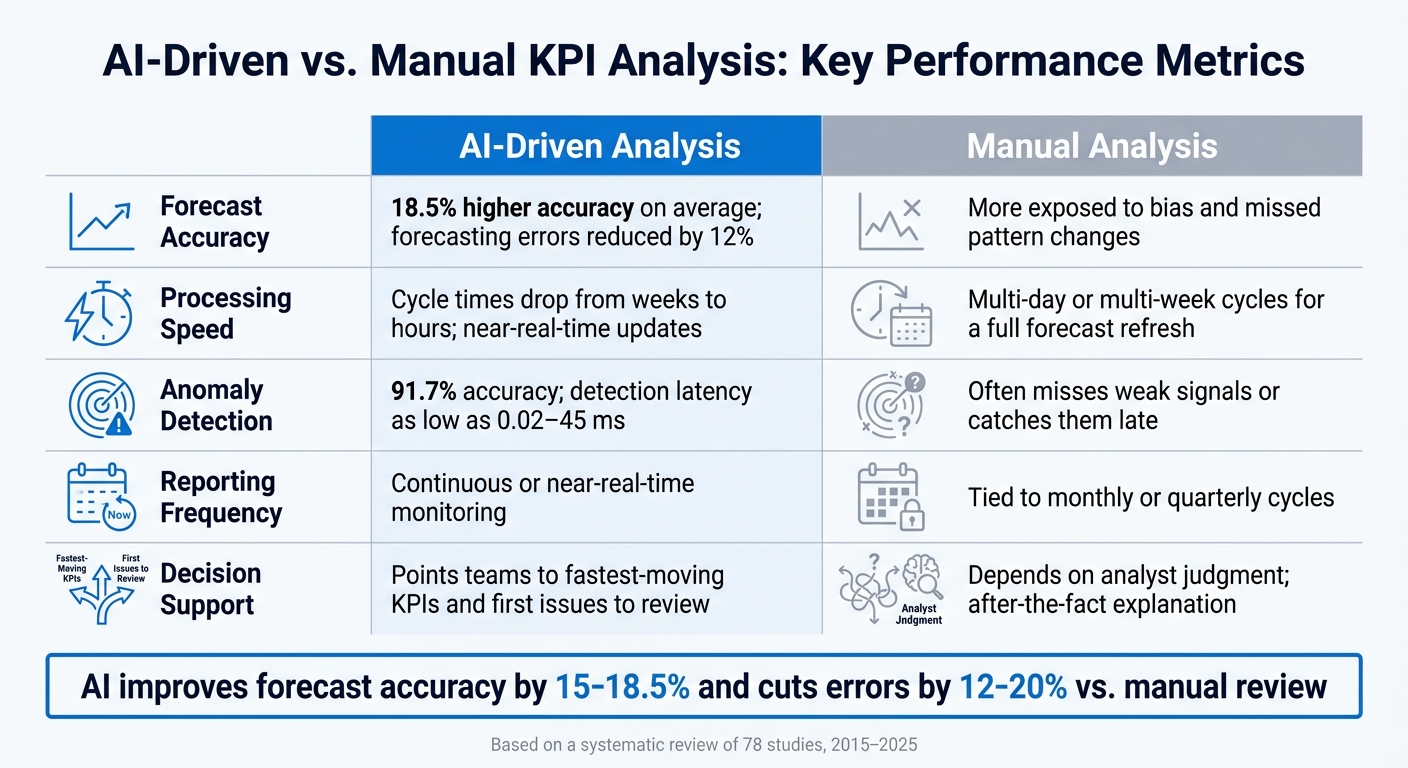
AI-Driven vs. Manual KPI Analysis: Key Performance Metrics
Stronger Forecasts for Revenue, Cash Flow, and Runway
Across studies, AI improves forecast accuracy by 15% to 18.5% and cuts forecasting errors by 12% to 20%. Another comparison found AI methods reaching 76.9% average accuracy versus 52.6% for traditional methods - a relative improvement of 46.2%.
That gap shows up most when KPI patterns shift fast or when several inputs move at once. AI models tend to do better in volatile settings, where small warning signs are easy to miss. For founders, that can mean changing hiring plans or spend sooner, before cash gets tight. It can also mean cutting spend categories flagged as outliers before the month-end close.
Earlier Detection of Anomalies and Emerging Risks
Accuracy matters, but speed shapes whether a team can do anything with the insight in time. A deep-learning model used for corporate financial reporting reached 91.7% accuracy with classification time of just 0.02 milliseconds. A separate anomaly detection system reported 45 milliseconds average detection latency and 1,000 transactions per second throughput for its fastest model. In plain English, spend spikes, margin pressure, and collections slowdowns can show up before the monthly review.
For U.S. startups, an AI system watching accounts receivable can flag unusual aging patterns or payment delays days to weeks before a manual report would catch them. That gives finance teams more time to fix accruals, tighten controls, or revise guidance.
AI-Driven vs. Manual KPI Analysis: A Direct Comparison
The comparison below shows what this looks like in day-to-day finance work.
| Dimension | AI-Driven Analysis | Manual Analysis |
|---|---|---|
| Forecast accuracy | 18.5% higher on average; forecasting errors reduced by 12%. | More exposed to bias and missed patterns. |
| Processing speed | Cycle times can drop from weeks to hours, with near-real-time updates as new data arrives. | Multi-day or multi-week cycles for a full forecast refresh. |
| Anomaly detection | 91.7% accuracy; detection latency as low as 0.02–45 ms. | Often misses weak signals or catches them late. |
| Reporting frequency | Continuous or near-real-time monitoring. | Usually tied to monthly or quarterly cycles. |
| Decision support | Points teams to the fastest-moving KPIs and the first issues to review. | Depends on analyst judgment and after-the-fact explanation. |
The practical payoff isn't just better forecasts. It's moving on the numbers while there's still time to do something about them.
What This Means for Startup Finance Teams
The research points to a simple shift in how finance teams work: use KPI trends to act before the books close, not after.
Continuous Monitoring for Burn, Spend, and Investor Readiness
A lot of U.S. startups still run finance on a monthly reporting cycle. The problem is pretty clear. If you spot a burn-rate issue at month-end, that issue often comes from decisions made weeks earlier, back when there was still room to fix it.
AI-driven monitoring changes that rhythm. Instead of waiting for month-end, it turns live financial data into alerts on burn, spend, runway, and revenue movement. If payroll jumps or collections start to slow, the system can flag the change fast.
That gives founders time to act while the problem is still small. They might:
- delay a hire
- cut discretionary spend
- update guidance before the variance grows
There’s another upside here too. For investor-ready reporting, board deck numbers can tie back to current source data instead of a rushed manual reconciliation at the last minute.
Of course, speed means very little if the data underneath is messy.
Data Quality, Explainability, and the Role of Human Review
Bad inputs lead to bad alerts. Duplicate transactions, delayed bank feeds, inconsistent account mapping, and missing revenue recognition can all skew KPI trends.
There’s also model risk. Bias and overfitting are real problems, especially when a system is trained on a narrow set of past data.
That’s why finance teams shouldn’t let a model make big calls on its own. Any material forecast change, like a drop in runway, a spike in spend variance, or a move in gross margin, should go through human review before it affects hiring, pricing, or fundraising decisions.
And finance leaders need more than a red flag. They need to know why a metric changed. Was payroll higher? Were collections slower? Did gross margin slip?
Reports also need a clean paper trail. Inputs should be logged, assumptions should be documented, and outputs should be traceable so they can be audited at any point in time. That’s the model Lucid Financials uses in day-to-day work.
How Lucid Financials Applies These Research-Backed Practices
Lucid Financials is built around live monitoring, human review, and traceable outputs.
It brings bookkeeping, tax, tax credits, and CFO support into one platform. Live data feeds forecasts and alerts, so teams aren’t stuck working off stale numbers. The Slack integration lets founders ask about runway or budget variance and get a current answer.
Every AI-generated output is reviewed by Lucid’s finance team. That helps keep board and investor reporting fast, clear, and defensible.
Conclusion: The Case for AI-Driven KPI Insights
The case is pretty straightforward: AI-driven KPI trend analysis beats manual review where startup finance teams feel it most - forecast accuracy, detection speed, and earlier signals on cash and growth risk.
The pattern shows up in three areas again and again: better forecasts, faster alerts, and more dependable review. Studies keep pointing to lower forecast error for revenue, cash flow, and runway. Speed matters too. AI can spot shifts in burn and spending earlier than a manual review cycle.
The best outcomes happen when teams pair AI with clean data and human checks. That combination keeps insights accurate and useful in day-to-day finance work. AI spots the pattern; finance teams confirm the cause and decide what to do next.
In practice, that looks like continuous monitoring with human oversight. Lucid Financials uses this model with live data, expert review, and Slack-based reporting.
FAQs
Which KPIs should we track first with AI?
Start with the metrics that tell you whether the business can keep going: burn rate, cash runway, and cash flow. These show, in plain terms, how much you're spending, how long your money will last, and whether cash is moving in or out. If you're trying to manage the business with your eyes open, this is where to start.
Then look at CAC and LTV to make sure growth makes financial sense. It's one thing to add customers. It's another to add them at a cost the business can support.
For AI-heavy companies, gross margins and Annual Recurring Margin (ARM) matter too. Those numbers give a clearer picture of infrastructure costs, which can eat into revenue faster than many teams expect.
How much historical data does AI need to forecast well?
Less than the amount, what matters most is data quality: clean, consistent, well-structured historical records like P&L statements and cash flow data.
AI forecasts get better when you pair that history with live data. That way, models can adjust over time as new information comes in.
How can finance teams trust AI alerts before acting on them?
Finance teams can trust AI alerts when they combine automated monitoring with human review. AI spots anomalies fast and with precision, while finance experts check the logic, confirm the assumptions, and add business context that software alone can miss.
Lucid Financials uses this approach by having its finance team review every AI-generated report. Teams can build more trust in these alerts by setting clear review criteria, adding extra checks for high-stakes decisions, and documenting any changes made along the way.