Most startup forecasts fail for the same reason: the data is messy, the process is loose, or revenue and cash plans don’t match. I’d boil this guide down to four moves: clean your CRM and finance data, use a model that fits your stage, review AI output against rep commits each week, and plan with ranges instead of one fixed number.
Here’s the short version:
- Start with data quality. Make amount in $USD, close date, stage, and owner required.
- Use simple models first. Time-series and regression often fit seed and Series A teams better than complex ML.
- Forecast across 3, 6, and 12 months. Use each window for a different job: execution, hiring/spend, and planning.
- Compare AI with rep judgment. Let AI set the baseline, then review overrides and track why they happen.
- Watch the common failure points. Stale deals, weak stage probabilities, and missing renewals can skew the whole view.
- Tie revenue to cash. A forecast is more useful when it also shows the effect on burn and runway.
A few numbers stand out: many teams report forecast accuracy in the 70%–79% range, only 7% get to 90%+, and AI-based forecasting can improve accuracy by 10%–20%. That doesn’t make forecasting perfect. But it can make planning less guesswork and more data-led.
If I were putting this into practice, I’d keep the setup simple, review it weekly, and treat the 12-month view as a range, not a promise.
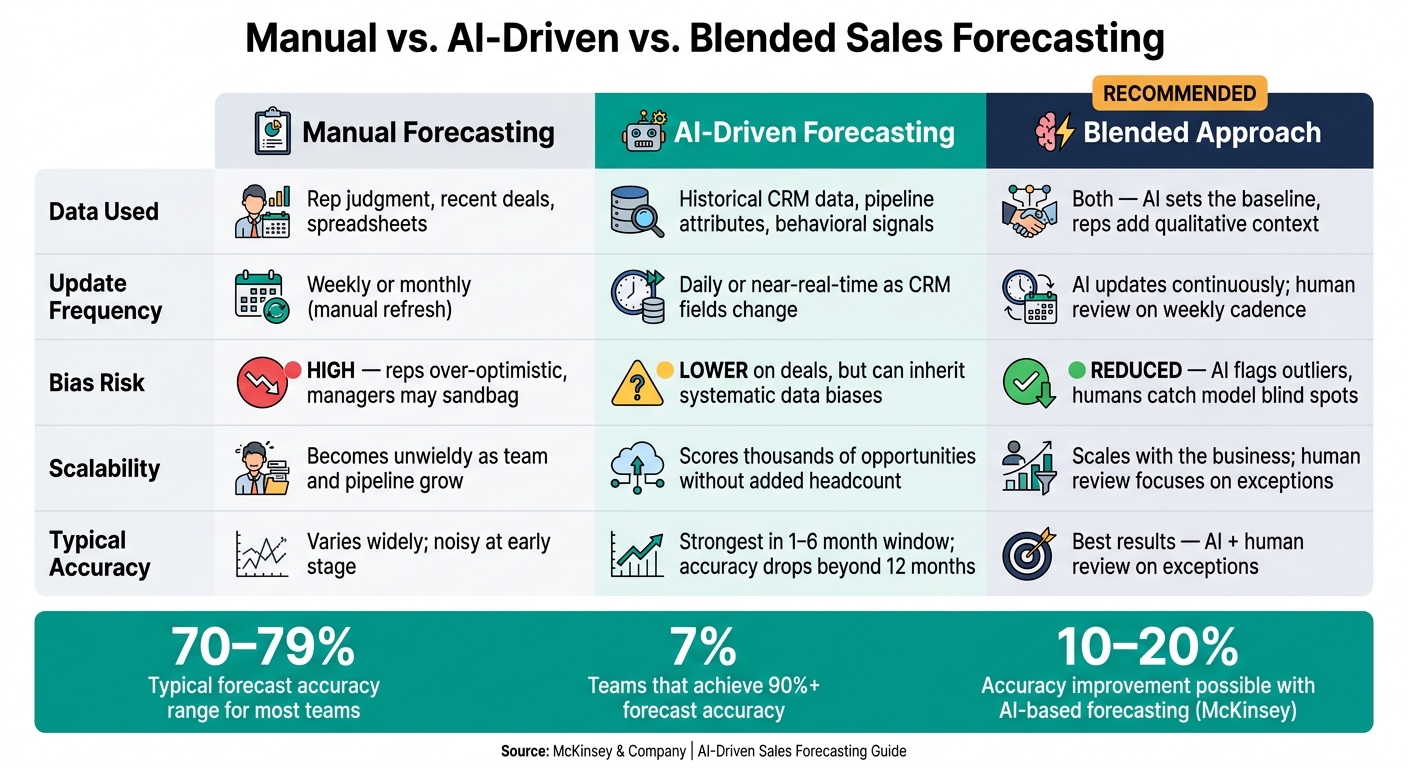
Manual vs AI-Driven vs Blended Sales Forecasting: Key Differences
Next-Gen Sales Forecasting: AI-Powered Pipeline Management | The Data Apps Conference
sbb-itb-17e8ec9
1. Build the Data Foundation First
AI forecasting runs on data. Not just more data - clean, current, connected data that follows the full revenue path from first touch to cash collection.
That matters because forecast accuracy shapes big calls: hiring plans, spend, runway, and board reporting. If the data underneath is messy, even a fancy model can learn from the wrong signals and spit out numbers no one believes.
The Core Data Inputs AI Models Use
The table below shows the structured inputs AI forecasting models need. But there’s a catch: these inputs only help when they’re complete, standardized, and updated on time.
| Data Input | What It Captures | Why It Improves Forecast Quality |
|---|---|---|
| Opportunity amount (USD) | Deal value per record | Helps the model learn segment-specific deal sizes |
| Expected close date (MM/DD/YYYY) | Projected close timeline | Lets AI correct optimistic close dates using historical slippage patterns |
| Stage changes and duration | Where deals stall or move in the pipeline | Reveals stage-by-stage conversion rates and flags stuck deal progression |
| Rep activity (emails, calls, meetings) | Engagement intensity and recency | Helps models discount low-activity deals and upweight consistent pipeline movement |
| Lead source and attribution | Channel, campaign, and cost | Shows win rates and deal sizes by acquisition channel |
| Product engagement | Logins, feature usage, support tickets | Predicts renewal likelihood and flags at-risk accounts before they churn |
| Renewals, expansion, and churn | Renewal dates, expansion opportunities, downgrades, cancellations | Feeds more reliable ARR and MRR projections for the next 12–24 months |
| Invoices and collections | Issue date, due date, payment date, partial payments, write-offs | Connects revenue forecasts to cash timing and runway |
CRM-only forecasting misses live deal risk and leans too optimistic. When you add product usage, billing, and collections data, AI gets a much better read on what’s happening with customers right now.
Data Cleanup, Governance, and Reporting Discipline
Most AI forecast failures start with bad input data, not bad models.
A few common problems do a lot of damage:
- Duplicate opportunities inflate pipeline totals
- Missing or placeholder close dates break time-based projections
- Stale stage probabilities muddy deal confidence
- Disconnected finance data keeps the model from learning how pipeline turns into cash
The fix is pretty plain: required fields, weekly data checks, standard stage definitions, and daily or weekly syncs across CRM, billing, and the general ledger.
Make amount in USD, expected close date in MM/DD/YYYY format, stage, and owner required on every opportunity. Define stages based on buyer actions, not a rep’s gut feel. Then calibrate stage probabilities using trailing 12-month conversion data.
Ownership matters too. Sales Ops or RevOps should own CRM data quality. Finance should own billing and cash data integrity. Most AI forecasting platforms also need at least 24 months of historical win/loss data to model conversion patterns and seasonality with confidence.
Clean finance data matters just as much as clean CRM data.
Where Lucid Financials Supports Forecast-Ready Financial Data

Lucid Financials helps keep books, revenue recognition, and cash data clean and connected, so the inputs behind sales forecasts stay current and usable for planning. When books and billing are in good shape, AI can turn pipeline movement into more dependable revenue and cash forecasts.
With the data foundation in place, the next step is picking models and tools that fit your sales motion.
2. Choose the Right AI Models and Forecasting Tools
Once your data is clean and connected, the next call is picking the right model for where your company is right now. This is where a lot of founders go off track. They jump to advanced AI too early, before their data can carry that weight.
More complex doesn't always mean more accurate. A lot of the time, it just means harder to explain, harder to trust, and harder to use in day-to-day decisions.
Model Types: Time-Series, Regression, Tree-Based, and Neural Networks
Different models are built for different jobs. Time-series models are good for forecasting revenue trends and seasonality. Regression models connect revenue to drivers like lead volume and win rate. Tree-based models help score deals and spot risk from pipeline signals. Neural networks are a fit for large, complex pipelines when the data is clean and steady, without getting knocked around by noise.
| Model Type | Best Use Case | Data Requirements | Interpretability | Startup-Stage Fit |
|---|---|---|---|---|
| Time-series | Revenue trend and seasonality | ≥12–24 months of bookings | High | Seed, Series A |
| Regression | Driver-based forecasts | Clean volume and conversion metrics | High–Medium | Seed, Series A |
| Tree-based | Opportunity scoring and risk | Hundreds to thousands of labeled deals | Medium | Series A–B |
| Neural networks | High-volume pipeline prediction | High-volume, high-quality data | Low | Series B+ |
The practical move is simple: start simple. Add complexity only when your data quality and volume can support it.
Once you've picked the model, put it to work at the deal level. Rank open opportunities. Flag risk early. Give the team something they can act on.
AI Features for Opportunity Scoring and Pipeline Risk
Opportunity scoring pulls together deal-level signals such as deal amount, days in stage, stakeholder breadth, and activity recency into a close-likelihood estimate for each open opportunity. That makes it easier to spot risk as it happens, not two weeks later in a forecast call.
One thing matters here: keep the output tight. Surface one next step per deal. Long lists of suggestions usually get skipped.
In weekly pipeline reviews, managers can spend more time on medium-score deals that still have a shot. At the same time, AI risk flags can become a standing part of the agenda:
- Stalled deals
- Missing executive sponsors
- Single-threaded enterprise opportunities
Each flag should come with a clear follow-up playbook. Otherwise, it's just noise.
How Forecasting Tools Should Connect to Finance Planning
A revenue forecast only matters if it feeds into budget, hiring, and runway planning. If your revenue target says you need three more AEs by Q4, that should already be reflected in your hiring plan, burn model, and board deck.
This shows up most sharply in board prep and fundraising. Investors want to see that revenue forecast, burn rate, and runway all come from the same model. They don't want a last-minute patch job the night before the meeting.
Lucid Financials keeps accounting data current so sales forecasts, cash flow, and board reporting all run on the same numbers.
With the right model and connected systems in place, the next move is setting up a forecasting process the team will actually use.
3. Build an AI-Driven Forecasting Process Your Team Will Actually Use
You can have clean data and solid tools, but if the team doesn't follow the process, the model won't matter much. Once the model is live, process is what decides whether people use it.
Set Forecast Horizons, Metrics, and Segments
Start by deciding how far out each forecast needs to guide decisions.
Use three forecast horizons:
- 3 months for execution
- 6 months for hiring and spend decisions
- 12 months for strategy
Your 3-month forecast should work as a weekly execution check. Are reps on pace? Is pipeline coverage sitting at 3–4x target?
Your 6-month forecast should guide hiring and spend decisions. If rep ramp time is 3–6 months, those calls have to happen now if you want them to show up in revenue later.
Your 12-month forecast should anchor ARR targets and go-to-market bets. Treat this one as a range, not a promise.
Track bookings, ARR/MRR, ACV, renewals, expansion, churn, pipeline coverage, and quota attainment by team and segment. Split MRR into new, expansion, and churn so you can see what's driving growth.
For segmentation, start with customer size and sales motion. Add region or product only if you have enough volume to support it. The key is simple: your segments should line up with how deals actually move through the pipeline. If they don't, the model won't get enough signal.
Reconcile AI Outputs with Rep Commits
Once the model sets the baseline, managers should focus on exceptions and overrides.
Review AI projections against rep commits every week. Look at this month's and next month's forecasts side by side with rep commits, best case, and pipeline categories.
If a rep's commit comes in higher than the AI estimate, dig into the gap. Which deals explain the difference? What's the latest customer or market signal? How does that stack up against similar deals from the past?
Log every override. That record matters. When you track how often overrides happen, and why, you create a feedback loop that helps improve model calibration and manager discipline over time.
At month-end, run a short calibration session. Where did the AI overshoot or undershoot? Which reps keep over-committing? Which segments keep showing bias? Use those answers to adjust model inputs and tighten rep guidance.
The weekly pipeline review should be the center of this whole process. Build the meeting agenda around it.
Use a Comparison Table to Operationalize the Process
Use the table below to make ownership clear between automation and human review.
| Dimension | Manual Forecasting | AI-Driven Forecasting | Blended Approach |
|---|---|---|---|
| Data used | Rep judgment, recent deals, spreadsheets | Historical CRM data, pipeline attributes, behavioral signals | Both, with AI as the baseline and reps providing qualitative context |
| Update frequency | Weekly or monthly, when someone refreshes a spreadsheet | Daily or near-real-time as CRM fields change | AI updates as CRM fields change; human review happens on a weekly cadence |
| Bias risk | High - reps can be over-optimistic, and managers may sandbag | Lower on individual deals, but it can inherit systematic data biases | Reduced - AI flags outliers, and humans catch model blind spots |
| Scalability | Becomes unwieldy as the team and pipeline grow | Scores thousands of opportunities without added headcount | Scales with the business; human review focuses on exceptions |
| Typical accuracy | Varies widely; early-stage forecasts can be noisy | Strongest in the 1- to 6-month window, with accuracy falling as the horizon extends beyond 12 months | Best results come from combining AI with human review on exceptions |
Automate scoring, rollups, and risk flags. Keep final commit, scenario selection, and overrides human-owned.
4. Avoid the Mistakes That Break Forecast Accuracy
Forecast accuracy usually falls apart in a few familiar ways. In most cases, the root problem comes back to the same issues: bad data, models that sound more certain than they should, and a gap between what sales says is coming and what finance is using to plan.
Best Practices for Early-Stage and Growth-Stage Startups
The fix changes with company stage because forecast risk changes as the sales motion gets more mature.
Early-stage startups should keep forecasts tight, use probability-weighted pipeline, and hold off on more advanced models until they have 12–24 months of clean history.
Growth-stage startups have more history, but they run into a different set of problems: model drift, too many inputs, and siloed data across sales and finance. A better approach is to segment by region, product, and customer type, then run quarterly backtests against actuals by month and segment.
Common Pitfalls and How to Fix Them
Poor data hygiene is behind most forecast misses.
The biggest mistakes here aren't fancy. They're day-to-day process issues. Stale pipeline data is the most common one. When opportunities stay open long after their expected close date, they bloat future quarters and send bad signals into the model. The fix is simple: flag any deal that hasn't been updated in 30+ days, and require reps to move it, update it, or close it.
The table below shows the five pitfalls that most often damage trust in the forecast, the risk each one creates, and what to do about it.
| Pitfall | Business Risk | Corrective Action |
|---|---|---|
| Stale pipeline data | Inflated future quarters; model trains on ghost deals | Auto-flag deals past close date by 30+ days; enforce weekly stage updates |
| Unrealistic close probabilities | Misleading weighted pipeline numbers | Calibrate stage probabilities using 6–12 months of actual win rates; refresh quarterly |
| Missing renewals and expansions | Growth projections miss existing revenue at risk | Create dedicated renewal opportunities with owners, dates, and risk scores |
| Weak executive adoption | Teams ignore the forecast; no accountability | Include AI forecast outputs in board decks and planning sessions; tie decisions to the numbers |
| Single-number forecasts | Overconfident hiring, spend, and cash commitments | Replace with conservative, base, and upside ranges; only commit to new headcount if the base case holds for two consecutive quarters |
The main causes are incomplete CRM records, optimism bias, and manual rollups. Fixing this usually doesn't mean buying another tool. It means setting clear standards and sticking to a weekly hygiene routine.
Why Investors Care About Forecast Discipline
Forecast accuracy matters for day-to-day operations, but it also affects board trust and capital decisions. Investors often treat forecast discipline as a sign of how well a company is run. During due diligence, they routinely ask for historical forecasts versus actuals, and numbers that are consistently optimistic without a written reason tend to set off alarms. Bad forecasts can slow hiring, distort burn, and weaken runway planning.
Keeping your AI-driven sales forecast tied closely to financial reporting helps close that gap. When forecast changes flow straight into cash and runway models, founders can show investors exactly how revenue assumptions affect burn. Not as a one-off spreadsheet exercise, but as an always-current view they can actually use. Lucid Financials supports this by syncing accounting and CRM data and delivering always-on investor-ready reporting through Slack.
Conclusion: Turn AI Forecasts Into Better Revenue and Cash Decisions
AI-driven sales forecasting only works when clean data, the right model, steady review, and cash planning all work together. Get those pieces in place, and your forecast stops being a guess and starts becoming a tool for decision-making. McKinsey-cited research shows AI-based forecasting improves accuracy by 10–20%. That kind of consistency matters because it shapes better calls on hiring, spending, and fundraising.
Here’s how to put that into practice:
- Audit your data first. Standardize opportunity stages, fill in close dates and amounts in USD, and deduplicate accounts before anything else. If the inputs are messy, the output will be too, no matter how advanced the system is.
- Match the model to your stage. Early-stage startups should begin with simple time-series and regression models built around a small set of core metrics. Later-stage companies can add tree-based or neural network models once they have enough clean historical data and more complex pipelines.
- Start with one use case. Forecasting next-quarter new ARR or likelihood-to-close for current opportunities is enough to start. A narrow rollout helps the team build trust and exposes data gaps faster than trying to predict everything at once.
- Connect forecasts to cash. Every revenue projection should feed into a cash collection model, including Net 30/60 payment terms, past collection patterns, and churn. That gives you a live view of the effect on burn rate and runway.
That link to cash is where planning turns into day-to-day execution. Lucid Financials ties together bookkeeping, CFO support, and investor-ready reporting so forecast changes flow straight into cash, burn, and runway views.
Better forecasts don’t just give you more accurate numbers. They help you decide when to hire, how much to spend, and when to raise capital. The point isn’t a prettier forecast. It’s making faster, better decisions based on numbers the team trusts.
FAQs
How much historical data do I need to start AI forecasting?
There’s no fixed amount of historical data you have to have. What matters most is data quality and consistency, not just how much data you pile up.
Use clean, reliable records - like monthly recurring revenue, past bookings, and pipeline metrics - to build a solid baseline. When your data is standardized and complete across time periods, AI can spot patterns more easily and improve forecast accuracy.
When should a startup move beyond simple forecasting models?
A startup should move past basic spreadsheet forecasting once it has about 18 months of transaction history or when growth makes manual data work too hard to keep up.
That’s usually the tipping point. Spreadsheets start to crack because they depend on static inputs and manual updates, and they can only juggle so many variables before things get messy.
An AI-driven platform like Lucid Financials helps solve that by giving teams real-time updates, dynamic scenario modeling, and stronger accuracy as the business grows.
How do I connect sales forecasts to cash and runway?
Connect your CRM, accounting software, and banking data in one AI-powered platform. That gives AI a fuller view of your business, so it can line up pipeline signals like deal stages, win probabilities, and renewals with burn rate and fixed expenses.
From there, you can model different scenarios by changing churn or conversion rates and seeing what happens to cash balance and runway. And instead of one fixed number, you’ll often get a range, which is a lot closer to how planning works in practice.