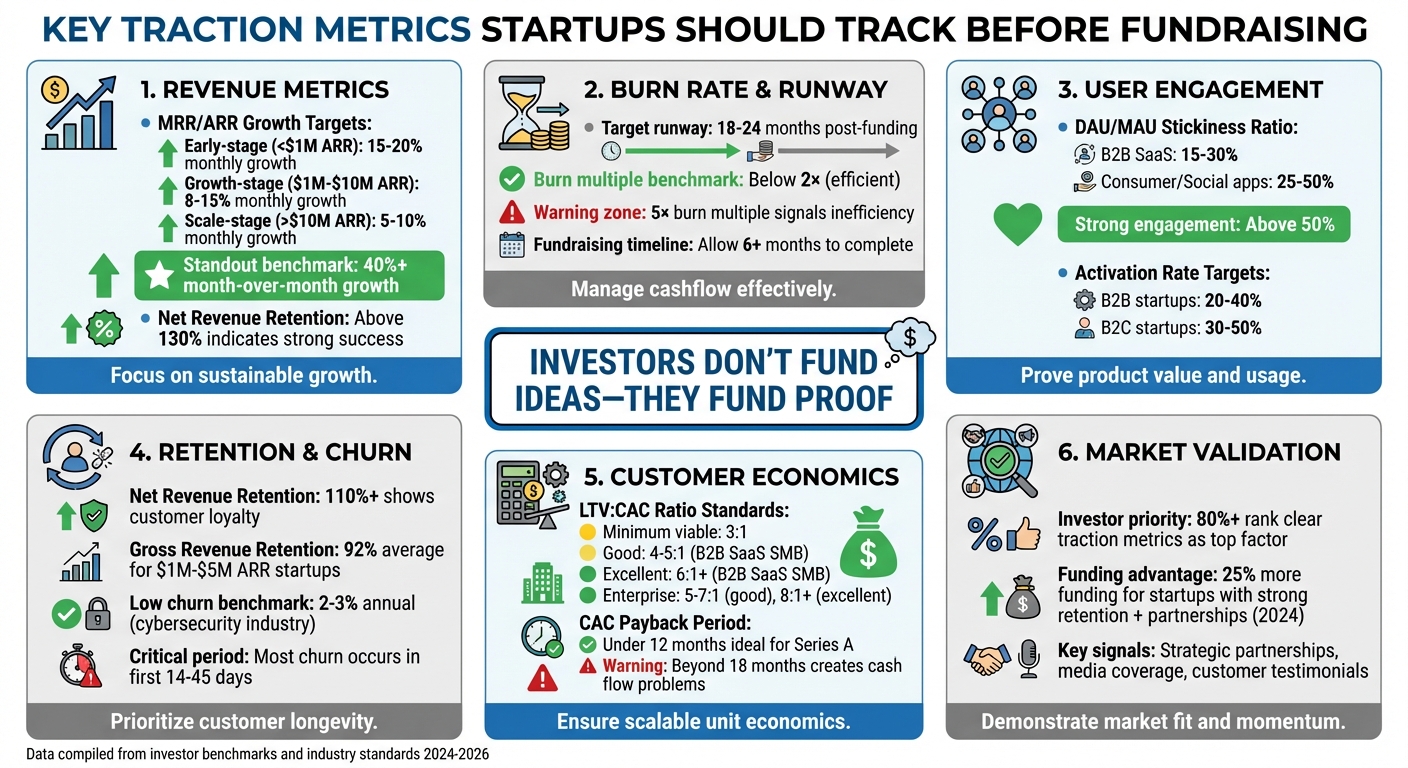
Investors don’t fund ideas - they fund proof. To secure funding, startups need to present clear metrics that demonstrate growth, market demand, and sustainability. The right traction metrics reduce risk for investors and highlight your startup's potential to scale. Here's what to focus on:
- Revenue Metrics: Track Monthly Recurring Revenue (MRR), Annual Recurring Revenue (ARR), and revenue growth rates. For example, early-stage startups should aim for 15–20% monthly MRR growth.
- Burn Rate & Runway: Show cash efficiency by calculating your burn rate and ensuring at least 18–24 months of runway post-funding.
- User Engagement: Measure Daily Active Users (DAU), Monthly Active Users (MAU), and stickiness (DAU/MAU ratio). A ratio above 50% indicates strong engagement.
- Retention & Churn: Monitor churn rates and Net Revenue Retention (NRR). An NRR above 110% signals that customers are staying and spending more.
- Customer Economics: Prioritize a healthy Lifetime Value (LTV) to Customer Acquisition Cost (CAC) ratio of at least 3:1.
- Market Validation: Highlight partnerships, press coverage, and customer testimonials to prove demand and reliability.
These metrics provide the evidence investors need to trust your business model and growth potential.
Essential Traction Metrics Startups Need to Track Before Fundraising
VC Reveals REAL Traction Metrics you need to Raise Venture Capital
sbb-itb-17e8ec9
Revenue and Growth Metrics
Revenue metrics are a key focus for investors, offering concrete proof that a business can generate income and grow sustainably. While metrics like user counts and engagement matter, consistent revenue performance is what really validates a business model.
Monthly Recurring Revenue (MRR) and Annual Recurring Revenue (ARR)
For subscription-based businesses, MRR is a fundamental metric. Each dollar added to MRR compounds over time, reinforcing the strength of your model. When pitching to investors, expect the conversation to shift toward ARR, which is often the preferred metric for boards and fundraising discussions.
"Founders with solid MRR look 10x more fundable." - Build Creatively
ARR, essentially MRR projected over 12 months, helps investors gauge potential returns and establish valuations. Once a business hits around $1M ARR and starts focusing on annual contracts, ARR becomes the go-to metric for reporting.
Breaking MRR into its components provides deeper insights:
- New MRR: Revenue from new customers.
- Expansion MRR: Revenue from upgrades by existing customers.
- Churn MRR: Revenue lost due to customer cancellations.
- Contraction MRR: Revenue lost from customer downgrades.
When Expansion MRR outpaces churn, your existing customers drive growth on their own. A Net Revenue Retention rate above 130% is a strong indicator of long-term success.
Growth expectations vary by stage:
- Early-stage startups (<$1M ARR): Aim for 15–20% monthly MRR growth.
- Growth-stage companies ($1M–$10M ARR): Typically achieve 8–15%.
- Scale-stage companies (>$10M ARR): Usually see 5–10% growth.
If your business is growing at 40% or more month-over-month, make sure to highlight that in your pitch deck - it’s a standout figure.
Revenue Growth Rate and Year-Over-Year Growth
Month-over-month growth measures operational momentum, while year-over-year (YoY) growth smooths out seasonal fluctuations, offering a clearer view of long-term performance. For fundraising, using the Compound Monthly Growth Rate (CMGR) can help present a more accurate picture, especially if revenue has fluctuated.
"Growth speaks louder than adjectives. 40%+ MoM? Highlight it like it's your cofounder." - Build Creatively
Investors also consider growth alongside capital efficiency. For example, a company growing at 12% monthly with a 1.5× burn multiple may be more appealing than one growing at 25% monthly but burning cash at a 5× rate. Be prepared to address any high churn rates, especially if they coincide with recent changes or improvements.
Growth benchmarks by ARR stage:
- <$1M ARR: Up to 100% YoY growth.
- $1M–$5M ARR: Around 50% YoY growth.
- $5M–$20M ARR: Roughly 30% YoY growth.
-
$50M ARR: A YoY growth rate of 15% is common, with a range of 12% to 25%.
"Tracking these metrics provides a really insightful view of a company's business model, sales efficiency, and customer validation. Ultimately, it delivers investors with the key information needed to build conviction during a fundraising process." - Chad Hooker, VP, Fulcrum Equity Partners
While growth metrics showcase revenue momentum, burn rate and runway reveal how well a company manages its cash.
Burn Rate and Cash Runway
Burn rate measures how quickly a company is spending its funds, offering insights into operational efficiency and how long the business can sustain itself without additional financing. Recent market shifts have made capital efficiency a higher priority than growth at all costs. For instance, during a recent "flight to quality", global VC deals dropped by 29% in just one quarter.
To calculate net burn, subtract monthly revenue from operating expenses. Divide your cash reserves by net burn to determine your runway, or the number of months you can operate before running out of money. Most investors now expect startups to maintain 18–24 months of runway after raising funds.
"Investors are not afraid of burn - they're afraid of reckless burn." - Build Creatively, Inc.
Another key metric is the burn multiple, which measures how much cash is spent to generate each new dollar of revenue. Historically, Series A AI companies burned $5 for every $1 of new revenue, but top investors now favor a burn multiple below 2×. A burn multiple of 1× is highly efficient, while a 5× multiple signals inefficiency.
Fundraising often takes six months or more to complete. To avoid last-minute panic, aim to secure funding while you still have at least six months of cash left. Additionally, consider renegotiating vendor contracts and pausing non-essential projects to extend your runway. This strategy reduces perceived risk and helps you avoid raising funds under unfavorable conditions.
User Acquisition and Engagement Metrics
Revenue shows your business is making money, but engagement is what proves your product resonates with users. These metrics highlight whether you've achieved product-market fit and if your growth is driven by real demand instead of excessive marketing. While revenue validates your business model, engagement metrics demonstrate that users find value in what you offer.
Monthly Active Users (MAU) and Daily Active Users (DAU)
Monthly Active Users (MAU) tracks the number of unique users interacting with your product over a rolling 30-day period. Daily Active Users (DAU) measures unique users performing a defined action within a single day. The DAU/MAU ratio, often referred to as "stickiness", shows the percentage of monthly users who engage daily.
Stickiness benchmarks vary by industry. For example:
- B2B SaaS companies often see ratios between 15–30%.
- Consumer-focused or social apps should aim for 25–50%.
This ratio is a key indicator of user engagement. For instance, if your project management tool has 100,000 monthly users but only 20,000 use it daily, your DAU/MAU ratio is 20% - a healthy figure for B2B tools.
"Traction is quantitative evidence of market demand." - Naval Ravikant, Founder, AngelList
However, high MAU with low DAU can be a red flag. It suggests you’re good at attracting users but not retaining them, making it a "vanity metric". When sharing these numbers, focus on the growth trajectory. Investors often glance at a traction slide for just 5–7 seconds, looking for consistent upward trends rather than static large numbers.
Conversion and Activation Rates
Beyond engagement, conversion and activation rates provide deeper insights into your product's value. The activation rate measures how many users complete a key action that reveals your product’s core value - their "aha moment." For example:
- In a collaboration tool, it could be inviting a teammate or starting a project.
- For B2B startups, aim for 20–40% activation rates; B2C companies should target 30–50%.
Clearly defining your activation event is essential. For instance, if 1,000 users sign up but only 250 create a workspace, your 25% activation rate might point to onboarding challenges. Meanwhile, conversion rate focuses on how efficiently leads turn into paying customers, showing how well your sales process works.
"No amount of marketing dollars can fix a product, so make sure that your growth is coming from the product itself." - Bryan Kim, Investor, A16Z
Today’s investors prioritize sustainable growth over aggressive scaling. Demonstrate that users activate because they find genuine value in your product - not because of heavy spending on promotions. Startups with strong retention and profitability metrics secured 25% more funding in 2024 compared to those without.
Retention and Churn Metrics
Acquiring new customers can be expensive, but keeping them is where the real payoff lies. Retention showcases a product's value and longevity, while churn highlights customer loss. Together, these metrics reveal how "sticky" your product is and whether users see long-term value in it.
"Growth without retention is a mirage. If customers leave faster than they are replaced, the business isn't growing - it's leaking." - Lior Ronen, Founder, Finro Financial Consulting
Investors pay close attention to these numbers because they reflect whether your business model is built to last. For instance, a Net Revenue Retention (NRR) of 110% or more indicates that your existing customers are not only sticking around but also spending more over time - a strong sign of loyalty and trust. In industries like cybersecurity, where switching costs can be high, annual churn rates of just 2–3% are often expected.
Retention metrics tie together revenue growth and customer loyalty, underscoring your business's scalability and long-term potential.
Churn Rate and Retention Rate
Churn rate is calculated by dividing the number of customers lost during a specific period by the total number of customers at the start of that period, then multiplying by 100. Revenue churn, on the other hand, focuses on the financial impact of losing high-value customers. Most churn typically happens within the first 14 to 45 days, which is why it's crucial to guide users toward their "aha moment" as quickly as possible.
Investors often look at the retention curve to see if it stabilizes after the initial drop. A flat curve suggests that the remaining users find genuine value in your product. Breaking down churn by customer type or acquisition channel can help identify problem areas, giving you actionable insights to improve retention. This analysis also sets the stage for measuring customer sentiment through tools like NPS.
Net Promoter Score (NPS)
Net Promoter Score (NPS) measures how likely customers are to recommend your product to others. Unlike churn, which reflects past behavior, NPS is forward-looking - it predicts customer loyalty and potential for organic growth. A high NPS indicates that customers are happy with your product and may even become advocates, reducing your dependency on paid marketing.
"High customer retention metrics are a strong indicator that users find value, that your product is meeting a real need, and that people are coming back without being chased." - Peter Lowe, Crazy Egg
When you combine NPS with churn analysis, you can uncover deeper insights into customer satisfaction. For example, if your NPS is high but churn remains significant, it could point to a specific issue in the user experience. Consider this: startups with $1M to $5M in ARR saw an average gross revenue retention of 92% in 2025, down slightly from 95% in 2024. Benchmarking your metrics against industry standards not only helps you identify areas for growth but also signals to investors that you have a clear understanding of your company's performance and challenges.
Customer Economics Metrics
Customer economics help determine if your business model is financially sound. They answer a critical question for investors: Can you acquire customers profitably at scale? If acquiring a customer costs more than they'll ever generate in revenue, no amount of rapid growth can salvage the business.
By 2026, the "growth-at-all-costs" mindset has faded. Investors now favor businesses that demonstrate efficient, sustainable growth over those chasing massive user numbers without solid unit economics. Startups showcasing strong customer economics not only prove their current viability but also their ability to use capital effectively as they grow. These metrics build on earlier traction data, offering a clearer view of scalable success.
"LTV:CAC is the single best proxy for whether your growth engine creates value or destroys it."
- Ivan Gowan, CEO and Founder, Opagio
The balance between what you spend to acquire customers and what they contribute over time determines if you're building a scalable business - or a "zombie" company that grows too slowly to ever achieve profitability due to flawed unit economics.
Customer Acquisition Cost (CAC) and Lifetime Value (LTV)
Customer Acquisition Cost (CAC) represents the total expense of acquiring one paying customer, while Lifetime Value (LTV) measures the gross profit a customer generates over their lifetime with your business. The LTV:CAC ratio is a key indicator of whether your business can acquire and retain customers profitably.
A healthy LTV:CAC ratio is at least 3:1, meaning every dollar spent on acquisition should yield three dollars in gross profit. Leading startups often achieve ratios of 5:1 or higher, but excessively high ratios could suggest under-investment in growth.
To calculate these metrics accurately:
- Include all sales and marketing costs in CAC - this means salaries, commissions, tools, agency fees, and content creation.
- Base LTV on gross profit, not revenue. Revenue-based LTV can inflate perceived value and undermine trust during investor reviews.
| Business Model | Minimum Viable LTV:CAC | "Good" LTV:CAC | "Excellent" LTV:CAC |
|---|---|---|---|
| B2B SaaS (SMB) | 3:1 | 4–5:1 | 6:1+ |
| B2B SaaS (Enterprise) | 3:1 | 5–7:1 | 8:1+ |
| Marketplace | 2:1 | 3–4:1 | 5:1+ |
| E-commerce (DTC) | 2:1 | 3:1 | 4:1+ |
| Fintech | 3:1 | 5–6:1 | 8:1+ |
Source: Opagio
Another important metric is the CAC payback period, which measures how long it takes to recover the cost of acquiring a customer. For Series A SaaS companies, a payback period under 12 months is ideal. If it stretches beyond 18 months, even a strong LTV:CAC ratio can lead to cash flow problems. This "cash trap" ties up capital for too long before it becomes profitable, creating financial strain. Strong customer economics not only validate your business model but also reassure investors that growth won't require constant bailouts.
"A strong LTV:CAC ratio isn't a trophy. It's a promise that growth won't keep asking for rescue funding."
- Kishen Patel, Founder, Consult EFC
Investors now prefer cohort-based analysis over blended averages. Breaking down LTV and churn by customer cohorts provides deeper insights. If newer cohorts show declining LTV or rising churn compared to earlier ones, it could signal that your product-market fit is weakening as you scale.
Cost Per Acquisition (CPA)
While CAC measures the overall cost of acquiring a paying customer, Cost Per Acquisition (CPA) focuses on the efficiency of specific marketing channels or campaigns. CPA often tracks costs for generating leads, trial signups, or other conversion milestones before a customer starts paying.
Understanding CPA helps pinpoint inefficiencies in your funnel. For example, you might achieve a low CPA for generating leads but still face a high CAC when converting those leads into paying customers. This could highlight issues with your sales process or onboarding rather than your marketing efforts.
Blended CAC can obscure channel-specific inefficiencies. Tracking CAC by channel reveals where your growth is coming from and where you're losing money. For instance, if your blended CAC is $500, but paid search costs $1,200 per customer while organic channels cost $150, you gain critical insight into which strategies are working and which need adjustment.
To improve both CPA and CAC:
- Optimize conversion rates at every stage of the funnel.
- Experiment with A/B testing for landing pages.
- Simplify signup processes and add social proof to build trust.
When calculating these metrics, align marketing spend with the customers acquired during the same period. For example, if your sales cycle is 60 days, match March's marketing costs with May's customer acquisitions. This adjustment ensures your metrics reflect actual business performance.
Market Validation and Credibility Metrics
When it comes to traction, the numbers alone don’t tell the whole story. Qualitative signals - the "why" behind the metrics - play a key role in shaping your startup’s narrative. As investors increasingly lean on evidence-based decision-making, external credibility signals have become just as important as financial performance. In fact, over 80% of investors now rank clear traction metrics, including qualitative indicators, as a top priority when deciding where to place their funds.
Market validation metrics highlight that your growth isn’t just a fluke but is grounded in real market demand. These metrics show that customers, industry players, and even the media recognize your value. They reduce perceived risk by proving your business fits into a thriving ecosystem, not an isolated bubble.
"Traction is not the numbers themselves. Traction is what those numbers prove about your business."
- Funding Blueprint
Strategic partnerships, customer testimonials, and press coverage all contribute to this validation. Partnerships with established companies not only confirm your relevance but also open doors to distribution channels that could take years to build on your own. Media coverage boosts your visibility, creating a sense of momentum. And customer testimonials? They turn raw data into relatable stories, showing investors the real-world impact of your product.
Media Coverage and Partnerships
Third-party recognition - like press mentions, awards, or participation in accelerator programs - sends a strong message to investors. It shows that journalists, industry experts, and respected organizations see your startup as worth paying attention to. Thought leadership, such as speaking at industry events or publishing insights, further positions your team as experts in your field, boosting investor confidence.
Strategic partnerships, however, pack even more punch. When an established company collaborates with your startup, it’s essentially a stamp of approval. These alliances can provide immediate access to new markets, customer bases, and proven distribution channels. For B2B startups, enterprise contracts or strategic partnerships are among the strongest forms of market validation.
But don’t just name-drop partnerships when pitching to investors. Instead, explain how each partnership accelerates growth or improves distribution. This context transforms a partnership from a flashy mention into concrete proof of scalability.
Partnerships can also improve your unit economics by lowering Customer Acquisition Costs (CAC). Startups that paired stable partnerships with strong retention metrics raised 25% more funding in 2024 than those that didn’t. Highlight your most impactful partnerships early in your pitch deck - ideally on slides 2 or 3 - to build investor confidence right from the start.
These validation signals create a foundation for personal endorsements, which further strengthen your case.
Customer Testimonials and Success Stories
While external validation builds credibility, customer testimonials bring your product’s impact to life. Investors often connect more deeply with specific customer stories than with raw data. A well-crafted case study that demonstrates how your product solved a major problem, delivered measurable ROI, and became essential to operations provides qualitative proof of product-market fit.
For B2B startups, case studies are especially powerful. They demonstrate not only that your product works but that customers trust it enough to integrate it into their workflows. To make testimonials impactful, focus on specifics. Instead of generic praise, highlight measurable results - like cutting operational costs by a clear percentage.
Document the customer’s challenge, how your product addressed it, and the measurable outcomes. This before-and-after story helps investors see the scale of the problem you’re solving and the tangible benefits of your solution. Include detailed case studies or full customer quotes in your appendix for investors who want to dive deeper during due diligence.
Customer testimonials also signal potential for word-of-mouth growth and retention. When customers publicly endorse your product, it shows strong satisfaction and reduces the perceived risk for investors. In today’s funding landscape, where traction is the main filter for evaluating opportunities, these stories offer compelling, human proof that your metrics are grounded in real-world success.
Using Lucid Financials for Investor-Ready Metrics
Manually tracking traction metrics with spreadsheets often leads to mistakes that can erode investor confidence. When you're balancing growth, hiring, and product development, keeping precise financial records can easily fall by the wayside. Lucid Financials solves this problem by blending AI-driven automation with expert financial guidance. The result? Clean books in just seven days and continuous investor-ready reporting.
Lucid integrates seamlessly with Slack, giving you real-time insights into critical metrics like your runway, burn rate, or monthly recurring revenue (MRR). This ensures you can monitor essential figures such as MRR growth, cash runway, and Customer Acquisition Cost (CAC) with the precision investors expect. By automatically tracking and categorizing transactions, Lucid's AI delivers reliable insights and enables accurate forecasting.
Real-Time Financial Insights and Forecasting
Lucid goes beyond just tracking - it provides live updates on revenue, expenses, and cash flow, giving you a clear and current snapshot of your financial health. For instance, if your monthly expenses suddenly exceed $50,000, the platform sends an alert via Slack, flagging potential risks to your runway. Similarly, if your Average Revenue Per User (ARPU) dips below $100, you'll know right away - no more waiting until the end-of-month close to spot issues.
The AI-powered forecasting tools analyze historical data to predict future outcomes. For example, you can model scenarios like achieving 12% month-over-month MRR growth, allowing you to extend your runway to 18 months. This data-driven approach aligns with investor expectations for predictable growth patterns, such as the 5–7% weekly growth Paul Graham recommends for early-stage startups. Lucid also processes large datasets to uncover trends in unit economics, helping you identify high-performing acquisition channels and areas with strong retention.
Board-Ready and Investor-Grade Reporting
Lucid simplifies the creation of polished, professional reports featuring visual breakdowns of critical metrics such as LTV/CAC ratios, churn rates, and year-over-year growth. These reports are formatted to U.S. standards and include cohort analysis and benchmarks that satisfy due diligence requirements. Instead of scrambling to compile financials when investors make a request, you'll have audit-ready dashboards at your fingertips. These dashboards highlight traction signals like consistent 8% month-over-month growth over six months or efficient CAC payback periods, demonstrating strong capital management.
With Lucid's always-on reporting, you're prepared for investor scrutiny at any moment - not just during fundraising rounds. This level of transparency accelerates the fundraising process and showcases your team's commitment to disciplined financial management.
Conclusion
Fundraising isn’t about dazzling investors with dreams and ideas - it’s about proving you’ve already built something solid. The metrics outlined in this guide - like MRR, burn rate, CAC, LTV, and retention - are all about answering one key question: Can this business scale in a reliable and profitable way?
As Matt Thomas, Co-founder & COO of ThatRound, explains, “Traction is what transforms a great story into a credible investment case”. Investors aren’t swayed by passion or potential alone - they’re looking for evidence of a system that works. Metrics like steady month-over-month growth of 10–20%, a 3:1 LTV to CAC ratio, and retention rates such as a DAU/MAU ratio of 50% or higher show that your business is on the right track [2,4].
The difference between securing funding and walking away empty-handed often boils down to preparation and transparency. Clean, well-organized data allows you to address vital questions about unit economics, runway, and growth trajectory before they even come up. This approach shifts the dynamic from making a pitch to negotiating from a position of confidence.
Manually tracking these metrics can be risky - it opens the door to errors and missed insights. That’s where Lucid Financials steps in. Its AI-powered automation, real-time Slack notifications, and always-available investor-grade reports ensure you’re fully prepared. With Lucid Financials, your data will be precise, your story will be backed by hard numbers, and you’ll walk into every investor meeting with undeniable credibility.
FAQs
Which traction metrics matter most for my stage?
The key traction metrics for your startup will vary depending on its growth stage.
For early-stage startups, the emphasis should be on customer engagement and validating product-market fit. Metrics like Customer Acquisition Cost (CAC), Lifetime Value (LTV), retention rate, and revenue growth are critical at this phase.
When gearing up for fundraising, shift your focus to financial health. Metrics such as Monthly Recurring Revenue (MRR), burn rate, cash runway, and gross margin become essential in showcasing your scalability and operational efficiency to potential investors.
How do I calculate LTV and CAC correctly?
To figure out your Customer Acquisition Cost (CAC), take the total amount spent on sales and marketing and divide it by the number of new customers you’ve gained. Be sure to include all related expenses - this means salaries, advertising costs, commissions, and any other relevant spending.
For Customer Lifetime Value (LTV), calculate the average revenue a customer brings in over their entire relationship with your business. Don’t forget to account for factors like customer retention, upselling opportunities, and churn rates. Accurate inputs and historical data are crucial here, as these numbers play a huge role in showcasing consistent, scalable growth to potential investors.
What makes metrics “investor-ready” for fundraising?
Metrics become "investor-ready" when they are precise, align with industry standards, and clearly highlight growth potential. They should offer real-time insights into your business's performance, promoting transparency and building trust with investors. Meeting these criteria can go a long way in boosting your credibility during fundraising efforts.